The Welcome Tour is a first-run introduction to Cryostat that you will see the first time you log in.
If you clear your browser’s local storage, use a private browsing window, or use a different browser, you will see the Tour again.
Welcome TourClick through the Welcome Tour to learn how to use Cryostat.
The Welcome Tour provides an introduction to Cryostat's layout and indicates where further tutorials and help can be found.
If you have completed the tour previously, feel free to click Skip Tour and dive right in to Cryostat.
If you have not completed the tour previously and are unsure what Cryostat can do or how to use it, click Get Started
to begin the guided walkthrough of the Cryostat Web application.
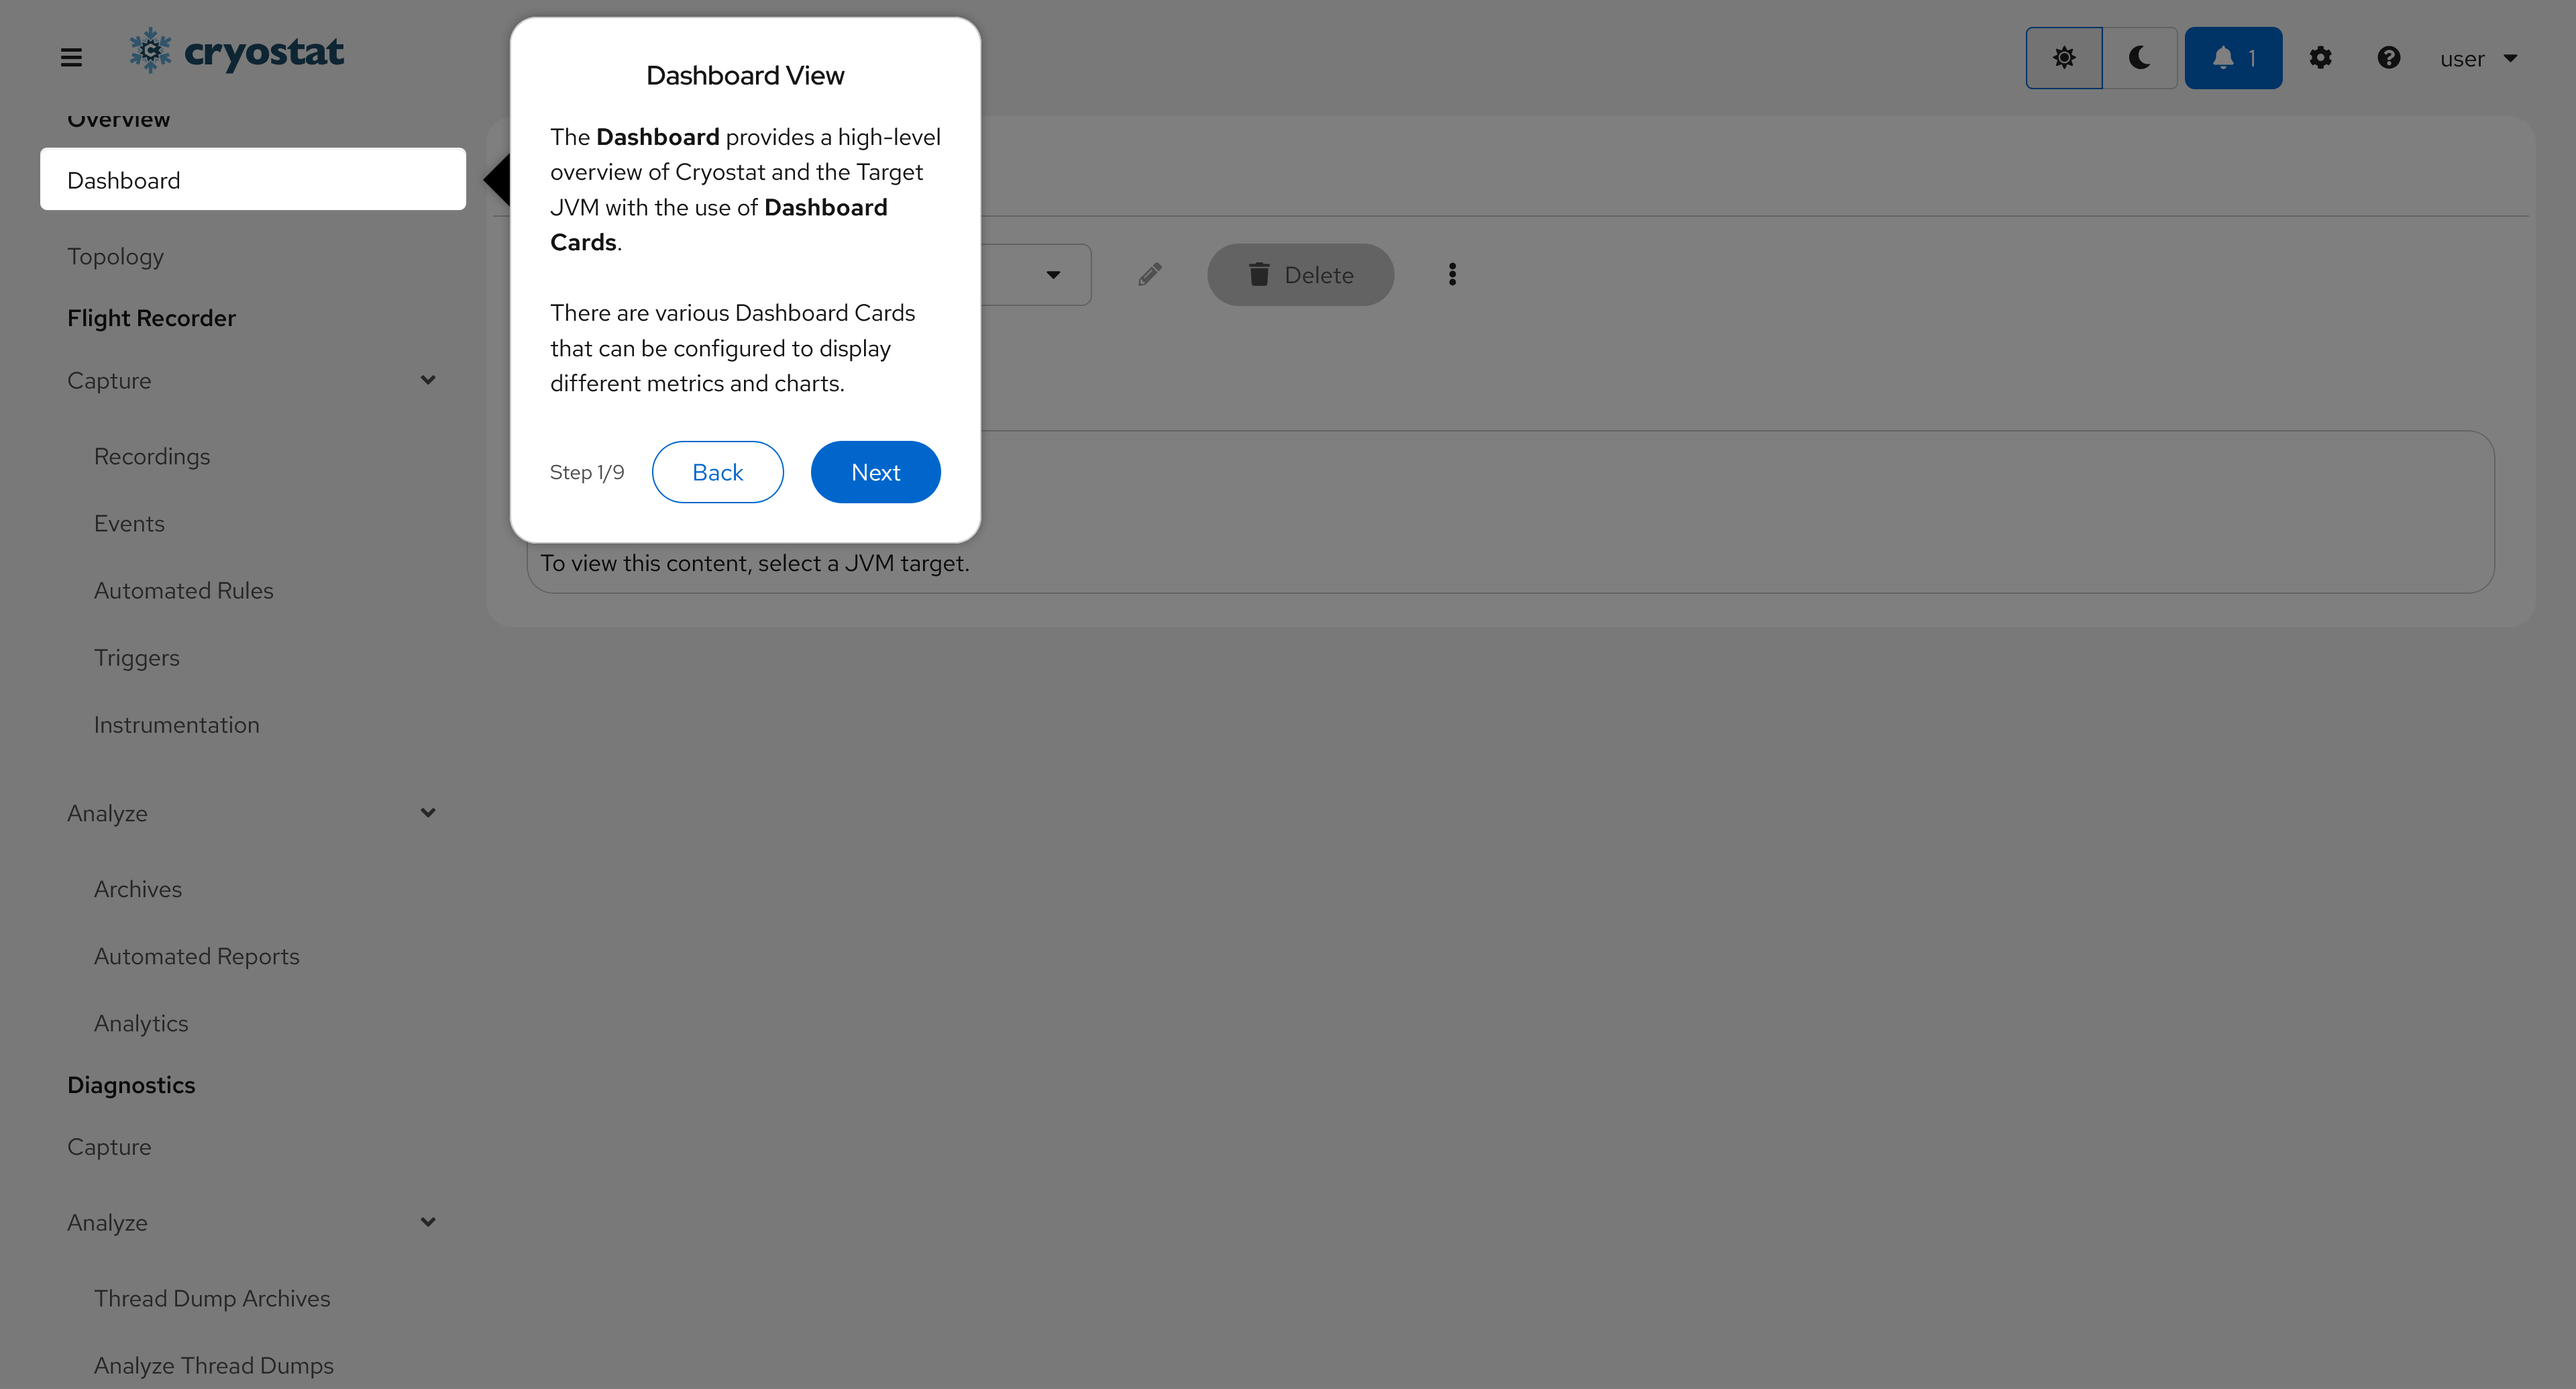
Tour BeginsClick Next through the Welcome Tour to learn how to use **Cryostat**.
Continue through the tour to learn how the UI is organized and where you can find additional help.
You can return to the tour and revisit its contents at any time.
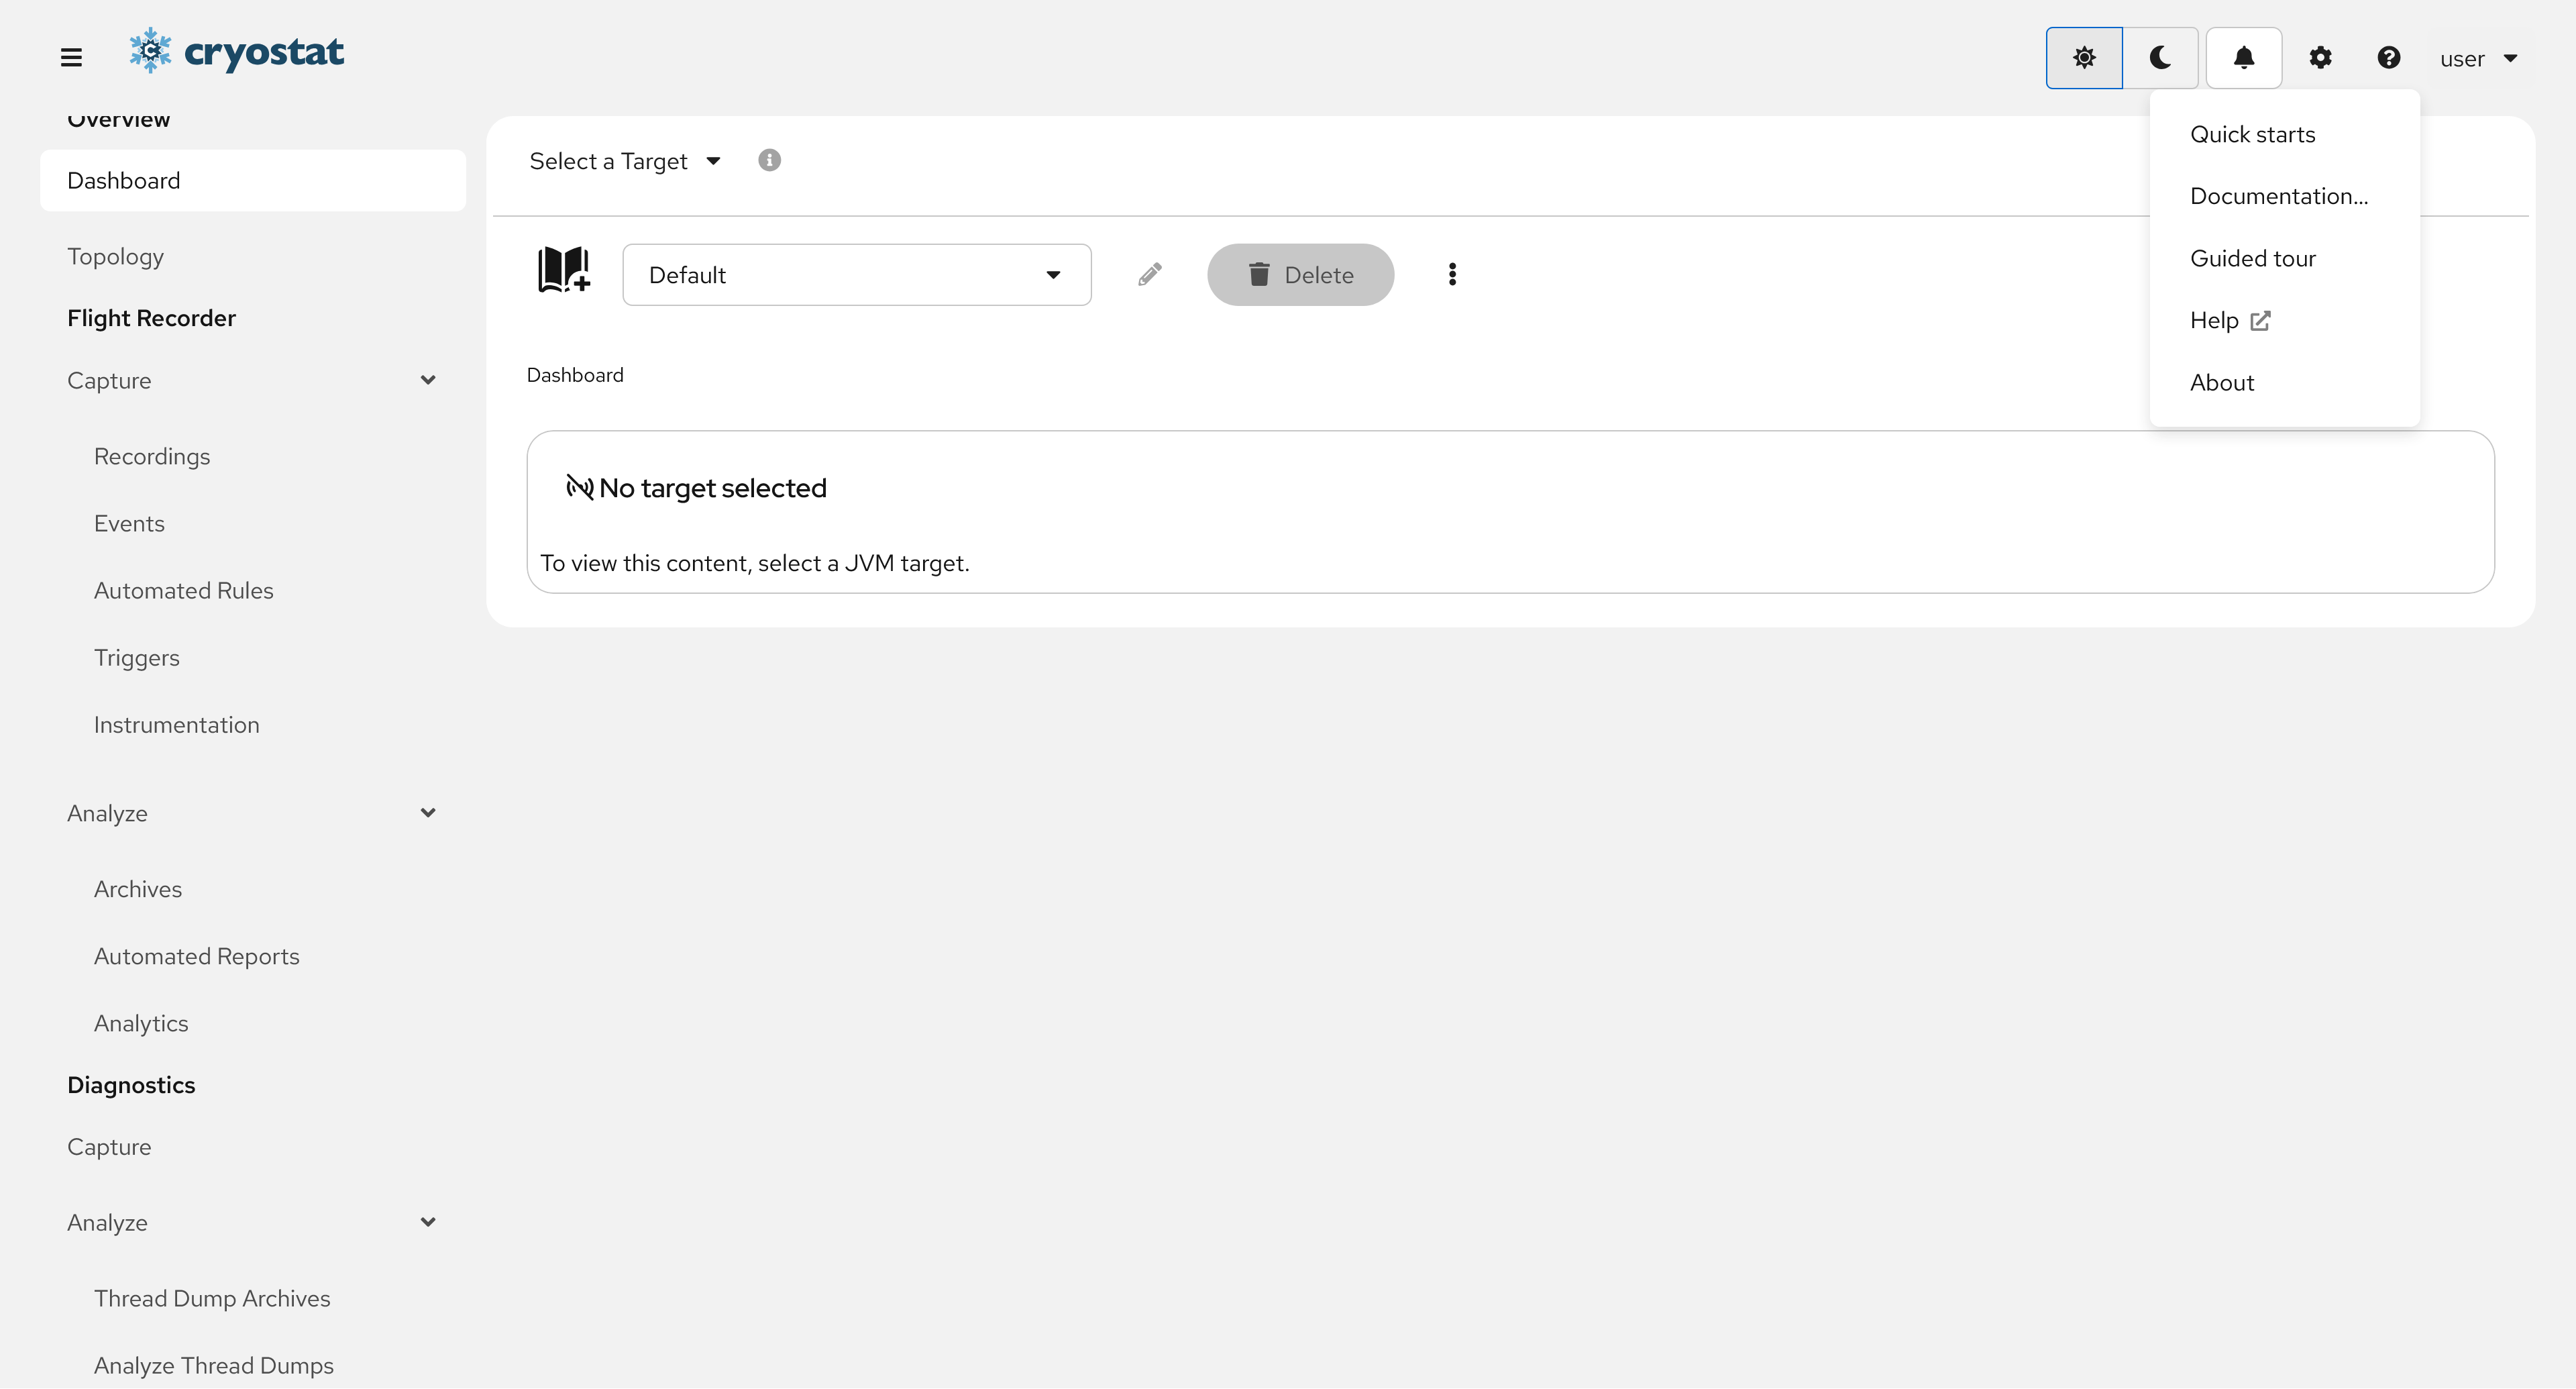
Whenever you feel the need to return to the tour and revisit its contents, simply click the ?Help icon in the
application masthead, then click Guided tour in the dropdown menu that appears.
Open Help MenuThe ?Help menu on the application masthead contains additional resources.
Click Guided tour to relaunch the same tour.
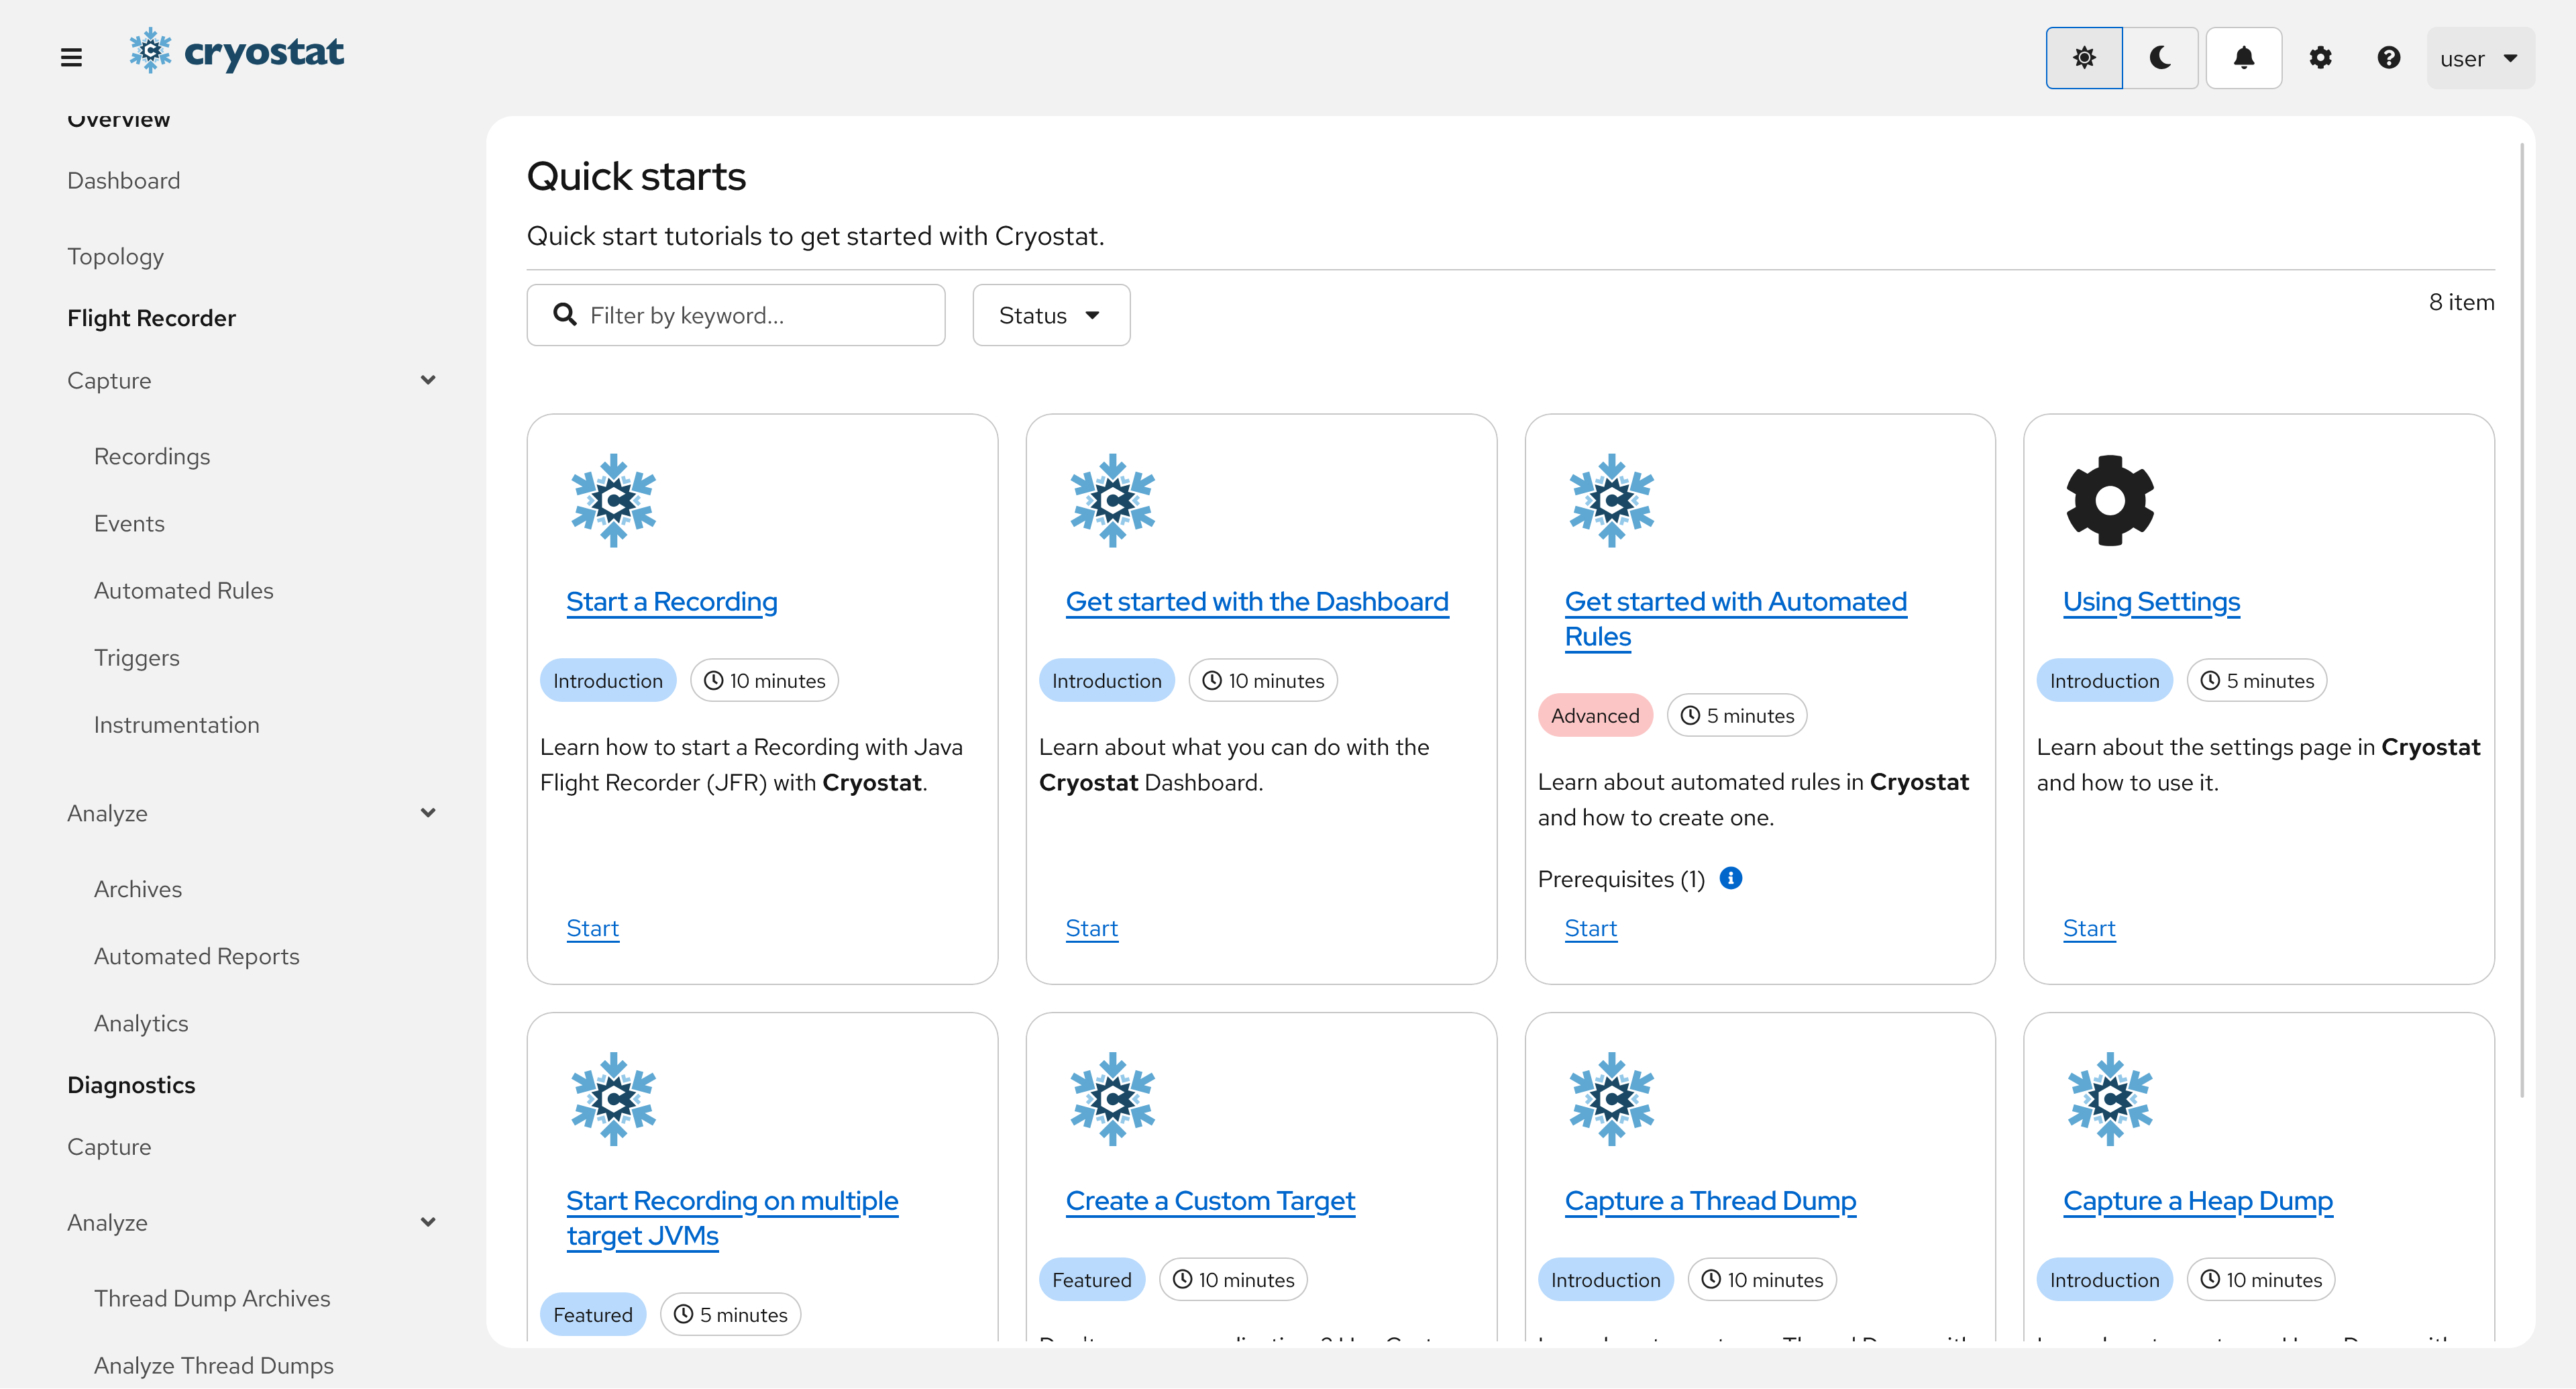
Cryostat also includes some Quick Start online tutorials to guide you through some common tasks. These are more in-depth
and will directly guide you through the UI as you complete them by operating on your own real applications.
Open Help MenuThe ?Help menu on the application masthead contains additional resources.
Click Quick Starts to view the tutorial catalog.
View the Quick Start CatalogThe Quick Start catalog contains a series of tutorials you can follow to learn how to accomplish specific tasks.
Select and complete the tutorials which interest you. You can revisit this catalog at any time and re-do tutorials as many times as you like.
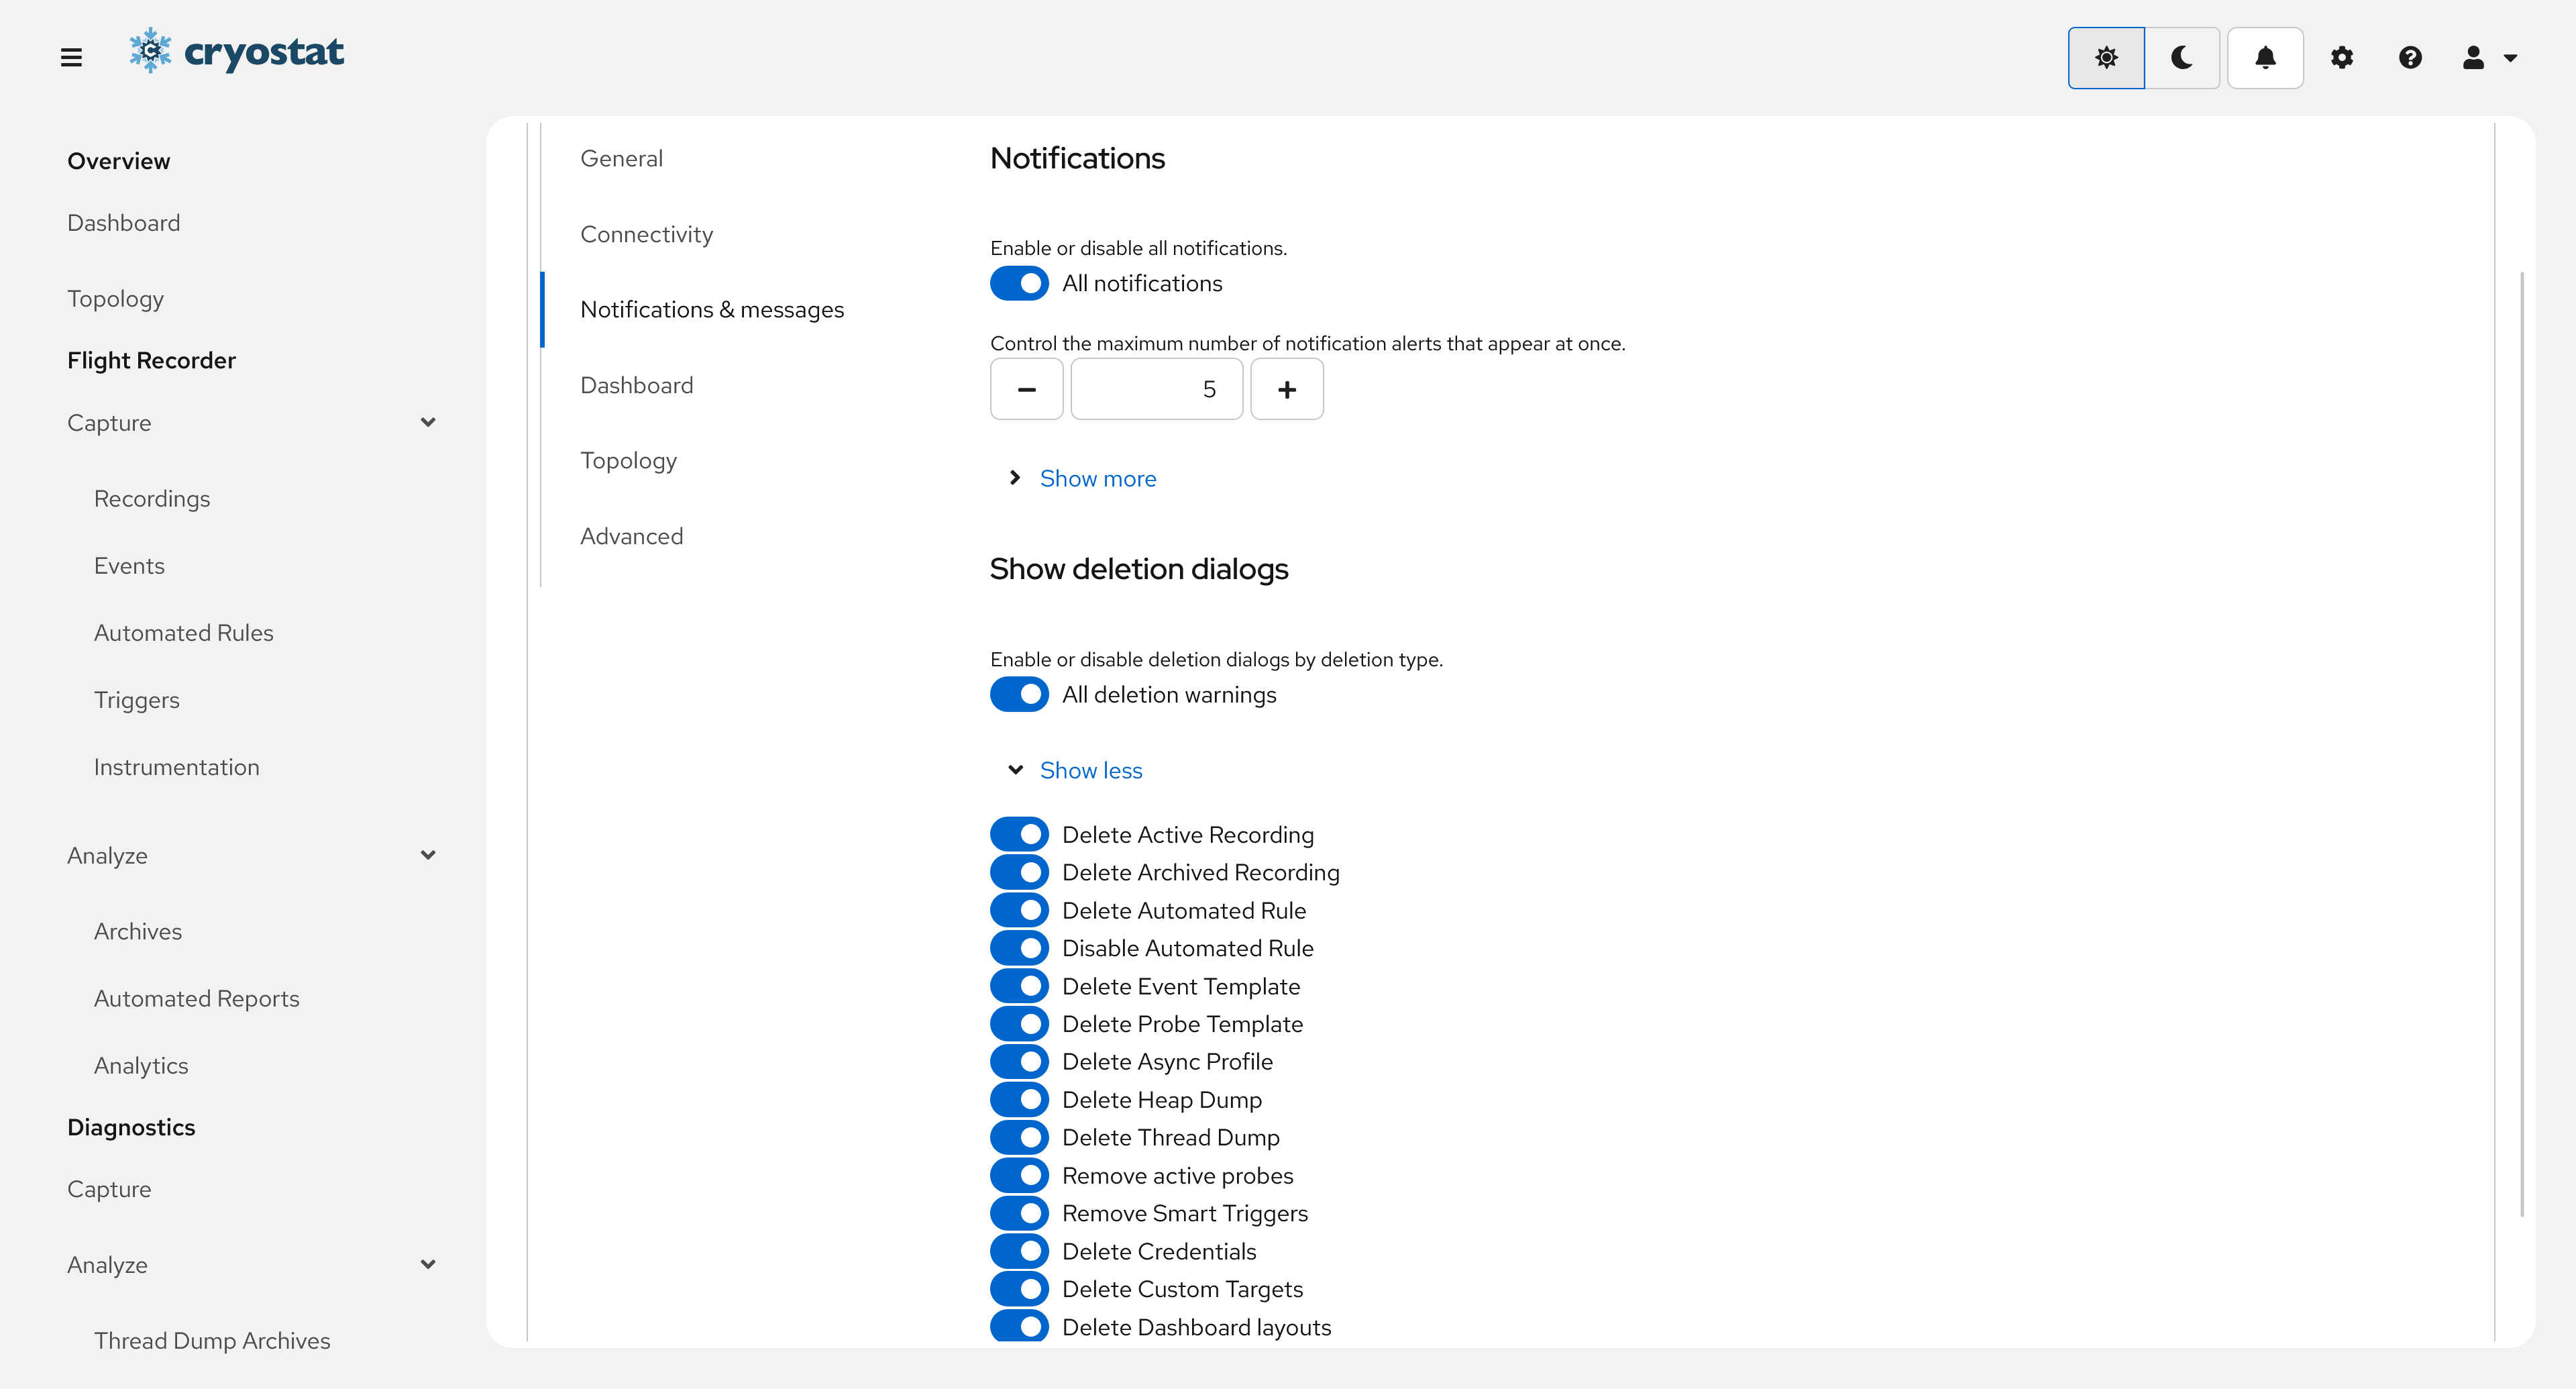
Some features in the web-client UI are Beta-level features. This indicates that they are still underdoing design and development, and may have significant limitations, or be redesigned or even removed in the future.
For those reasons, Beta features are hidden by default in the Cryostat UI. They can be enabled by following the steps below.
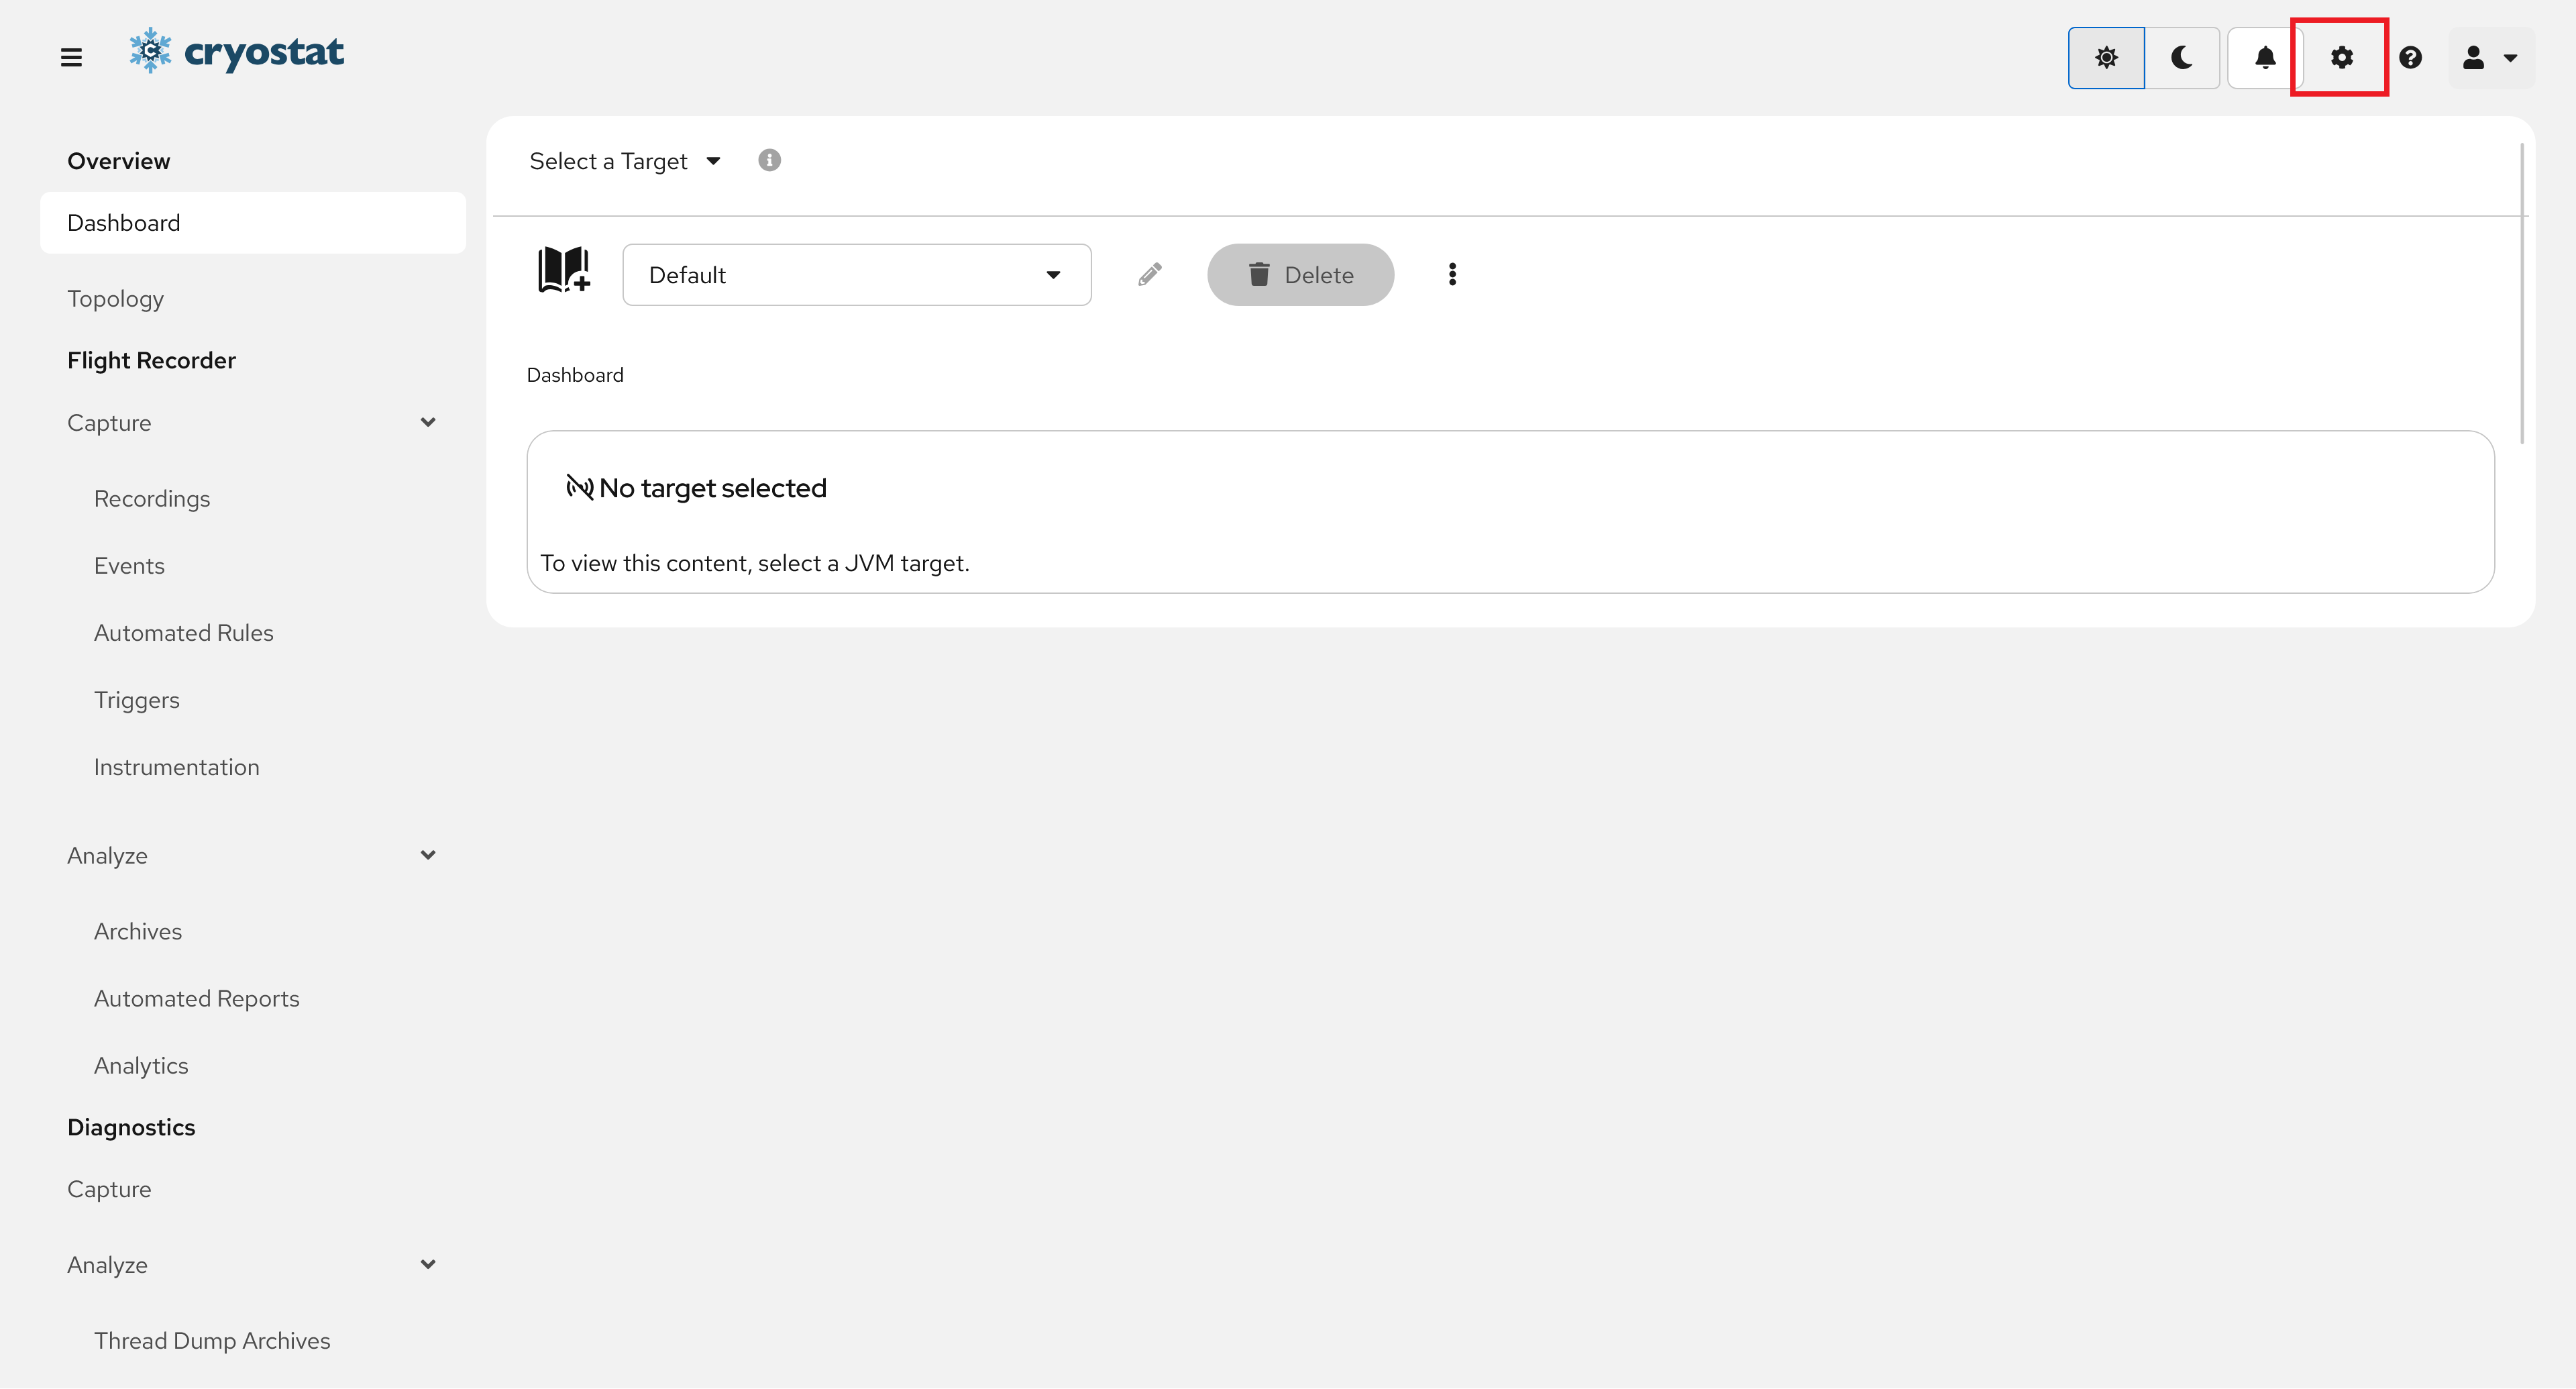
Navigate to Settings
Click the cog or gear icon in the application masthead to access the Settings view.
The Settings view contains web-client instance configuration settings. These
affect the appearance or behaviour of the web-client frontend only, not the
behaviour of the Cryostat backend server. These frontend settings are persisted
to web browser local storage only.
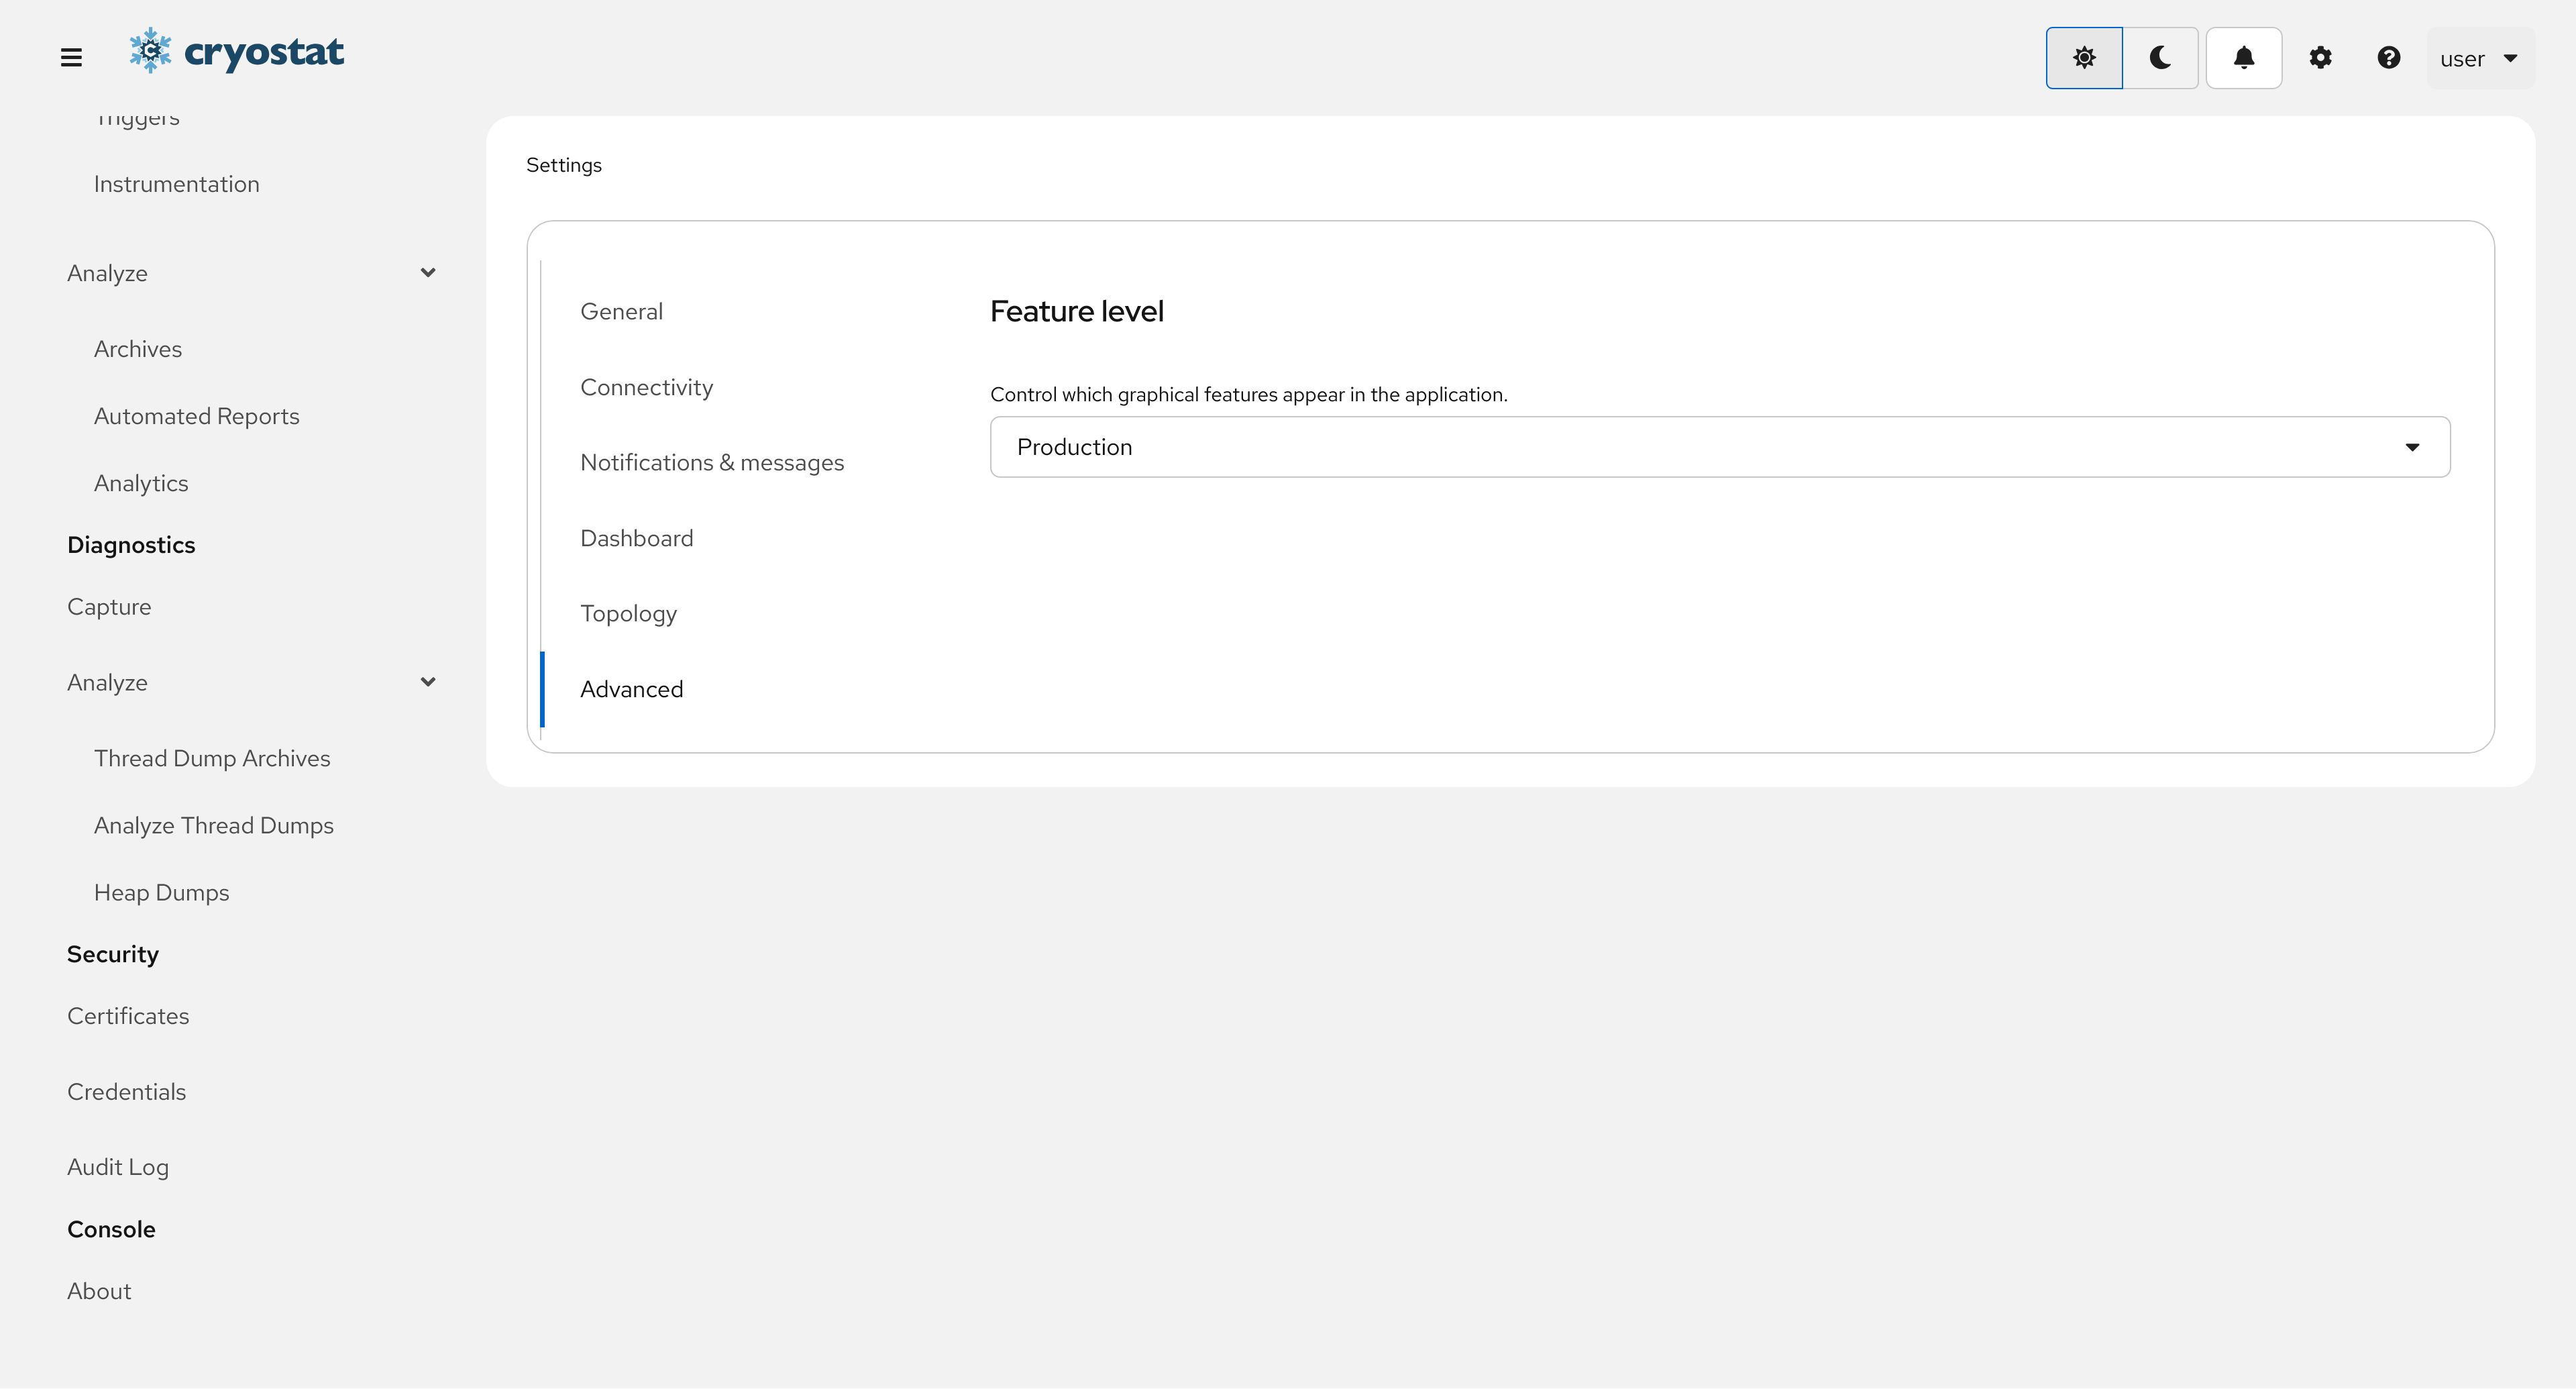
Locate the Advanced settings
The Advanced tab within this view contains a control to set the Feature Level of the UI. This is set to Production by default. You can enable additional features by setting this to Beta, with the aforementioned caveats in mind. Once this is set, a Beta badge will appear on the Cryostat application titlebar. Additional features enabled by this setting, such as Dashboard cards, will be labelled with a similar badge to indicate the feature level. If you set the feature level back to Production then any Beta-level features will be hidden from the UI again.
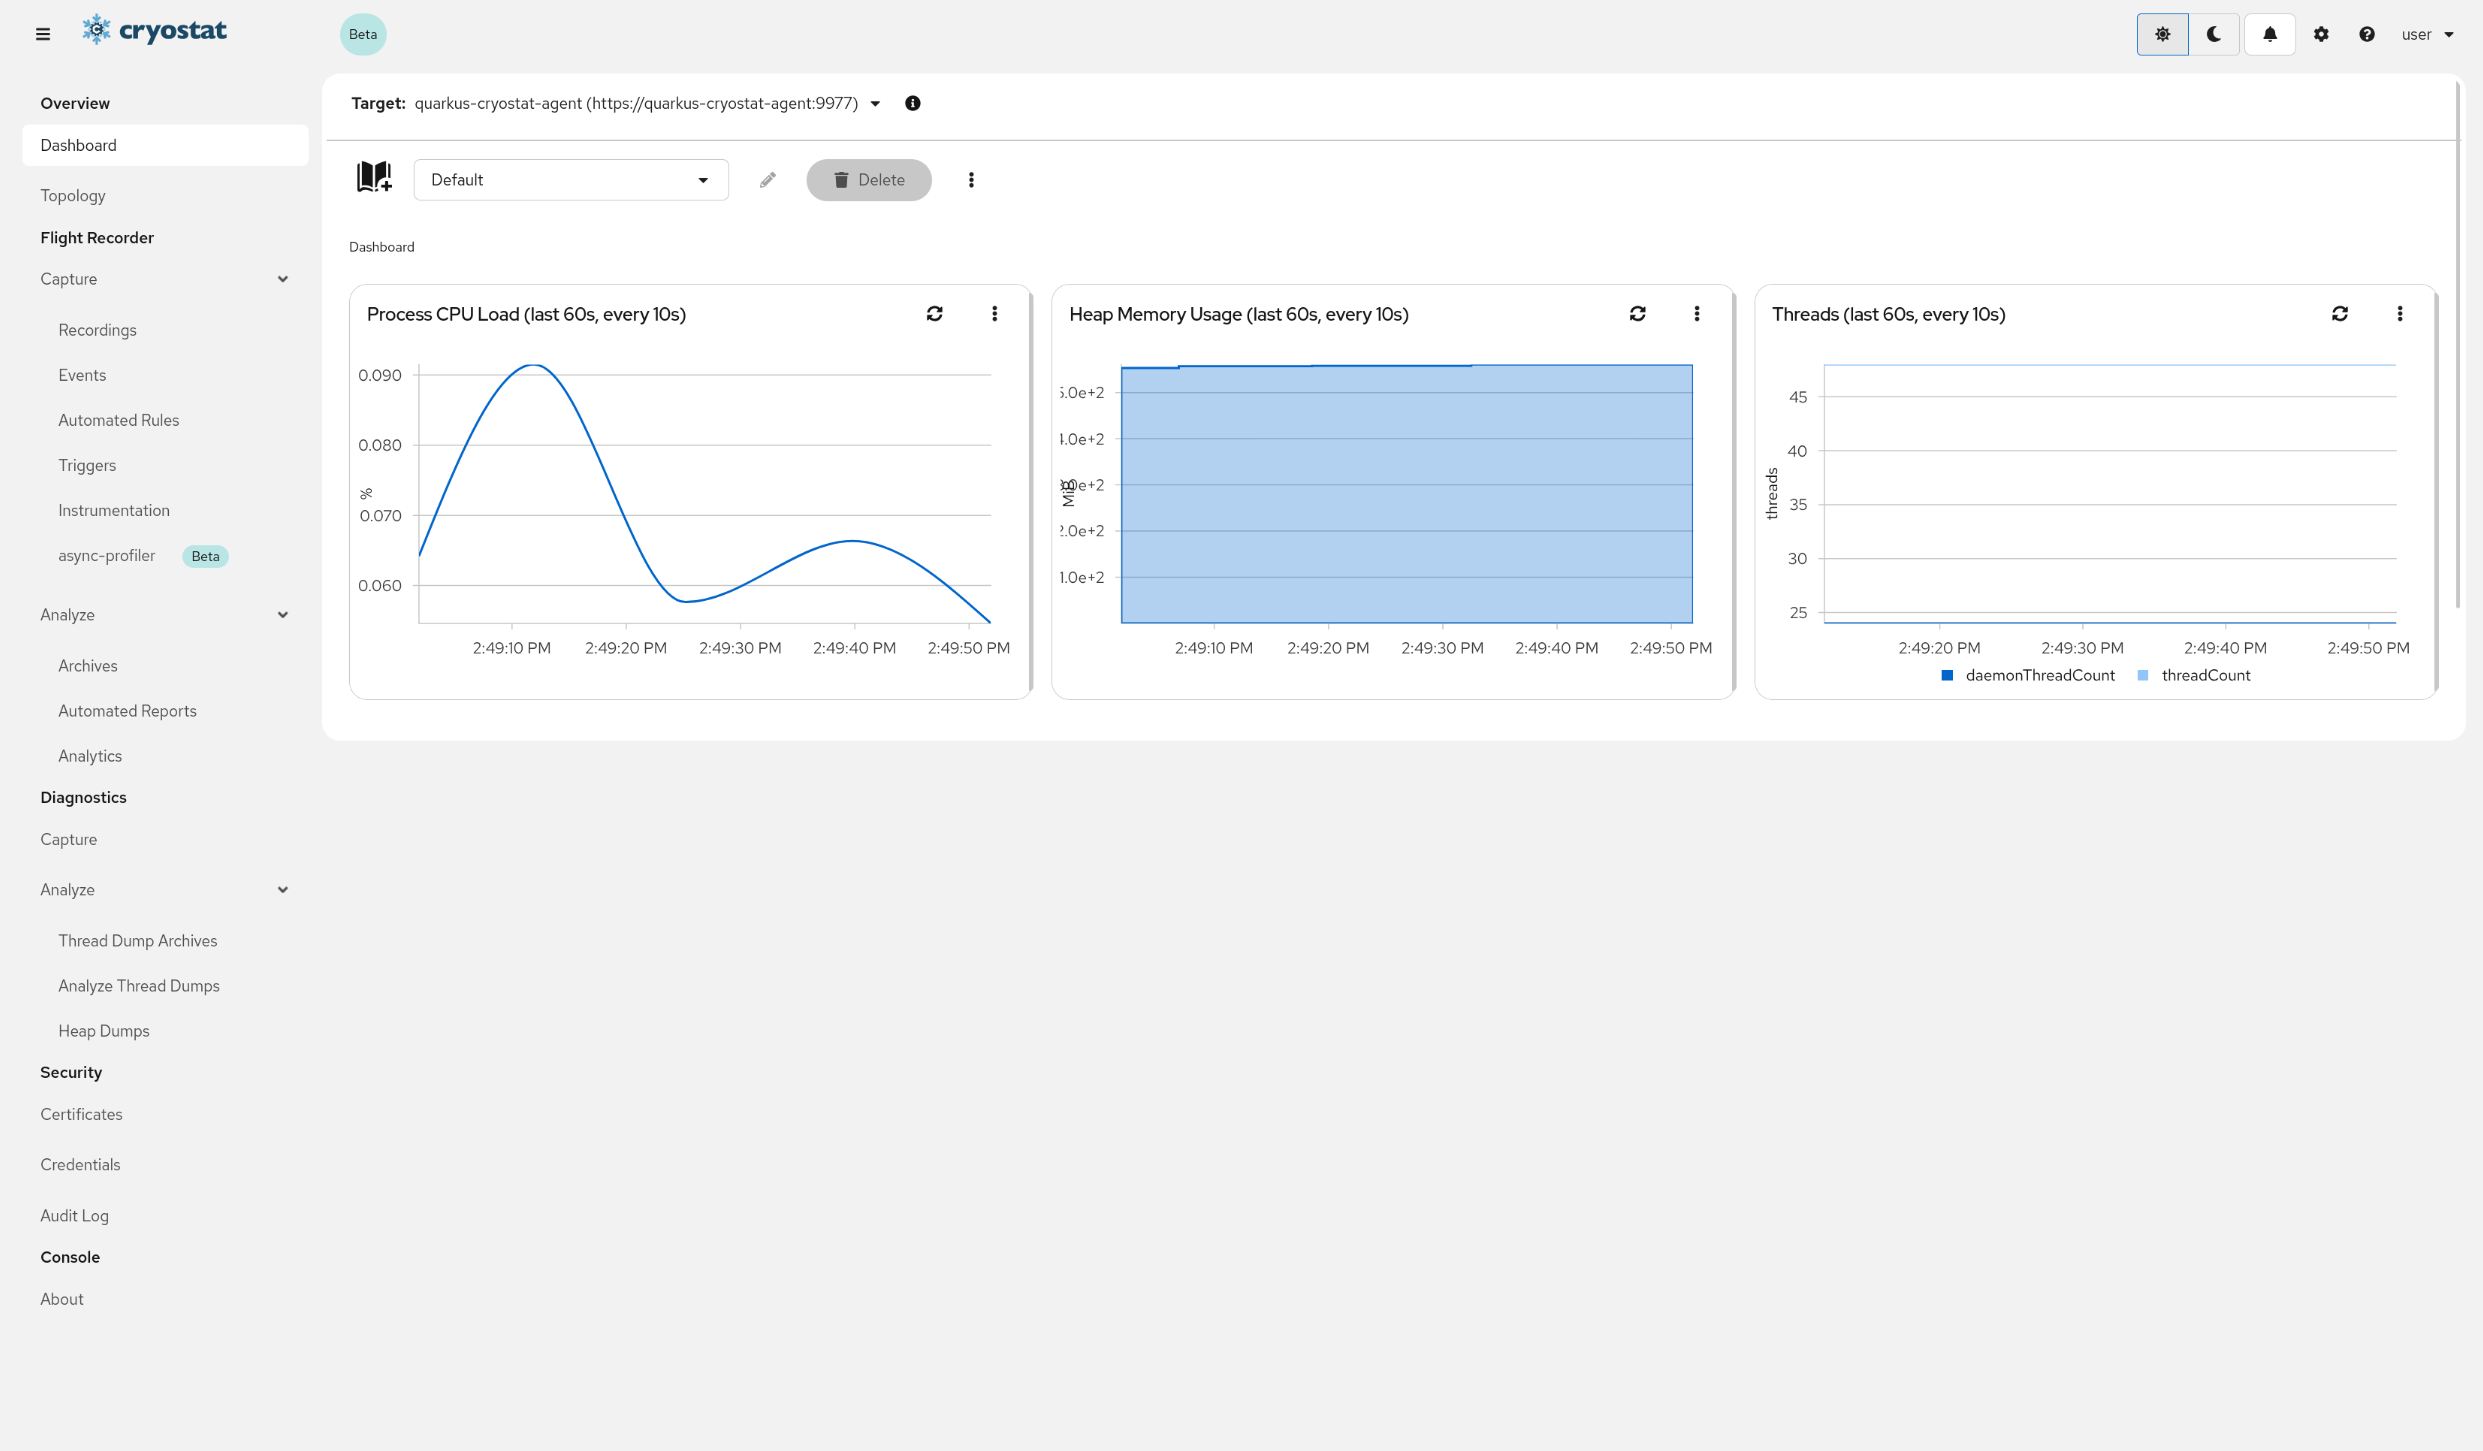
The Dashboard is the first view you will see when you log into Cryostat. It provides a high-level overview of the state of your Cryostat instance and the targetJVM applications it is monitoring.
Navigate to Overview/DashboardAdd dashboard cards, switch between dashboard layouts, and modify the layout configuration to suit your needs.
The CryostatDashboard provides a high-level overview of the state of your Cryostat instance and the target JVM applications it is monitoring.
Dashboard cards are widgets that display information about your Cryostat instance and the targetJVM applications it is monitoring, or allow you to perform diagnostic actions against the targets. Let’s walk through the available cards and how to add them to your Dashboard.
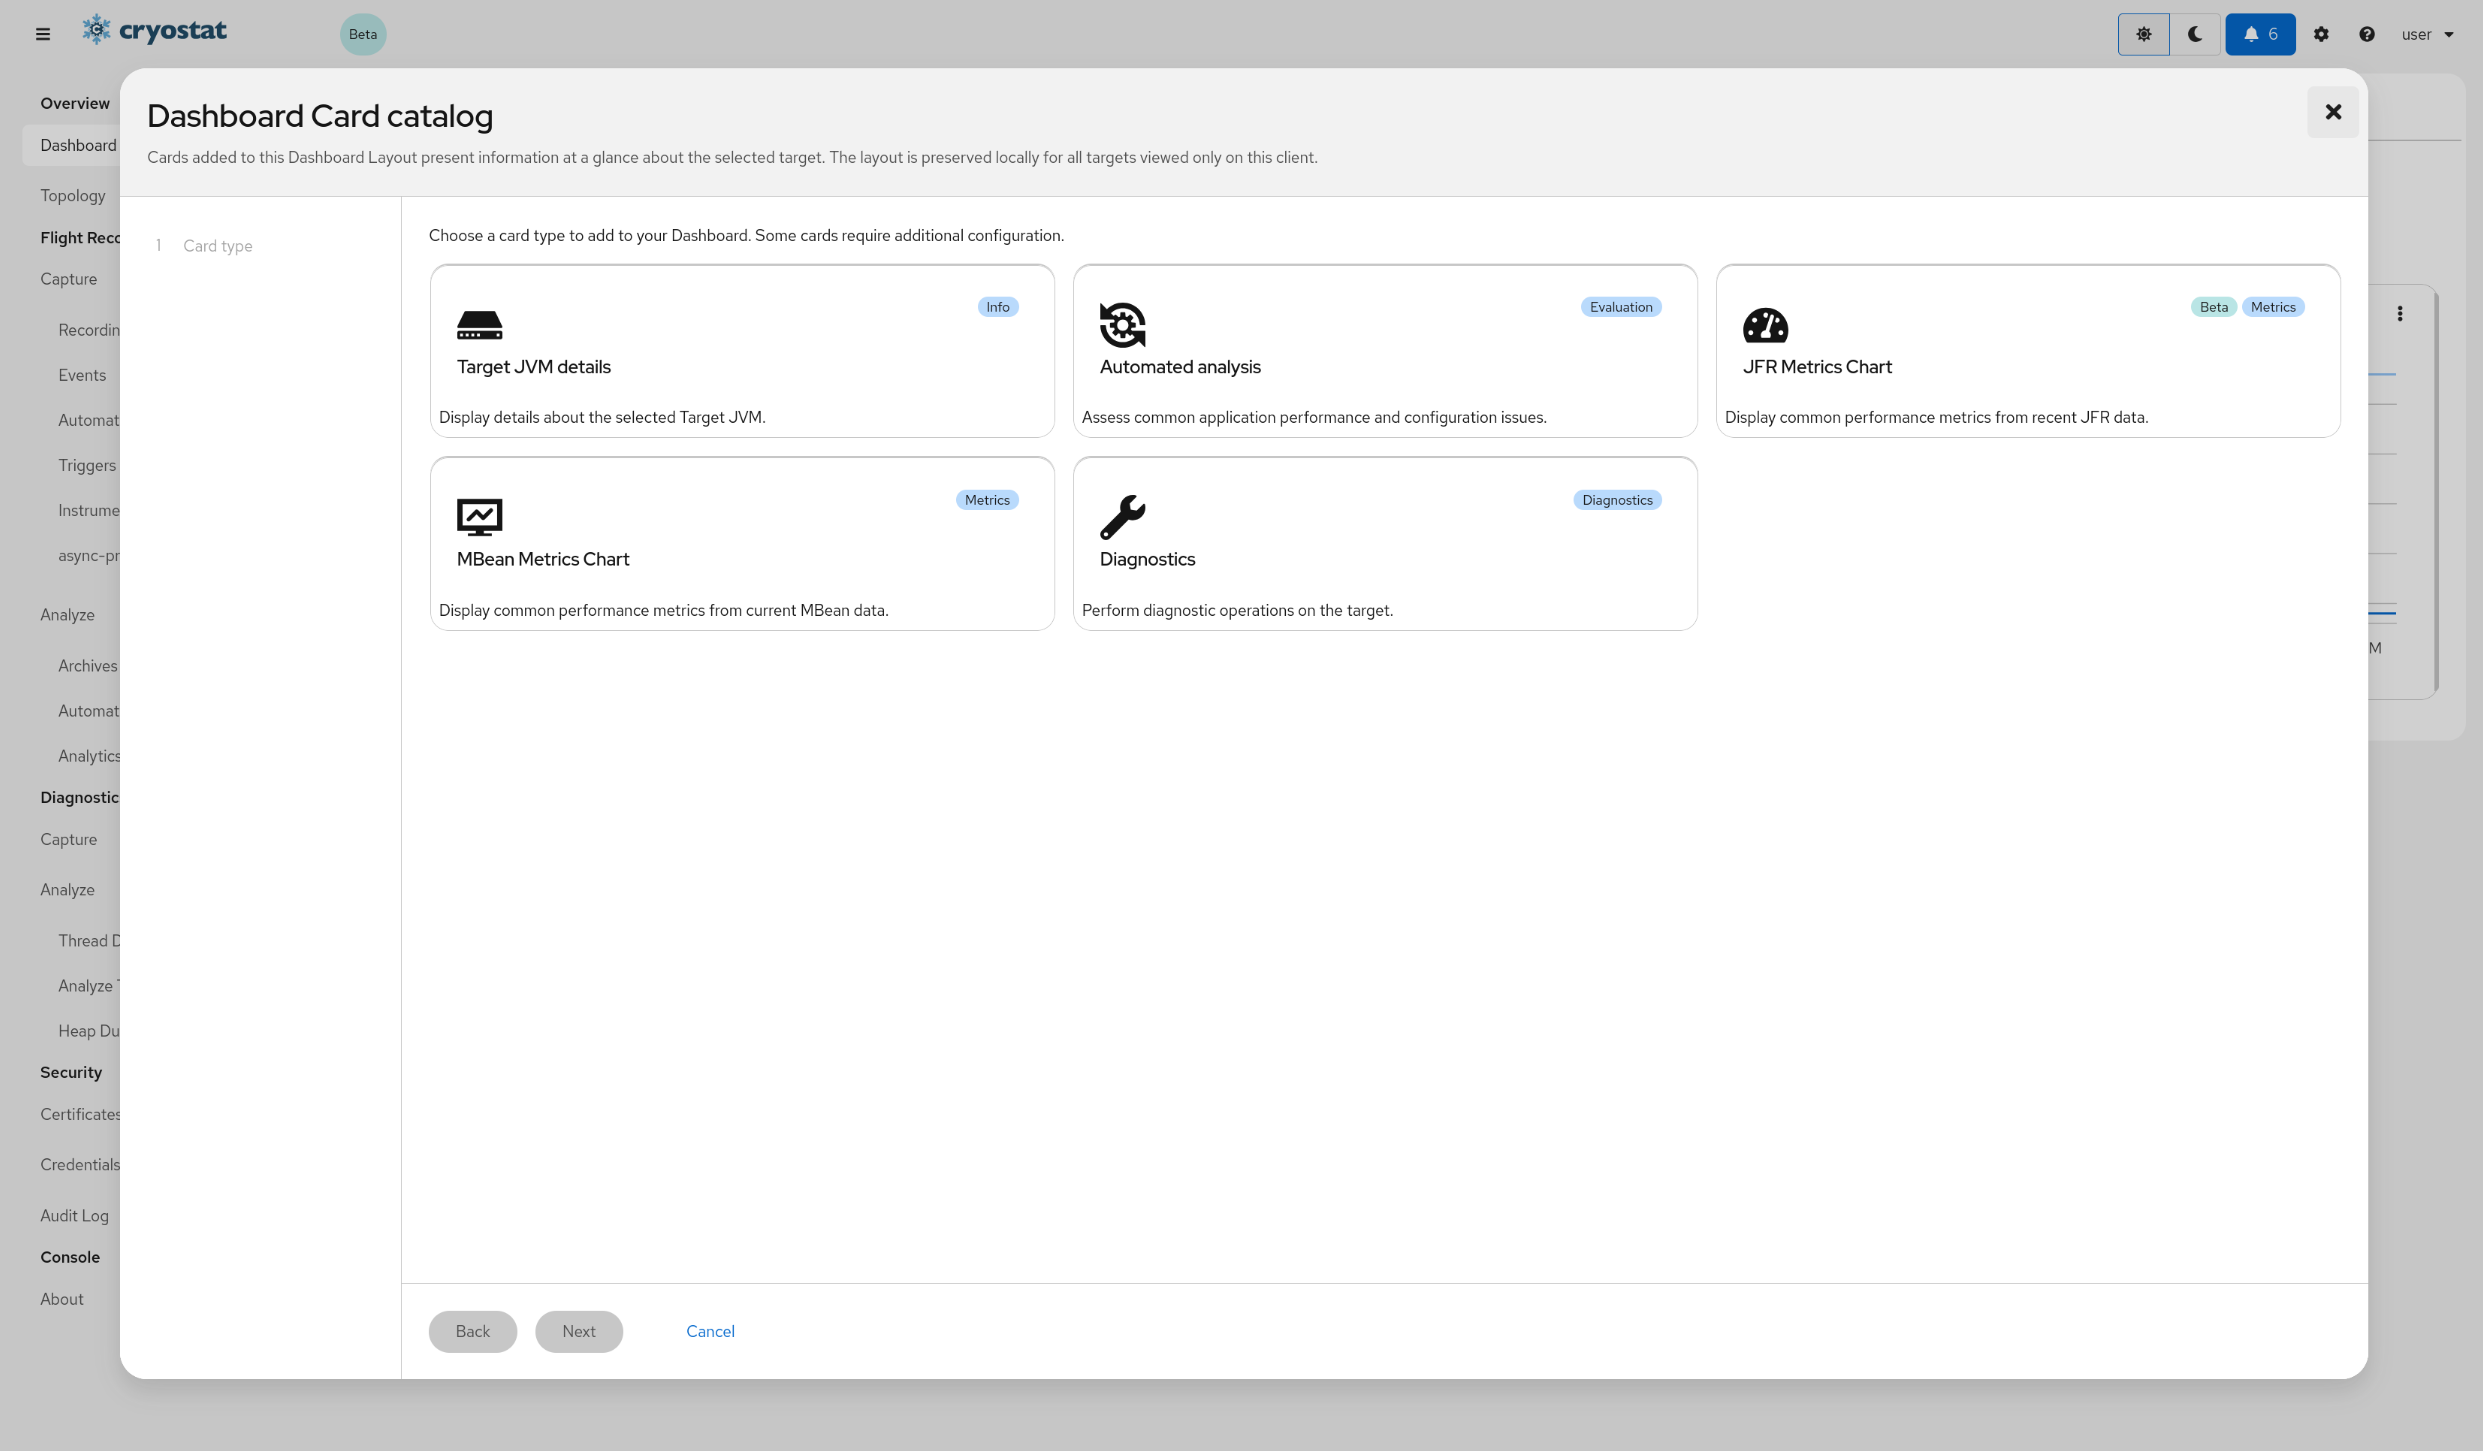
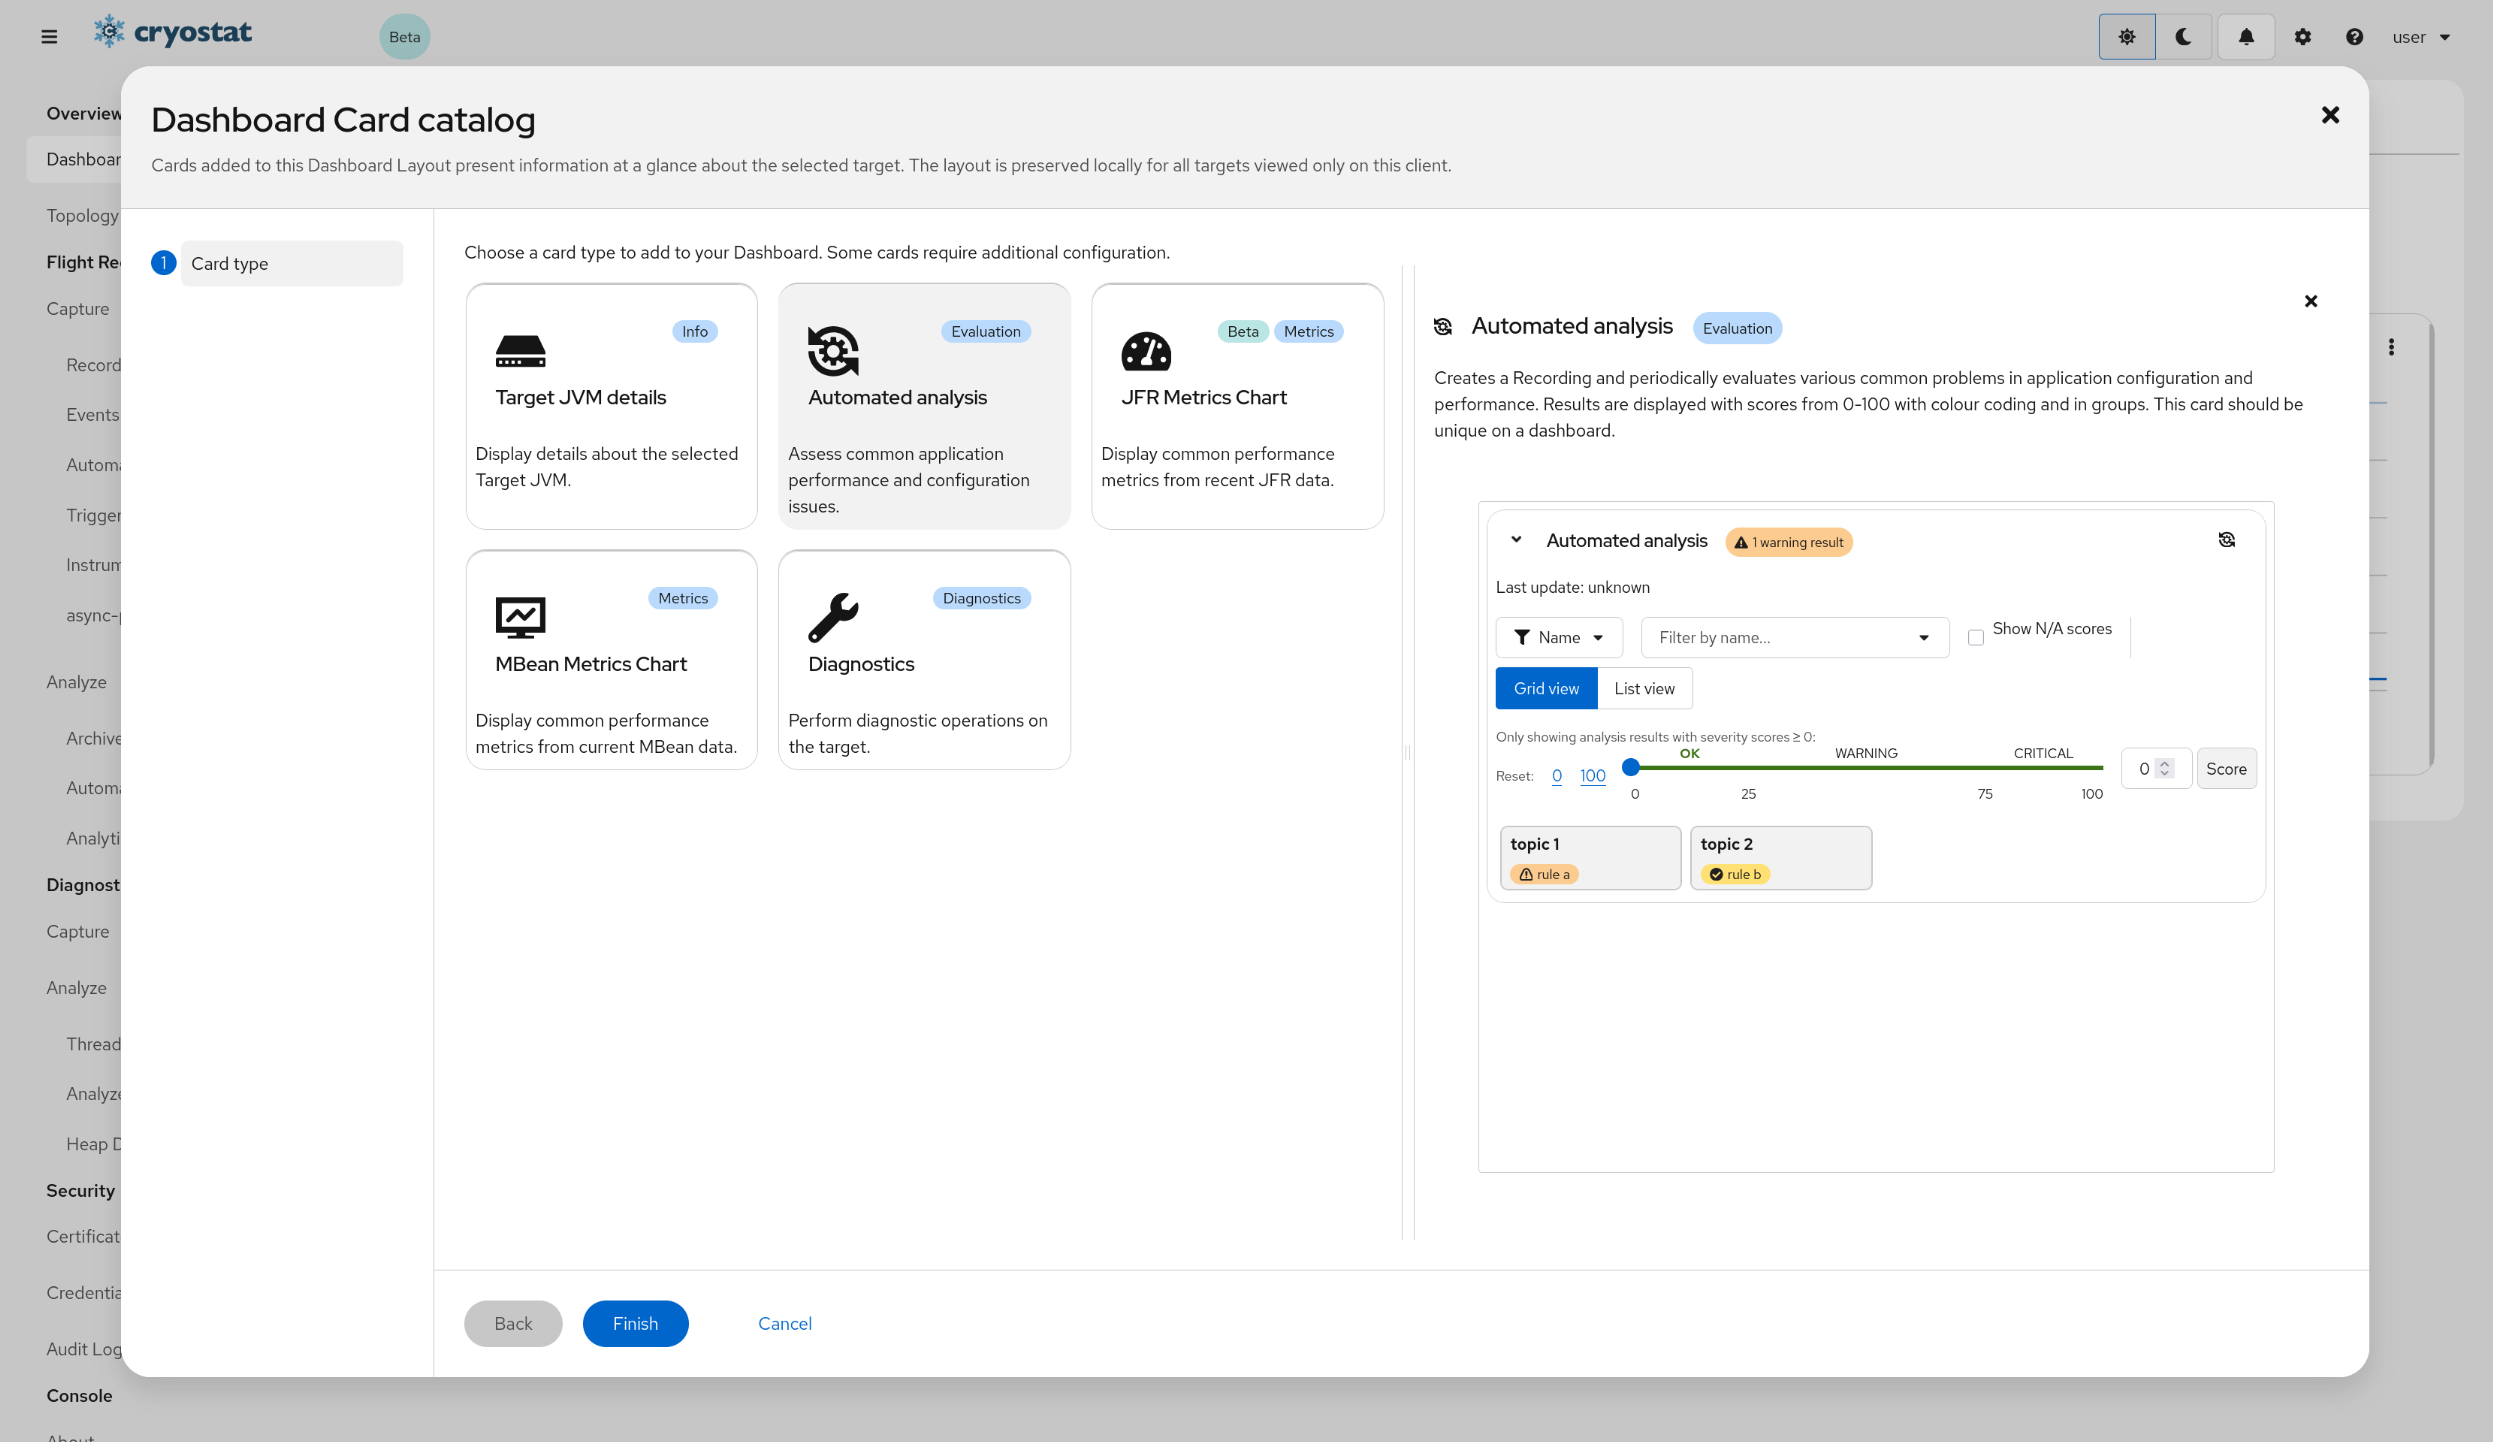
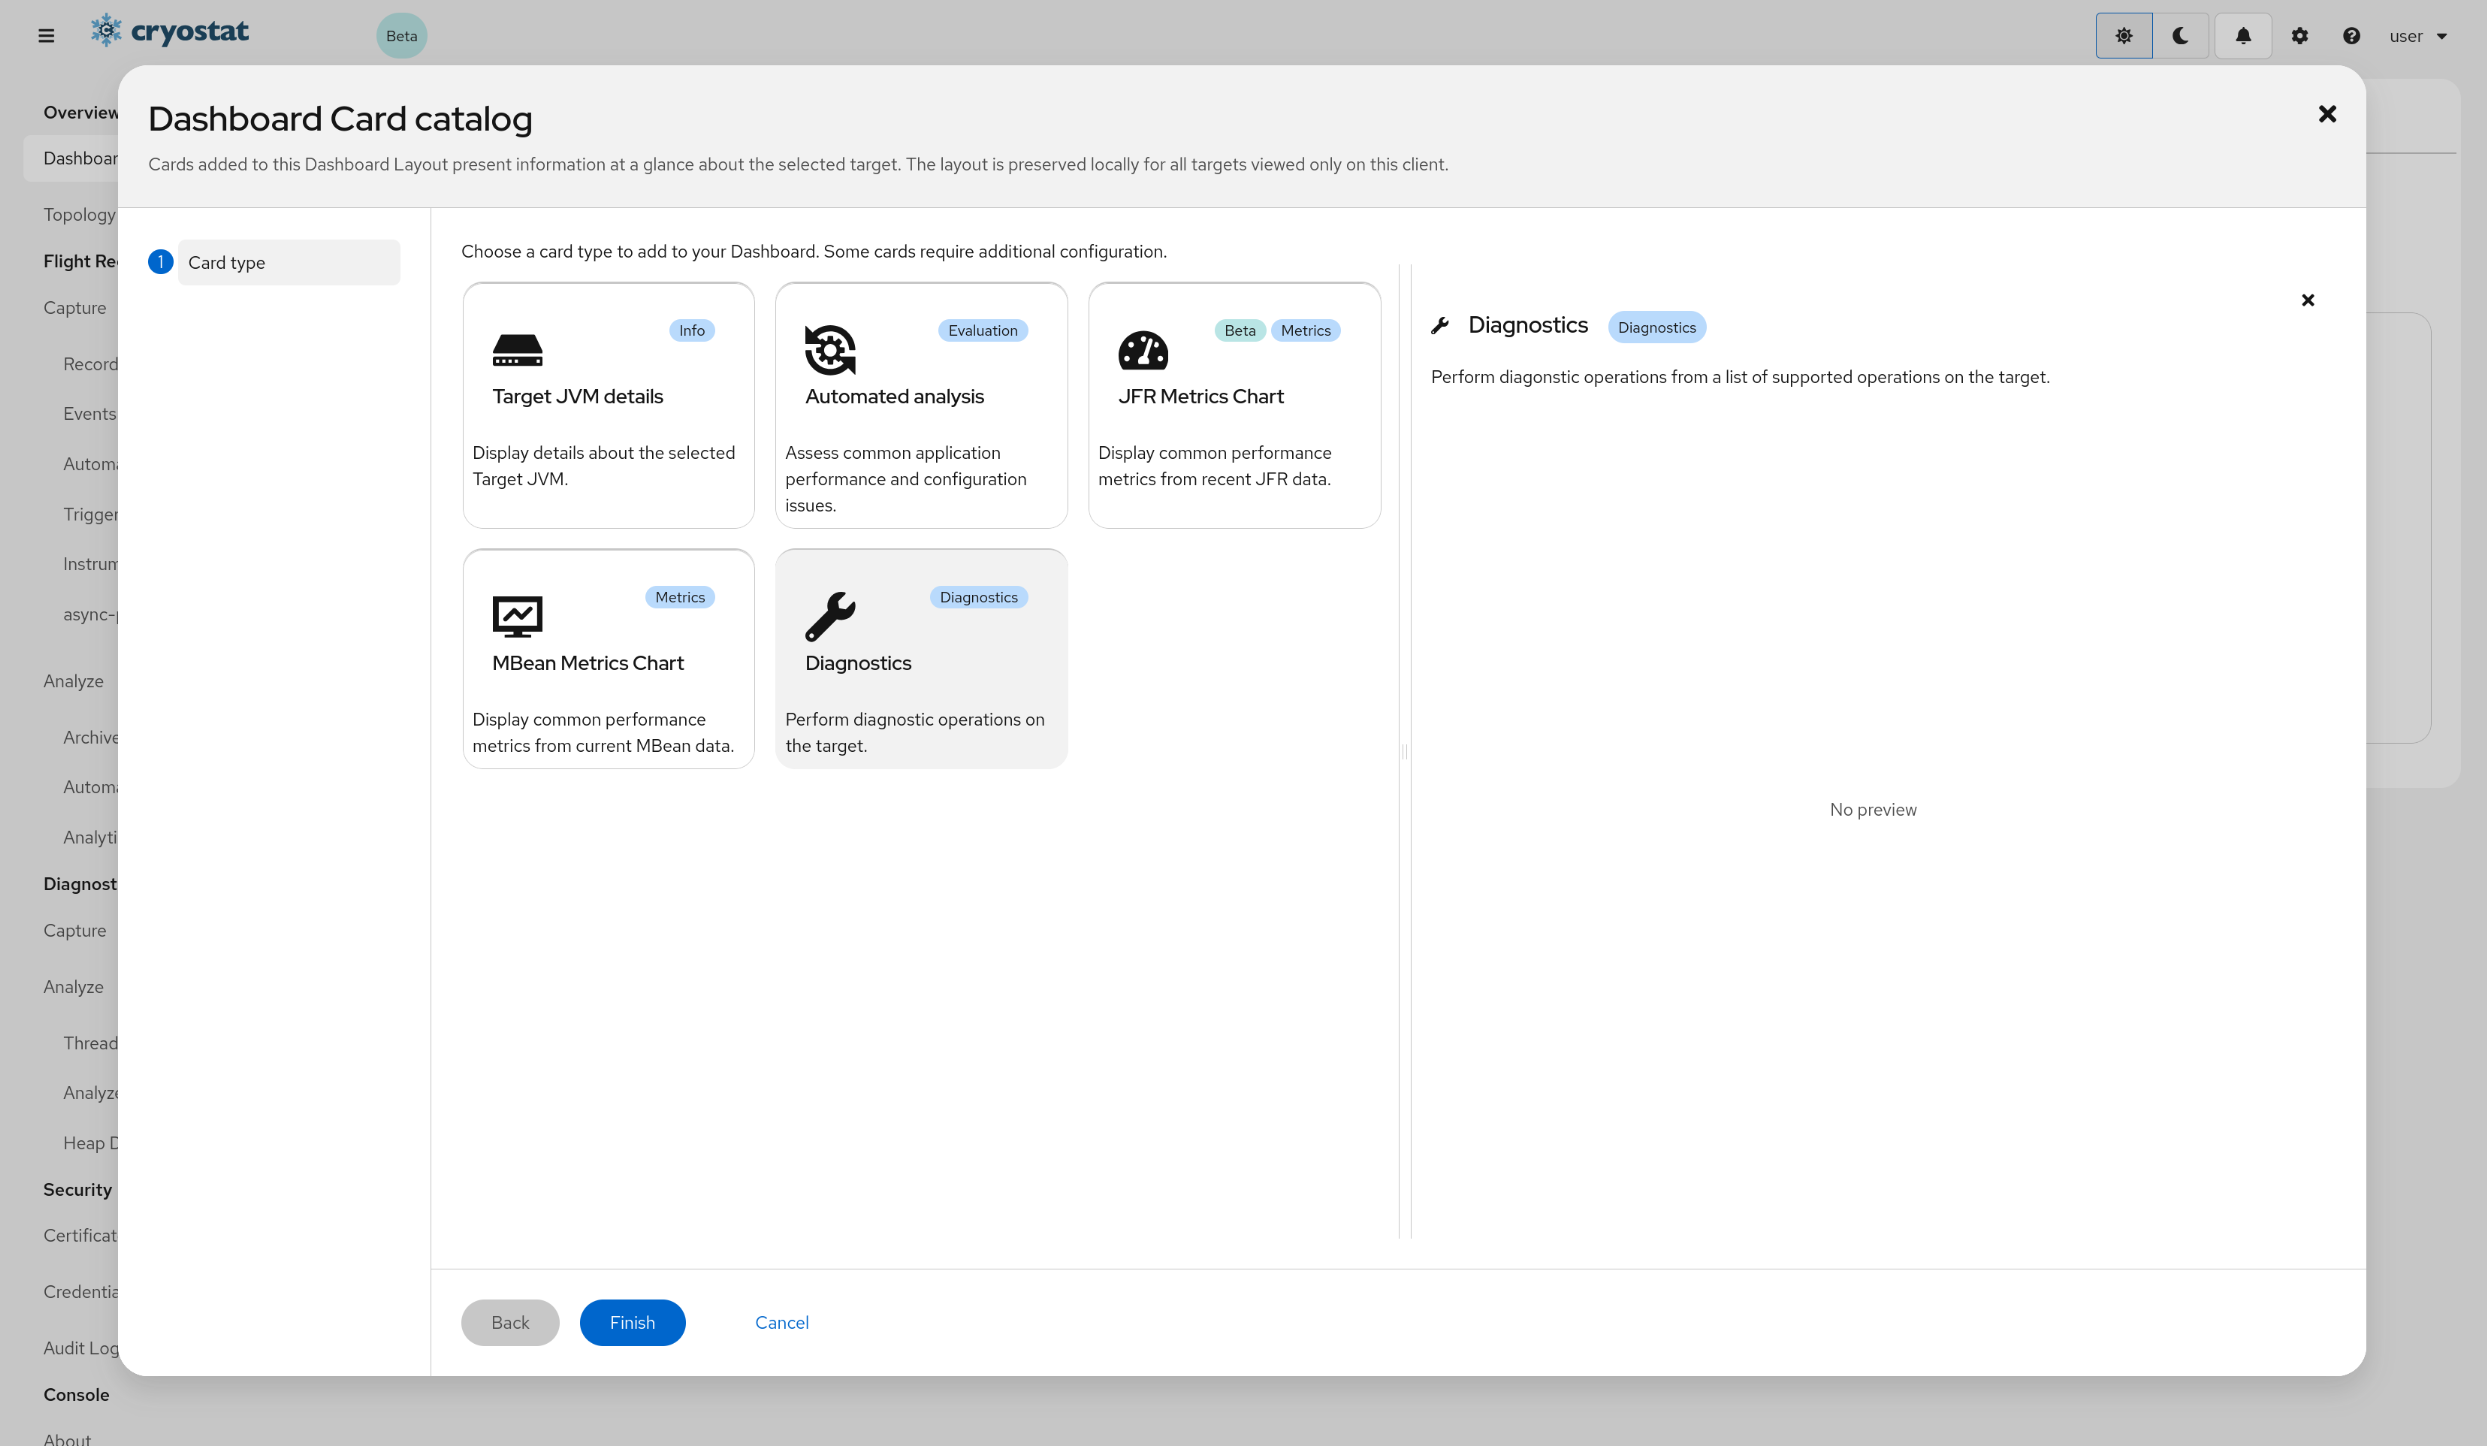
Open the Card CatalogOpen the Card Catalog by clicking the Catalog icon on the Dashboard toolbar.
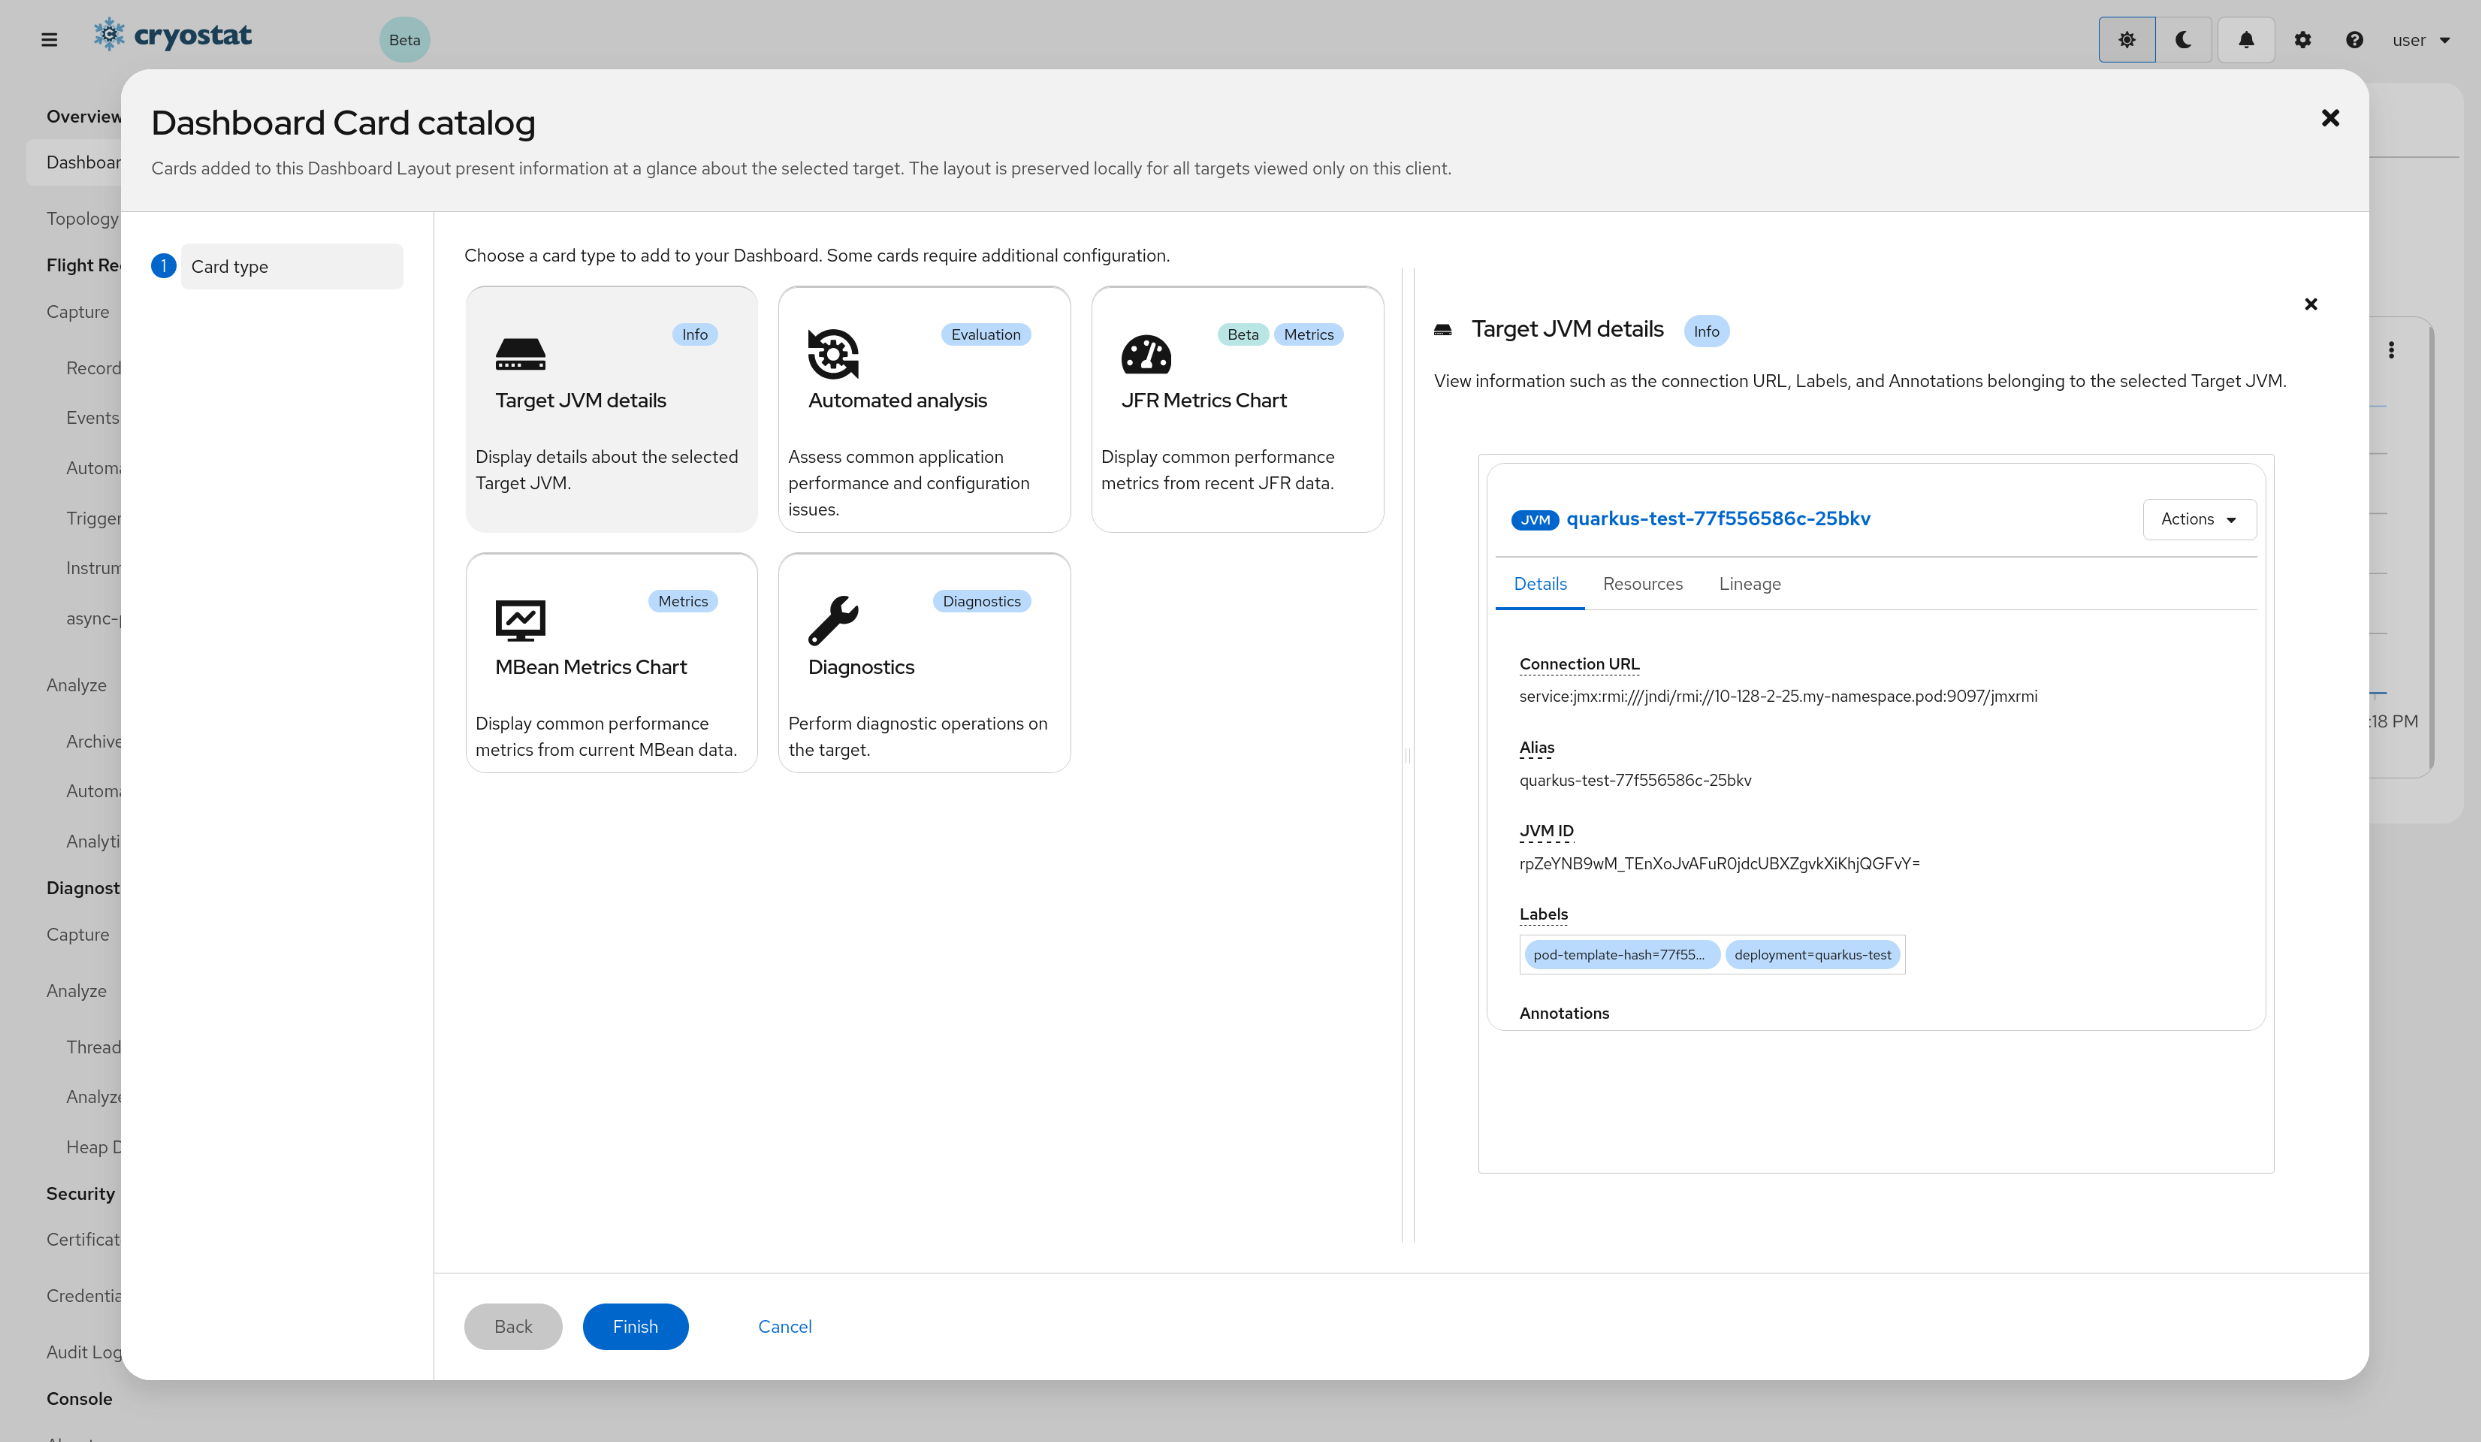
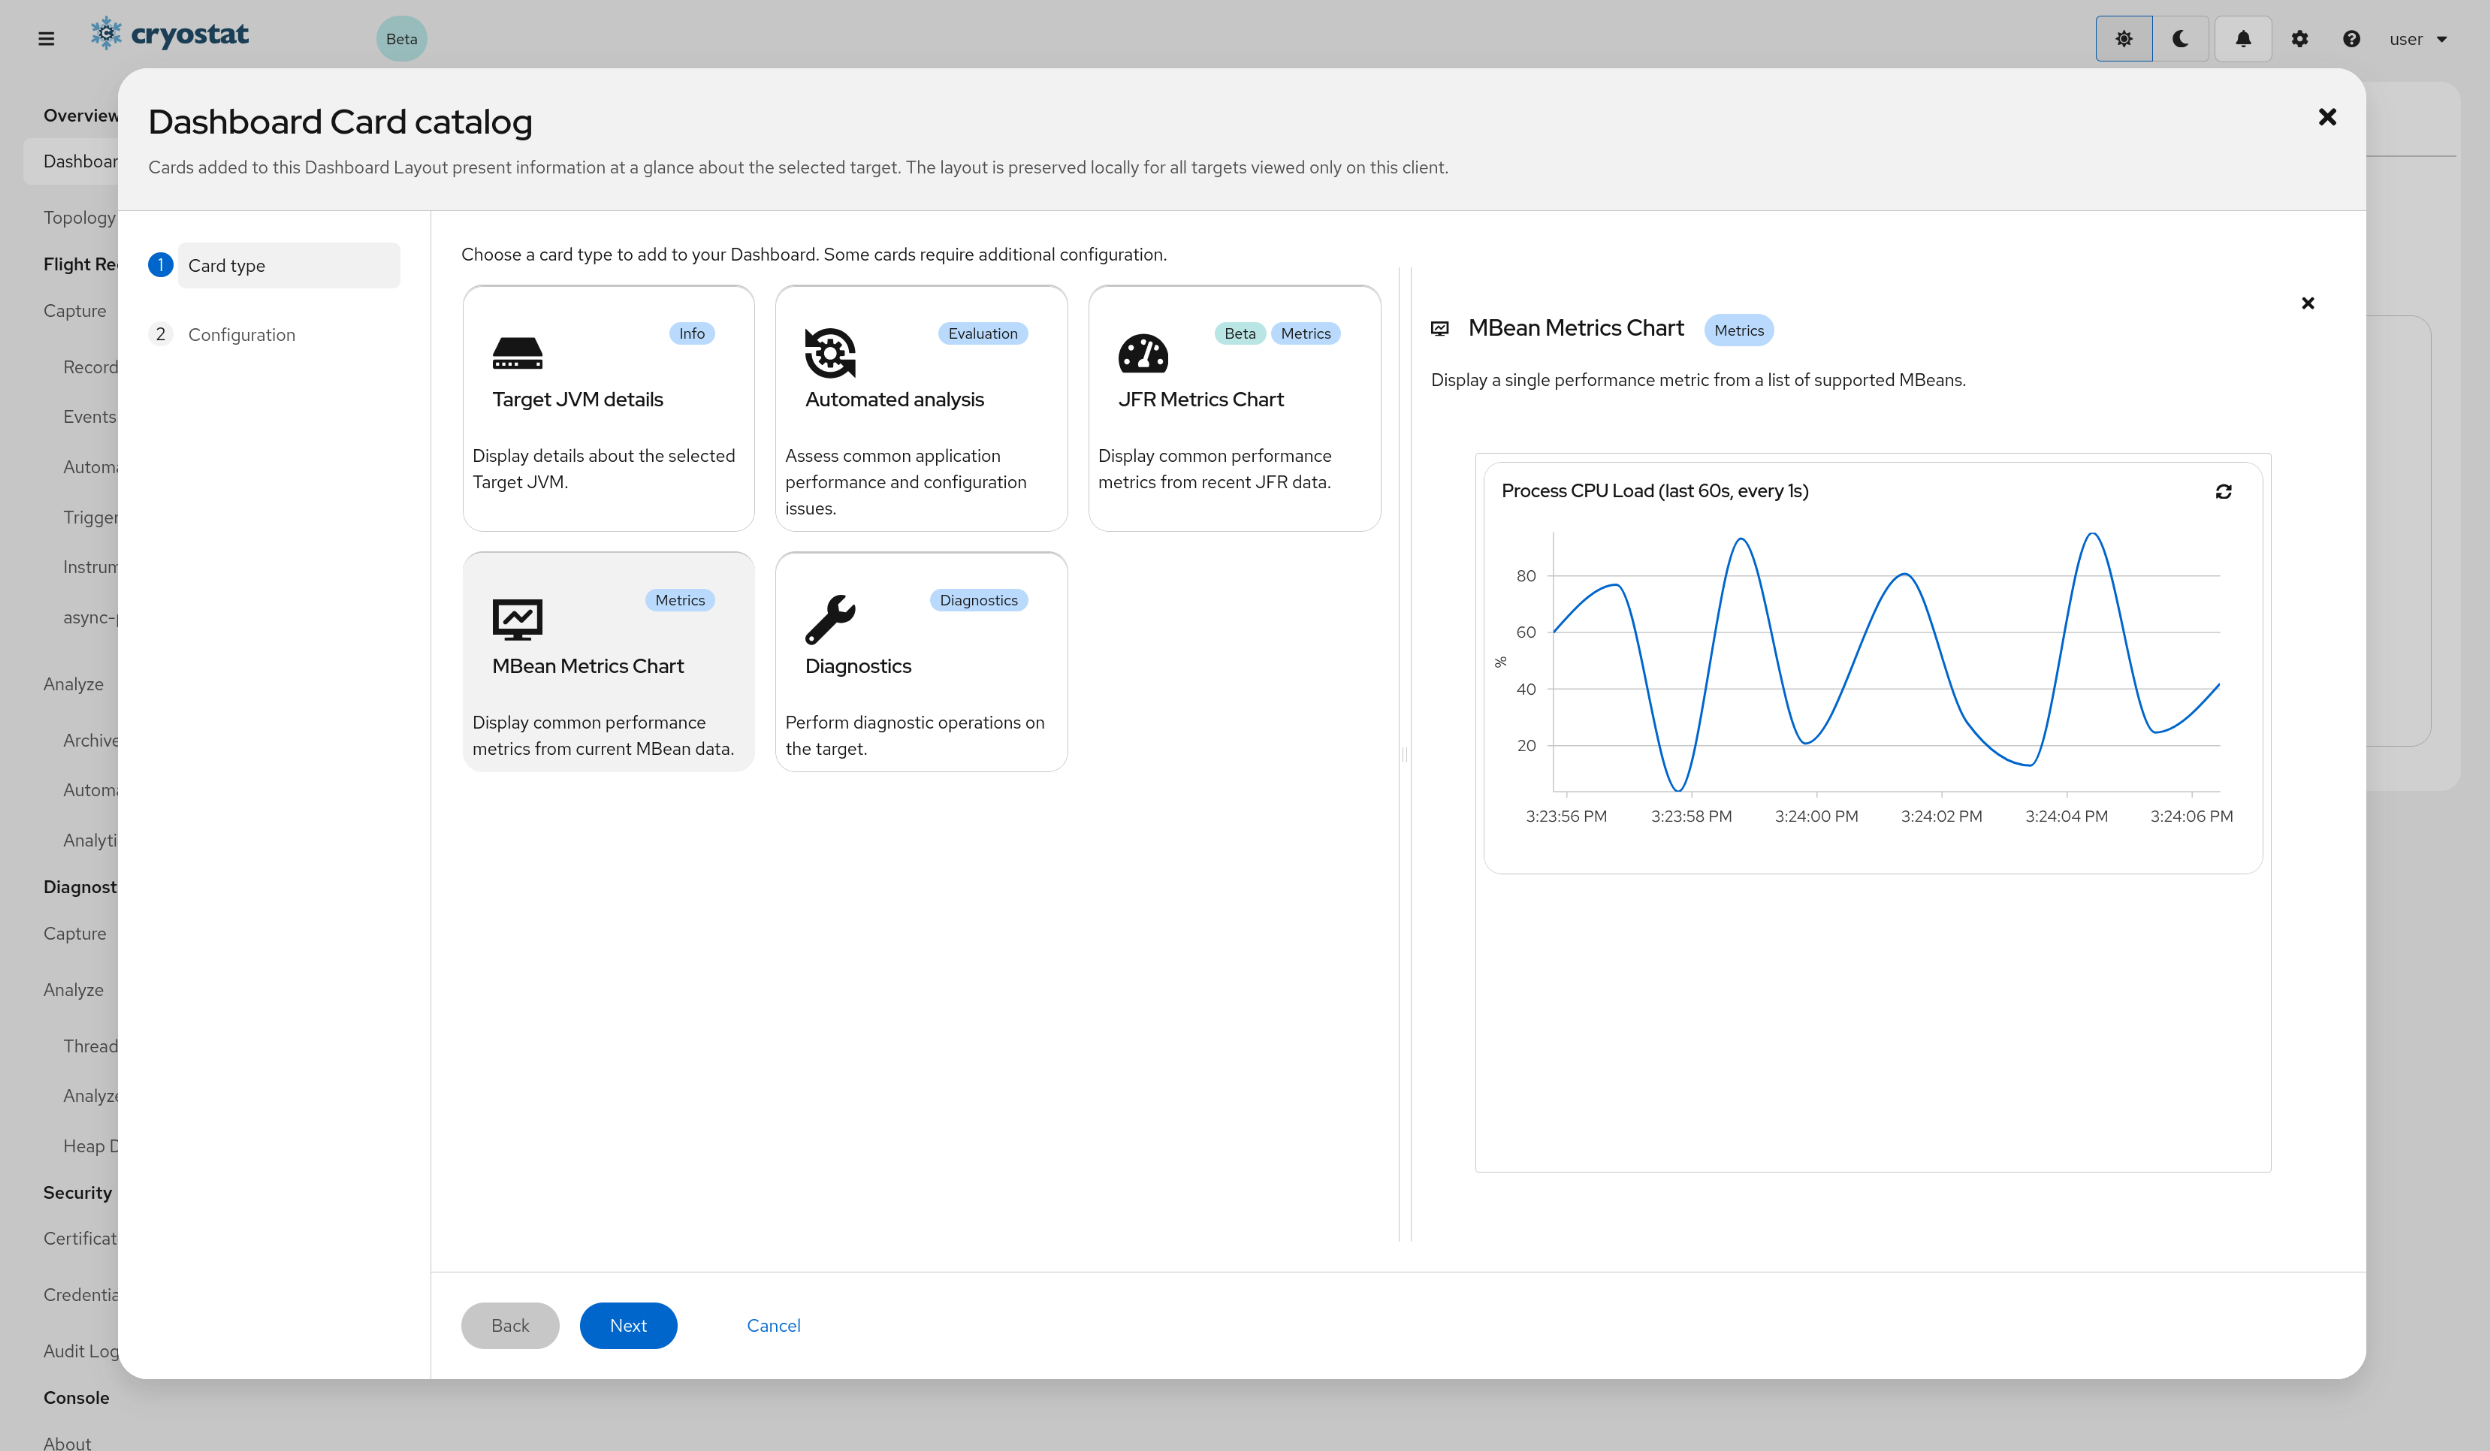
The Dashboard Card Catalog contains a list of available cards that can be added to the Dashboard. Clicking on a card will open a panel containing a preview.
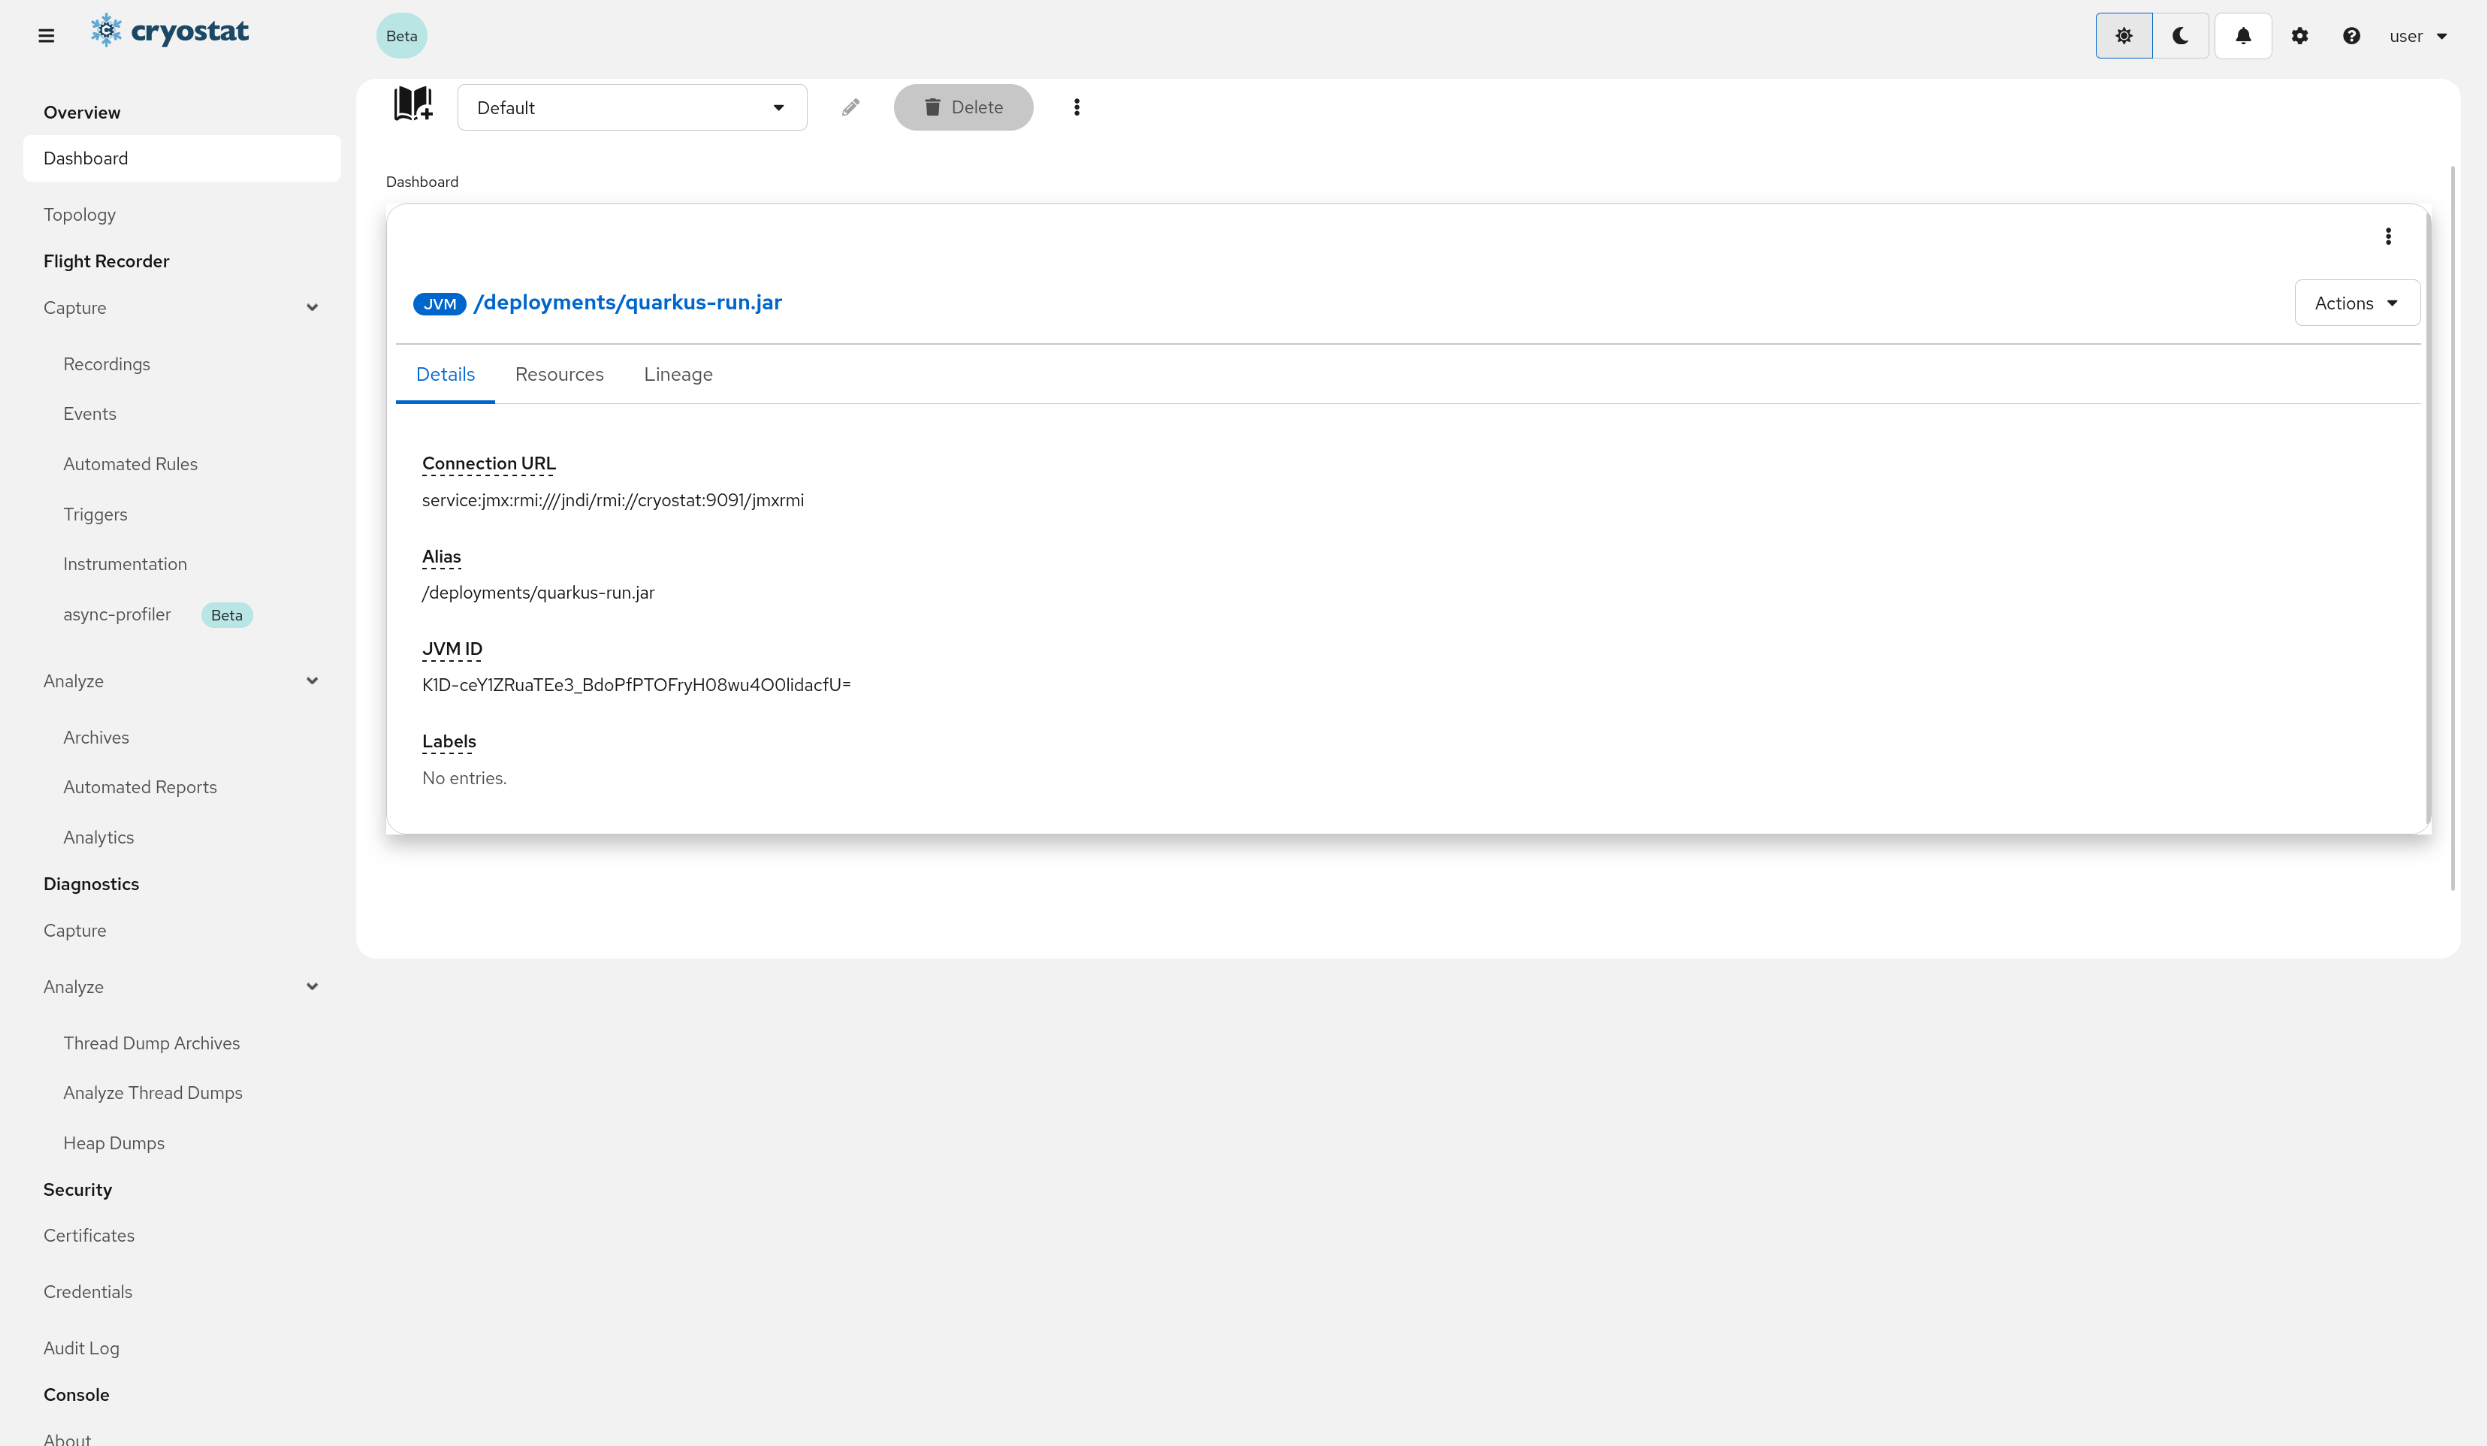
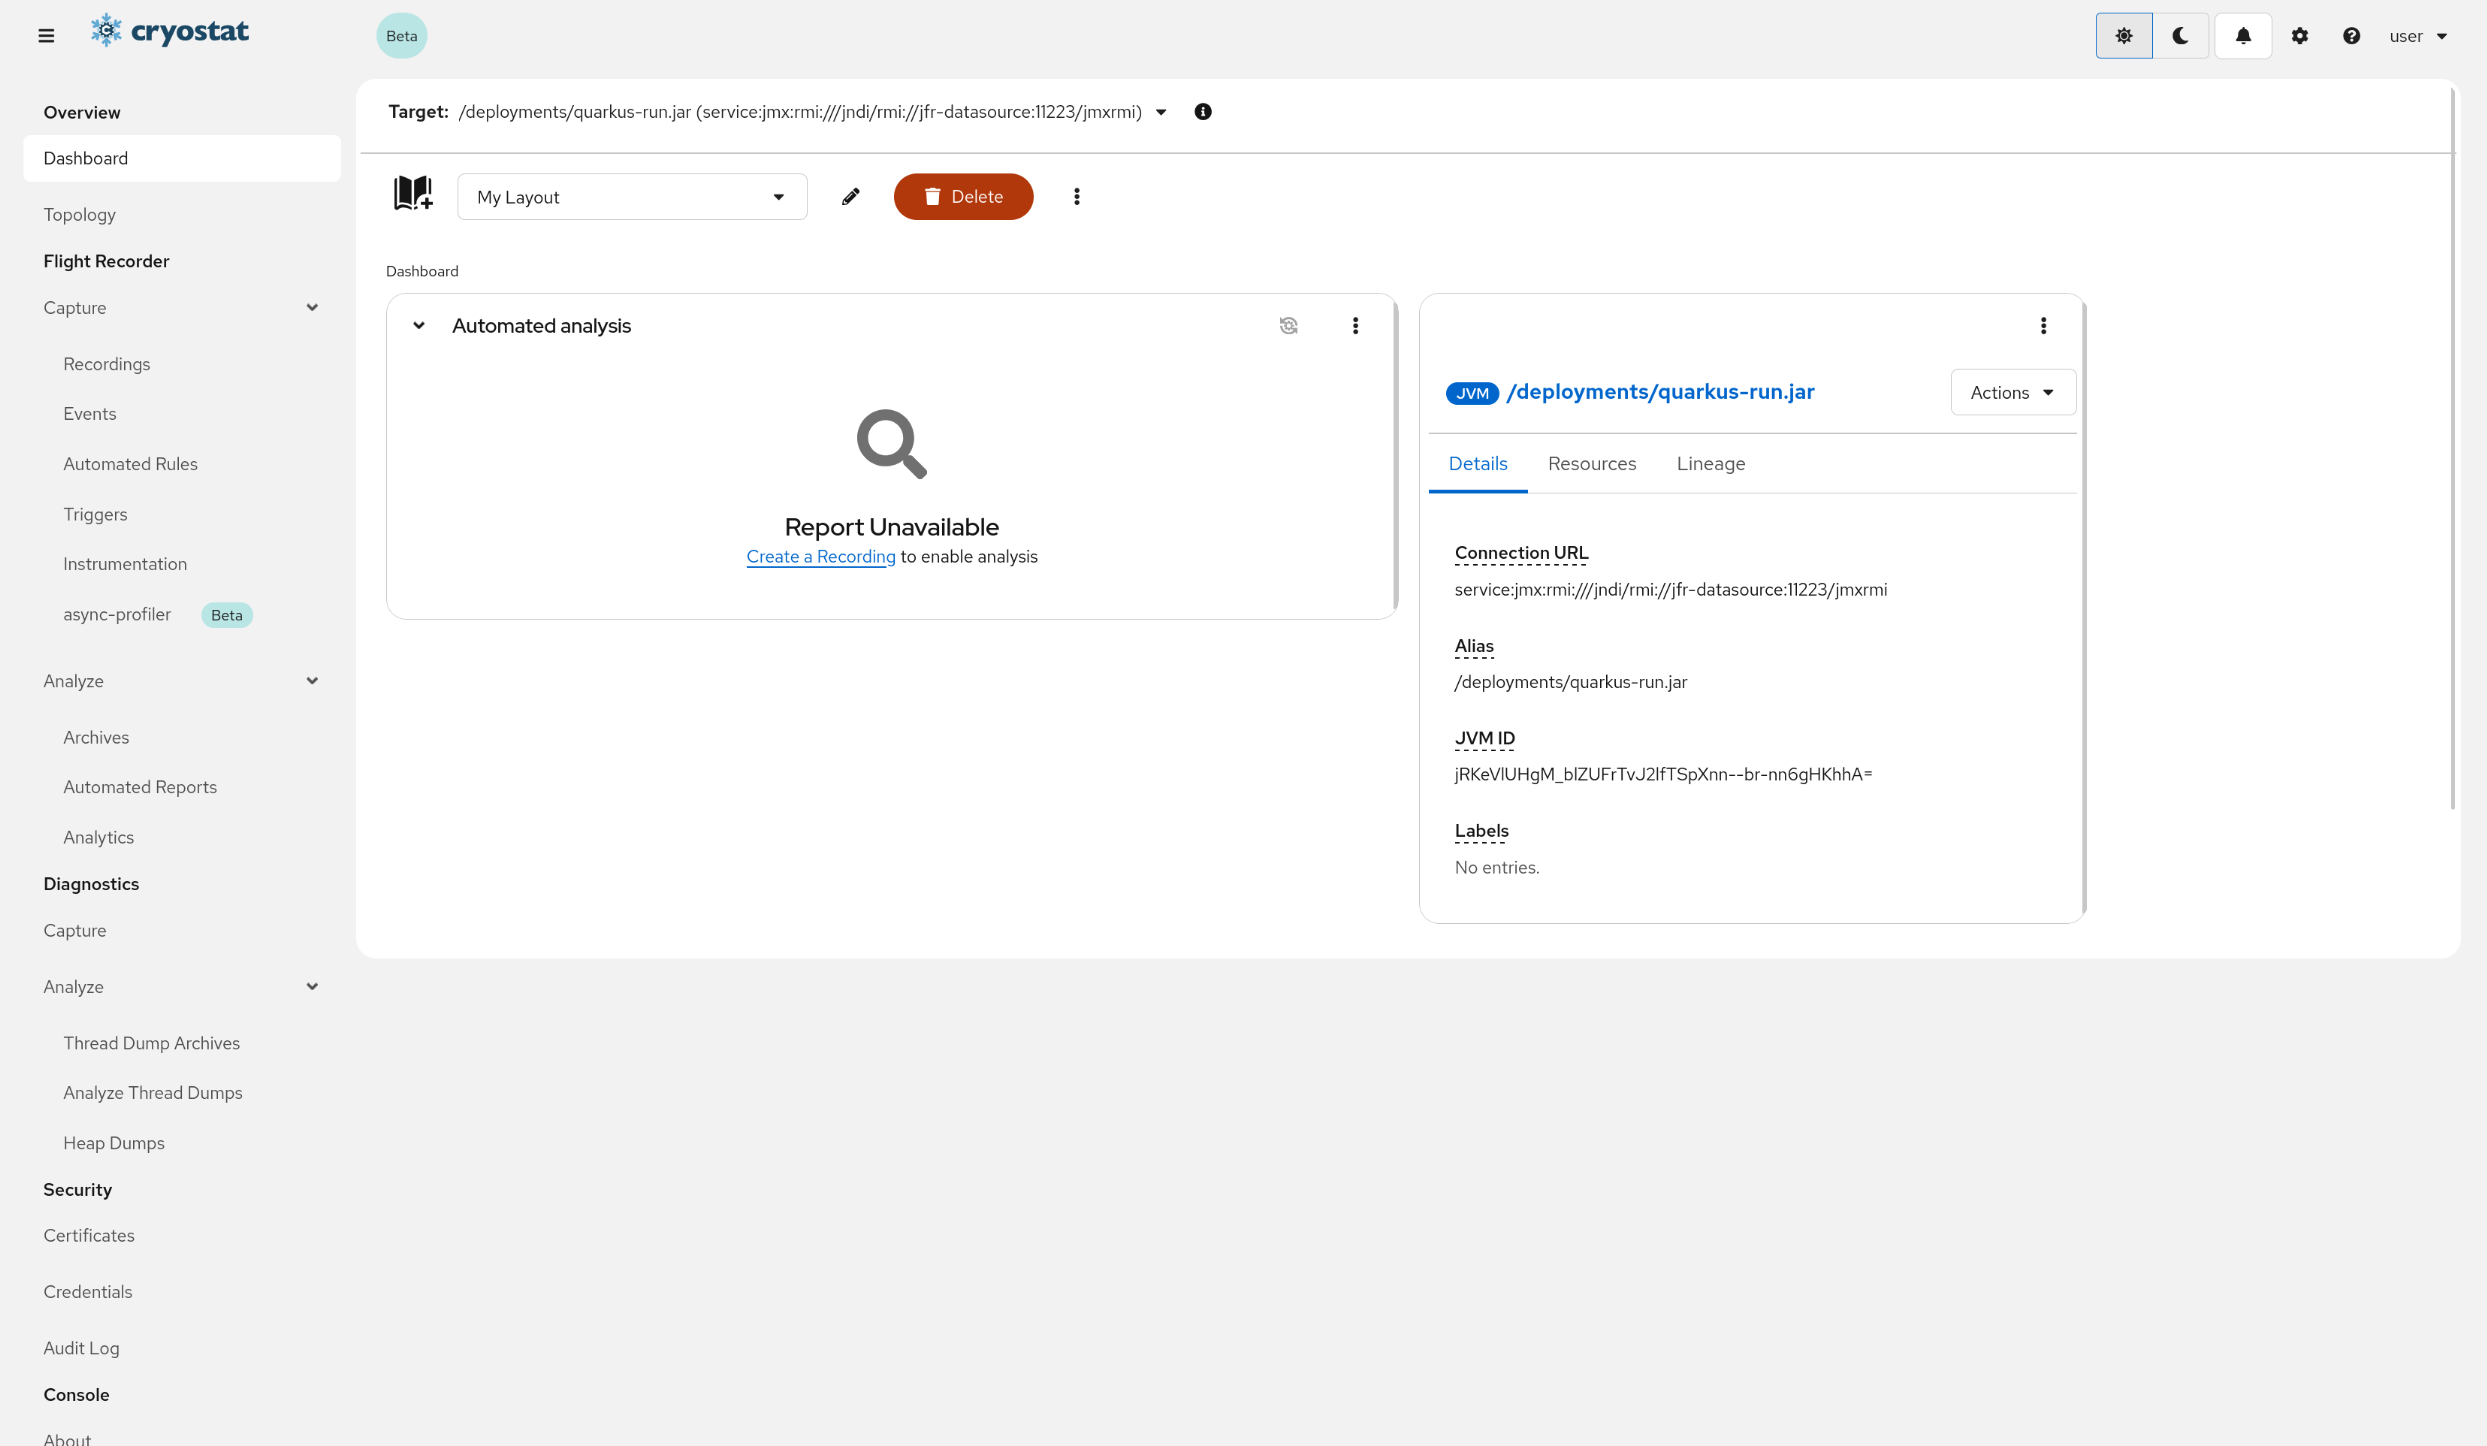
Add the Target JVM DetailsCard
Click on the Target JVM Detailscard for a preview.
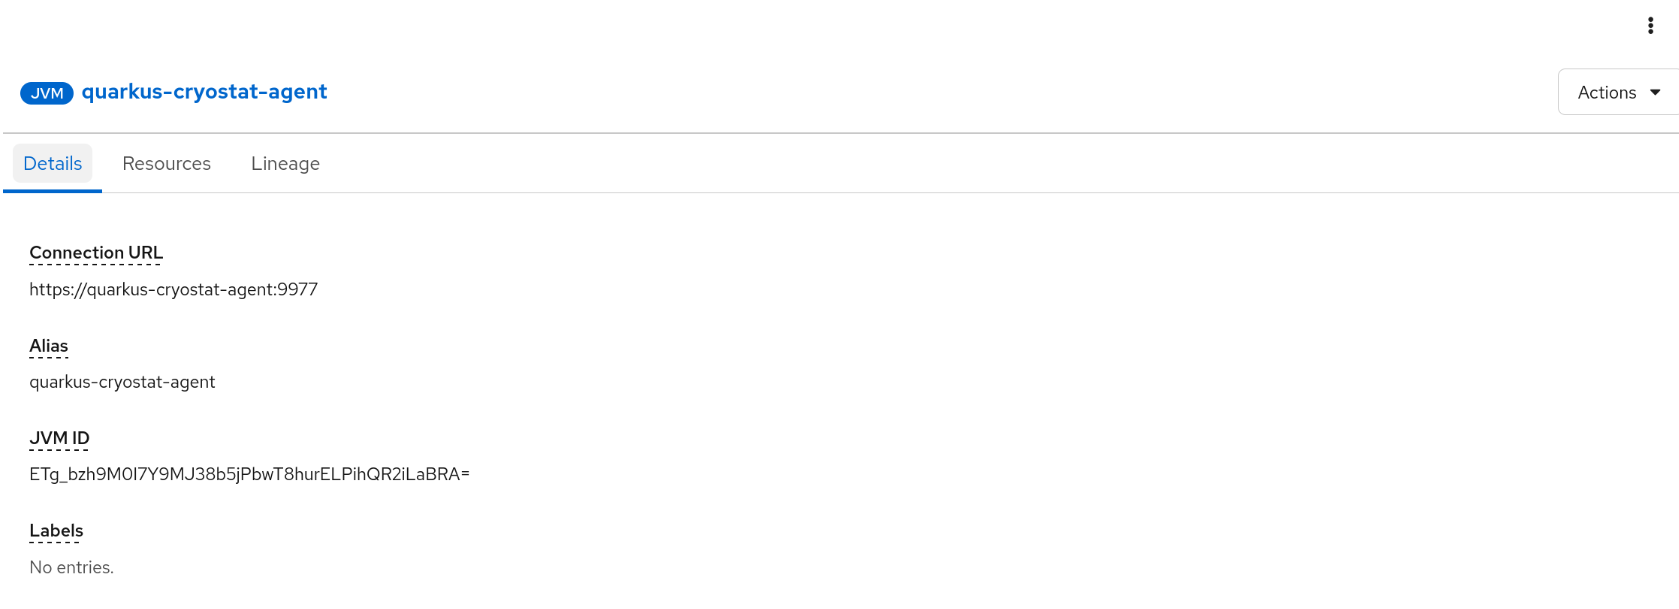
The Target JVM Detailscard displays information about the targetJVM application that is currently selected. There are three tabs that display different information:
Details Tab - Displays information about the targetJVM application, including:
Connection URL - The JMX connection URL of the targetJVM application.
Alias - The alias of the targetJVM application.
JVM ID - The JVM ID of the targetJVM application.
Labels - The labels of the targetJVM application.
Annotations - The annotations of the targetJVM application.
and more...
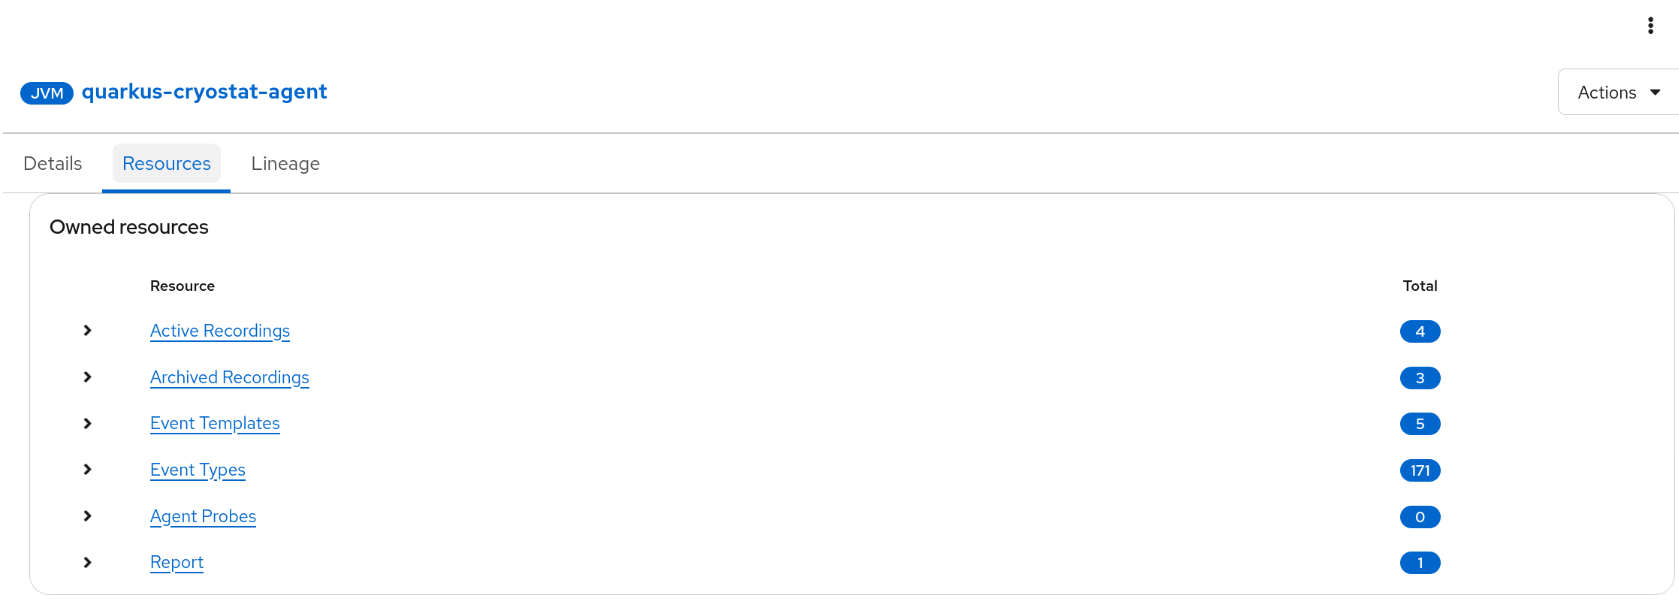
Resources Tab - Displays the resources associated with the targetJVM application. There are two tables:
Related Resources: Resources that are tied to the JVM by Match Expression (i.e. Automated Rules and Credentials).
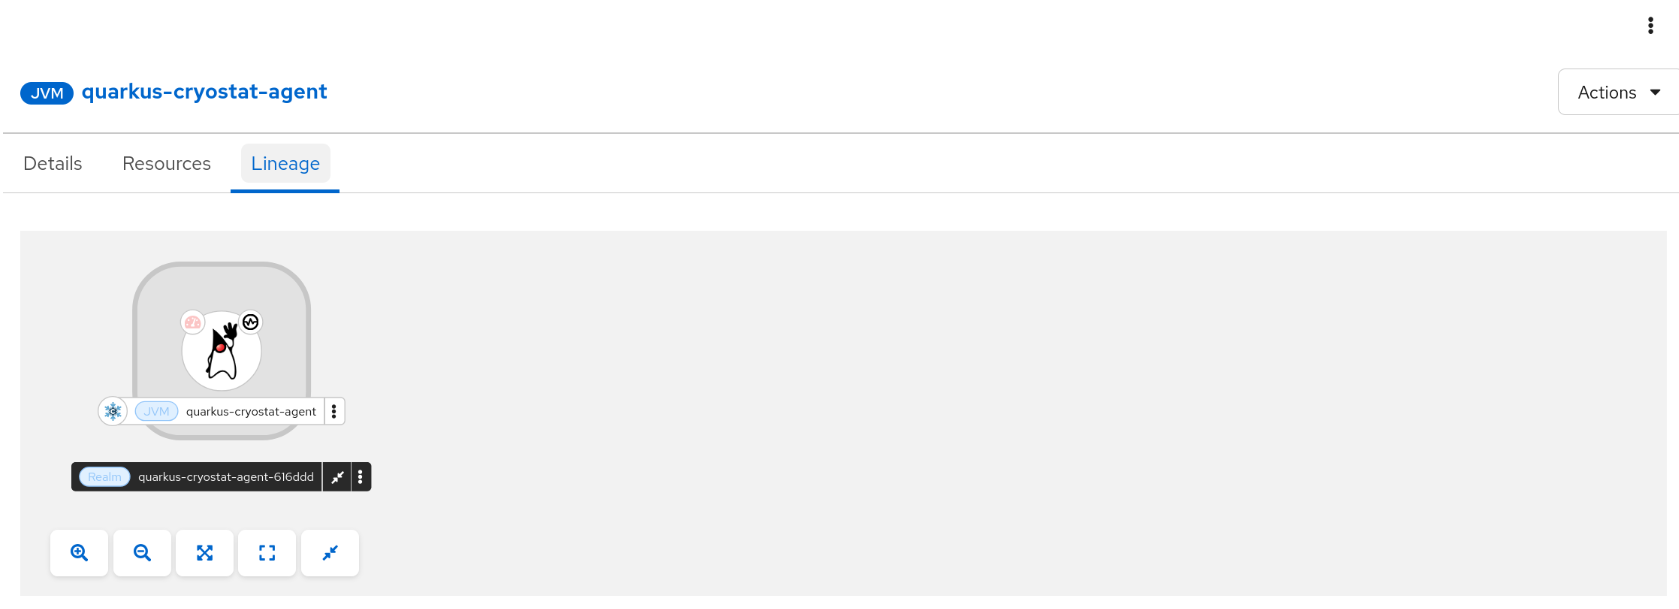
Lineage Tab - Displays an embedded Topology graph view isolating the targetJVM application, the Discovery Node it's attached to, that Node's parent Node, up to the Realm level.
Finish Card Creation
There are no extra steps in the creation wizard for this card. Click Finish to add the card to your dashboard.
Add the Automated AnalysisCard
Click on the Automated Analysiscard for a preview.
The Automated Analysiscard allows users to view JMCAutomated Analysis reports in a nicely formatted dashboard card. The card allows the user to create a special Recording, and then automatically generates an Automated Analysis report. The report displays potential problems with your JVM, and provides suggestions on how to improve the performance and security of your selected JVM application. The card also contains a toolbar that allows you to refresh the report, delete the report, filter results, and change the view.
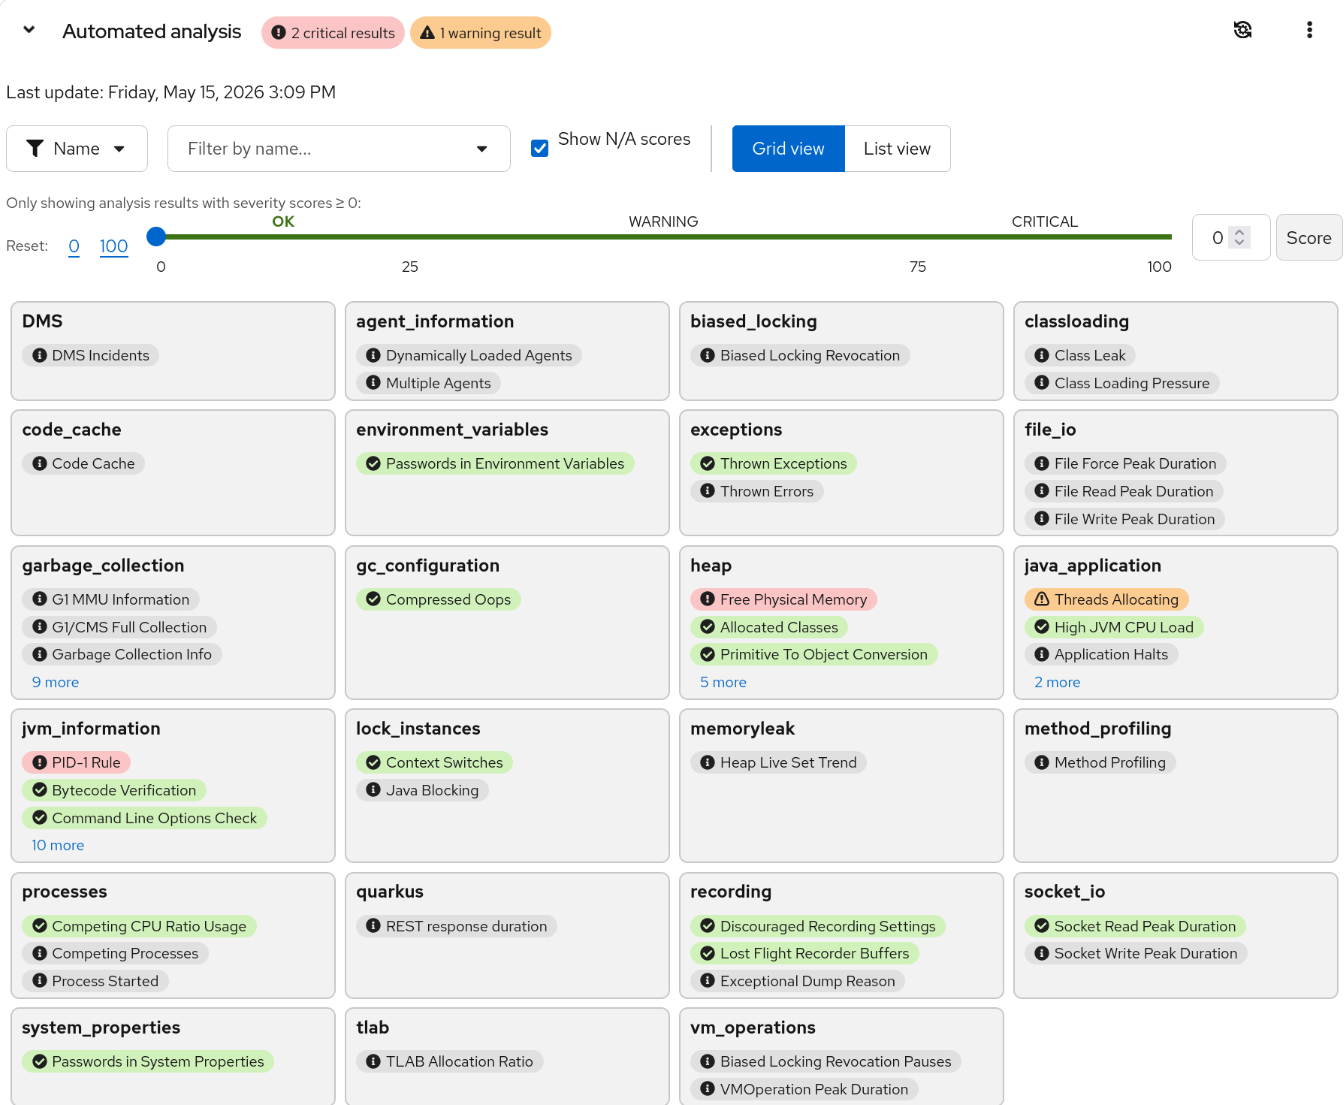
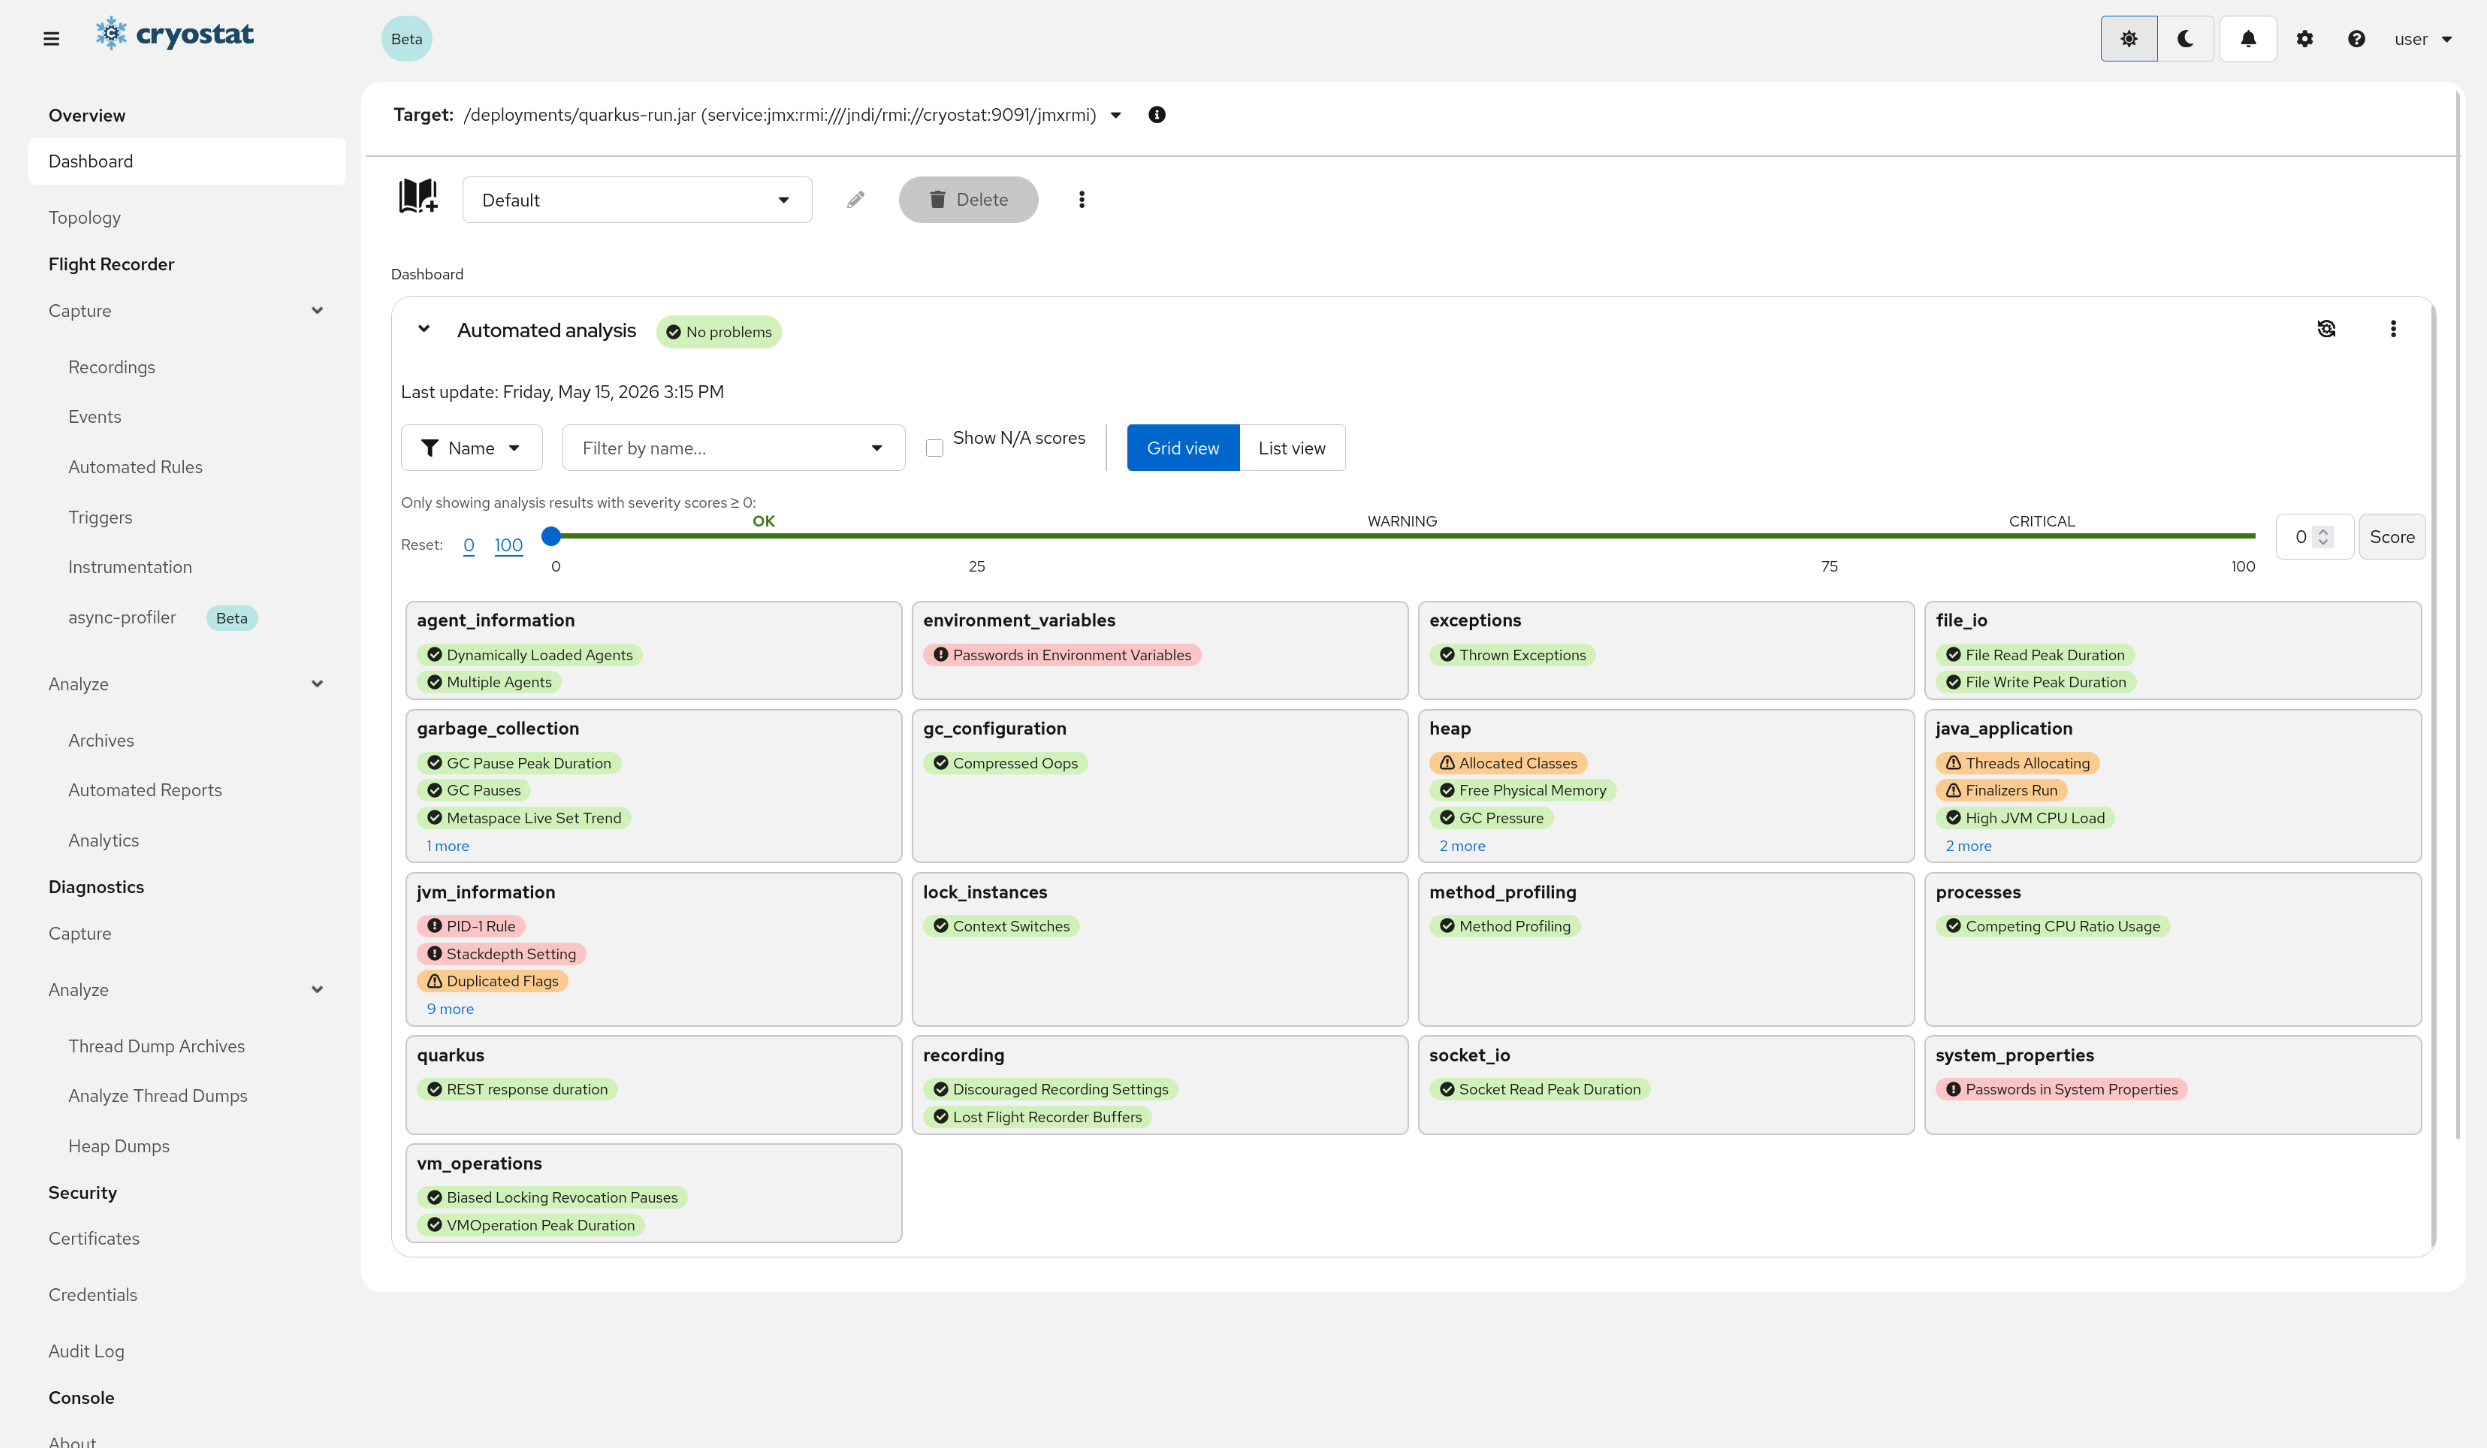
Gallery view
The Gallery view of the Automated AnalysisCard displays a Result, a report summary, for each Rule that was triggered in the selected Recording. In this view, each Rule is listed in categories based on the event type. For example, the Thrown Errors and the Thrown ExceptionsRules are part of the exceptions category, as seen in the figure above. By clicking on each Rule, you can view more details about the Rule and the Result that was generated.
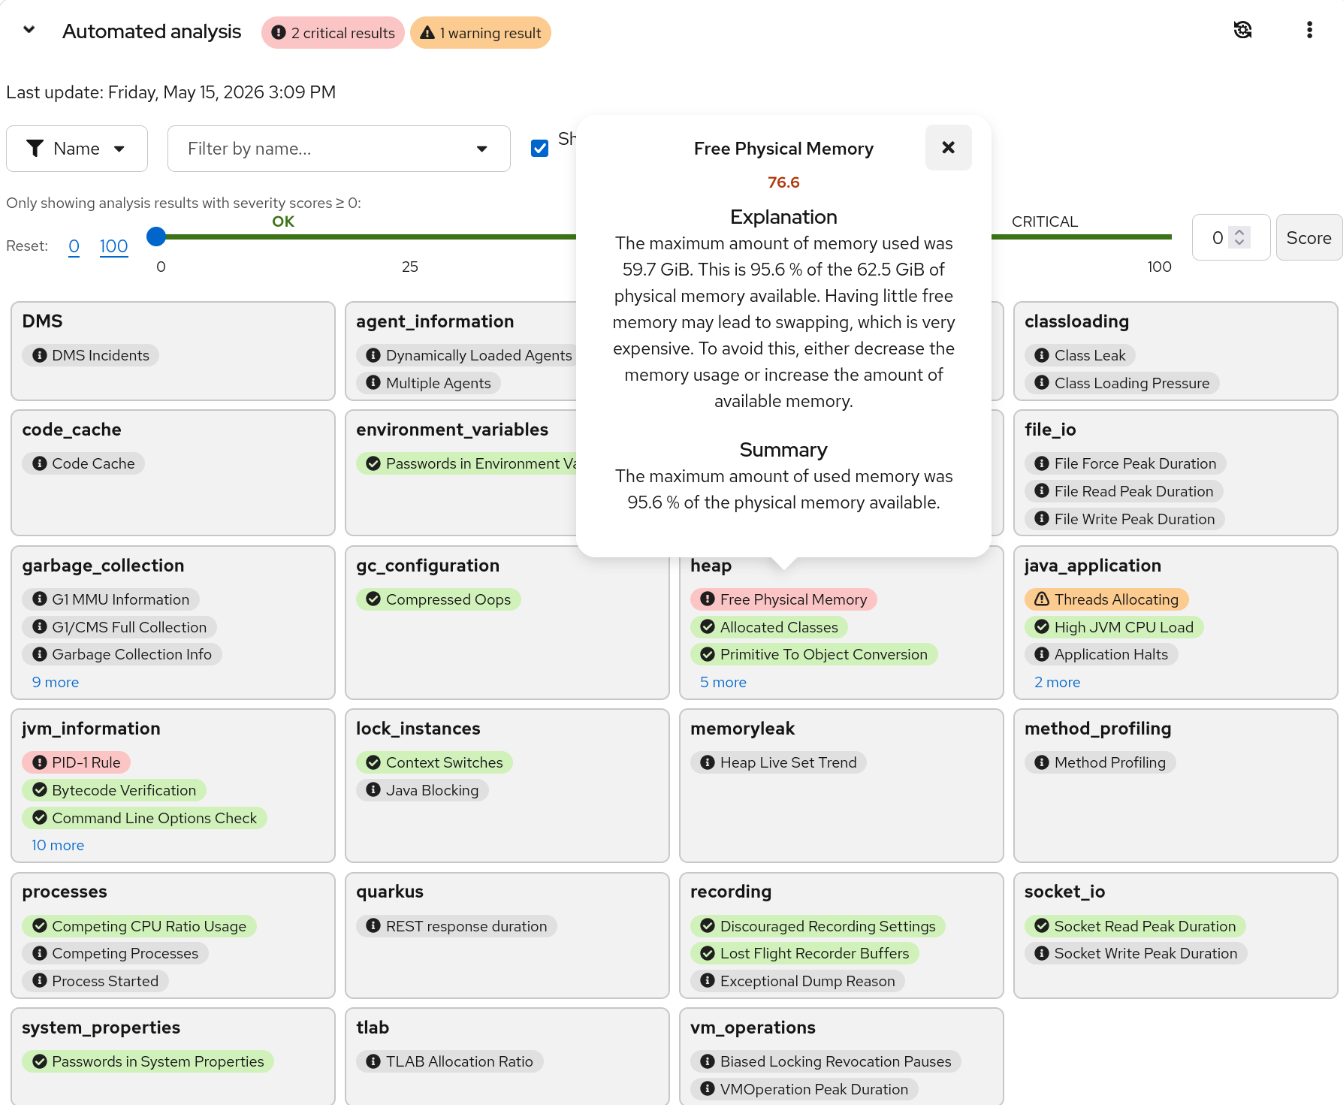
The Discouraged Management Agent SettingsRule result with a severity score of 25.0.
A Summary, Explanation, and Solution can be seen in the Result.
A Result has a severity score from 0 (no problem) to 100 (potentially severe problem).
The Result will also show three text details, if applicable:
Summary: A short summary of the problem.
Explanation: A detailed explanation of the problem.
Solution: A suggested solution to the problem.
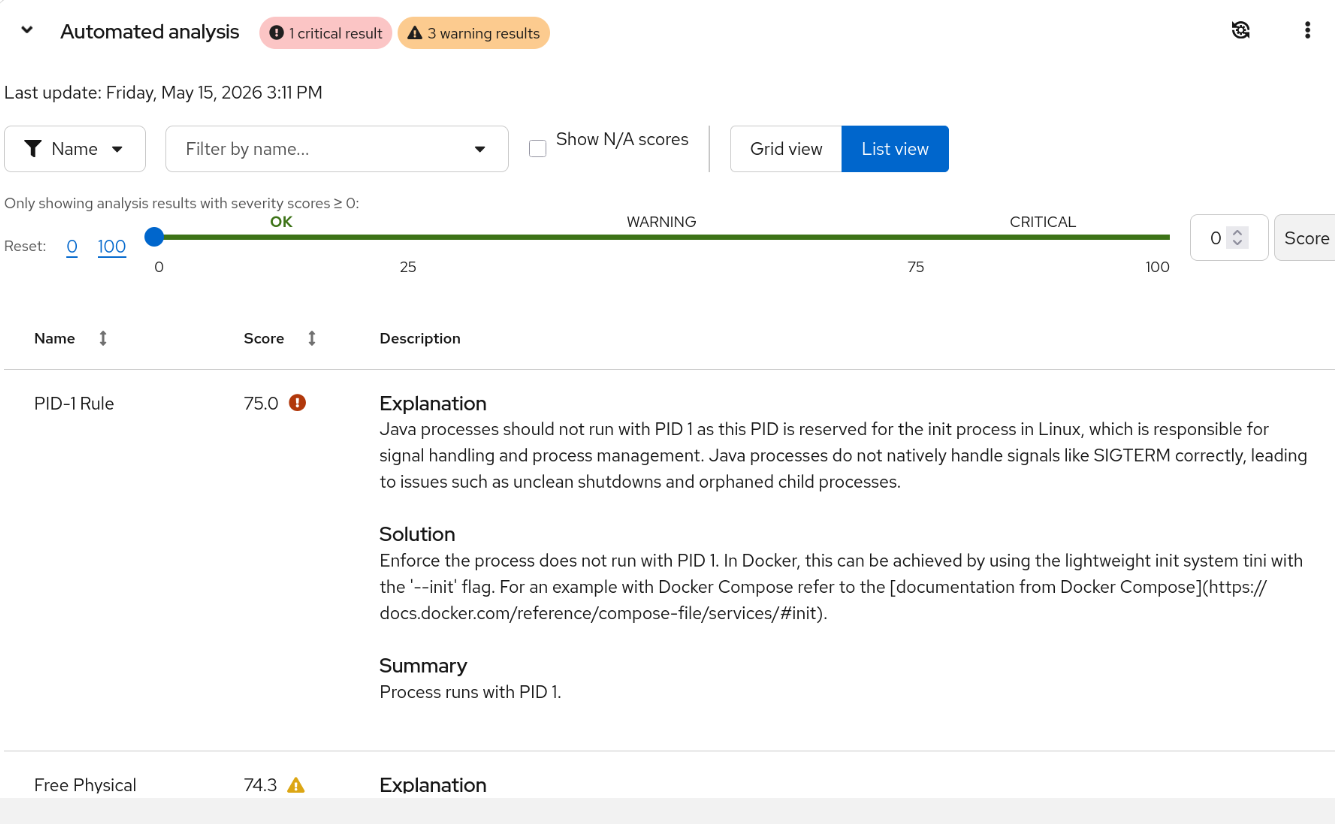
List View
The List view of the Automated AnalysisCard displays each Result in a listed table. The table can be sorted by clicking on the column headers. The Result will also show the Summary, Explanation, and Solution in the Description column.
Toolbar
The Toolbar allows you to filter results, change the view, refresh the report, and delete the report.
You are able to filter:
By severity: You can filter by severity score by dragging the score slider or typing a score in the score input. The Result table will only show results with the score greater or equal to the selected filter score. Additionally, if there are Critical or Warning results, click the corresponding labels in the card header to only show those Results. Reset the filter by clicking on the buttons next to the Reset text (i.e the `0`).
By category: You can filter by RuleName or Topic by clicking on the Name filter dropdown. Then select a filtered item by clicking the Dropdown next to it. You may also type in this Dropdown to search for a specific item. The Result table will only show results that match the selected filter.
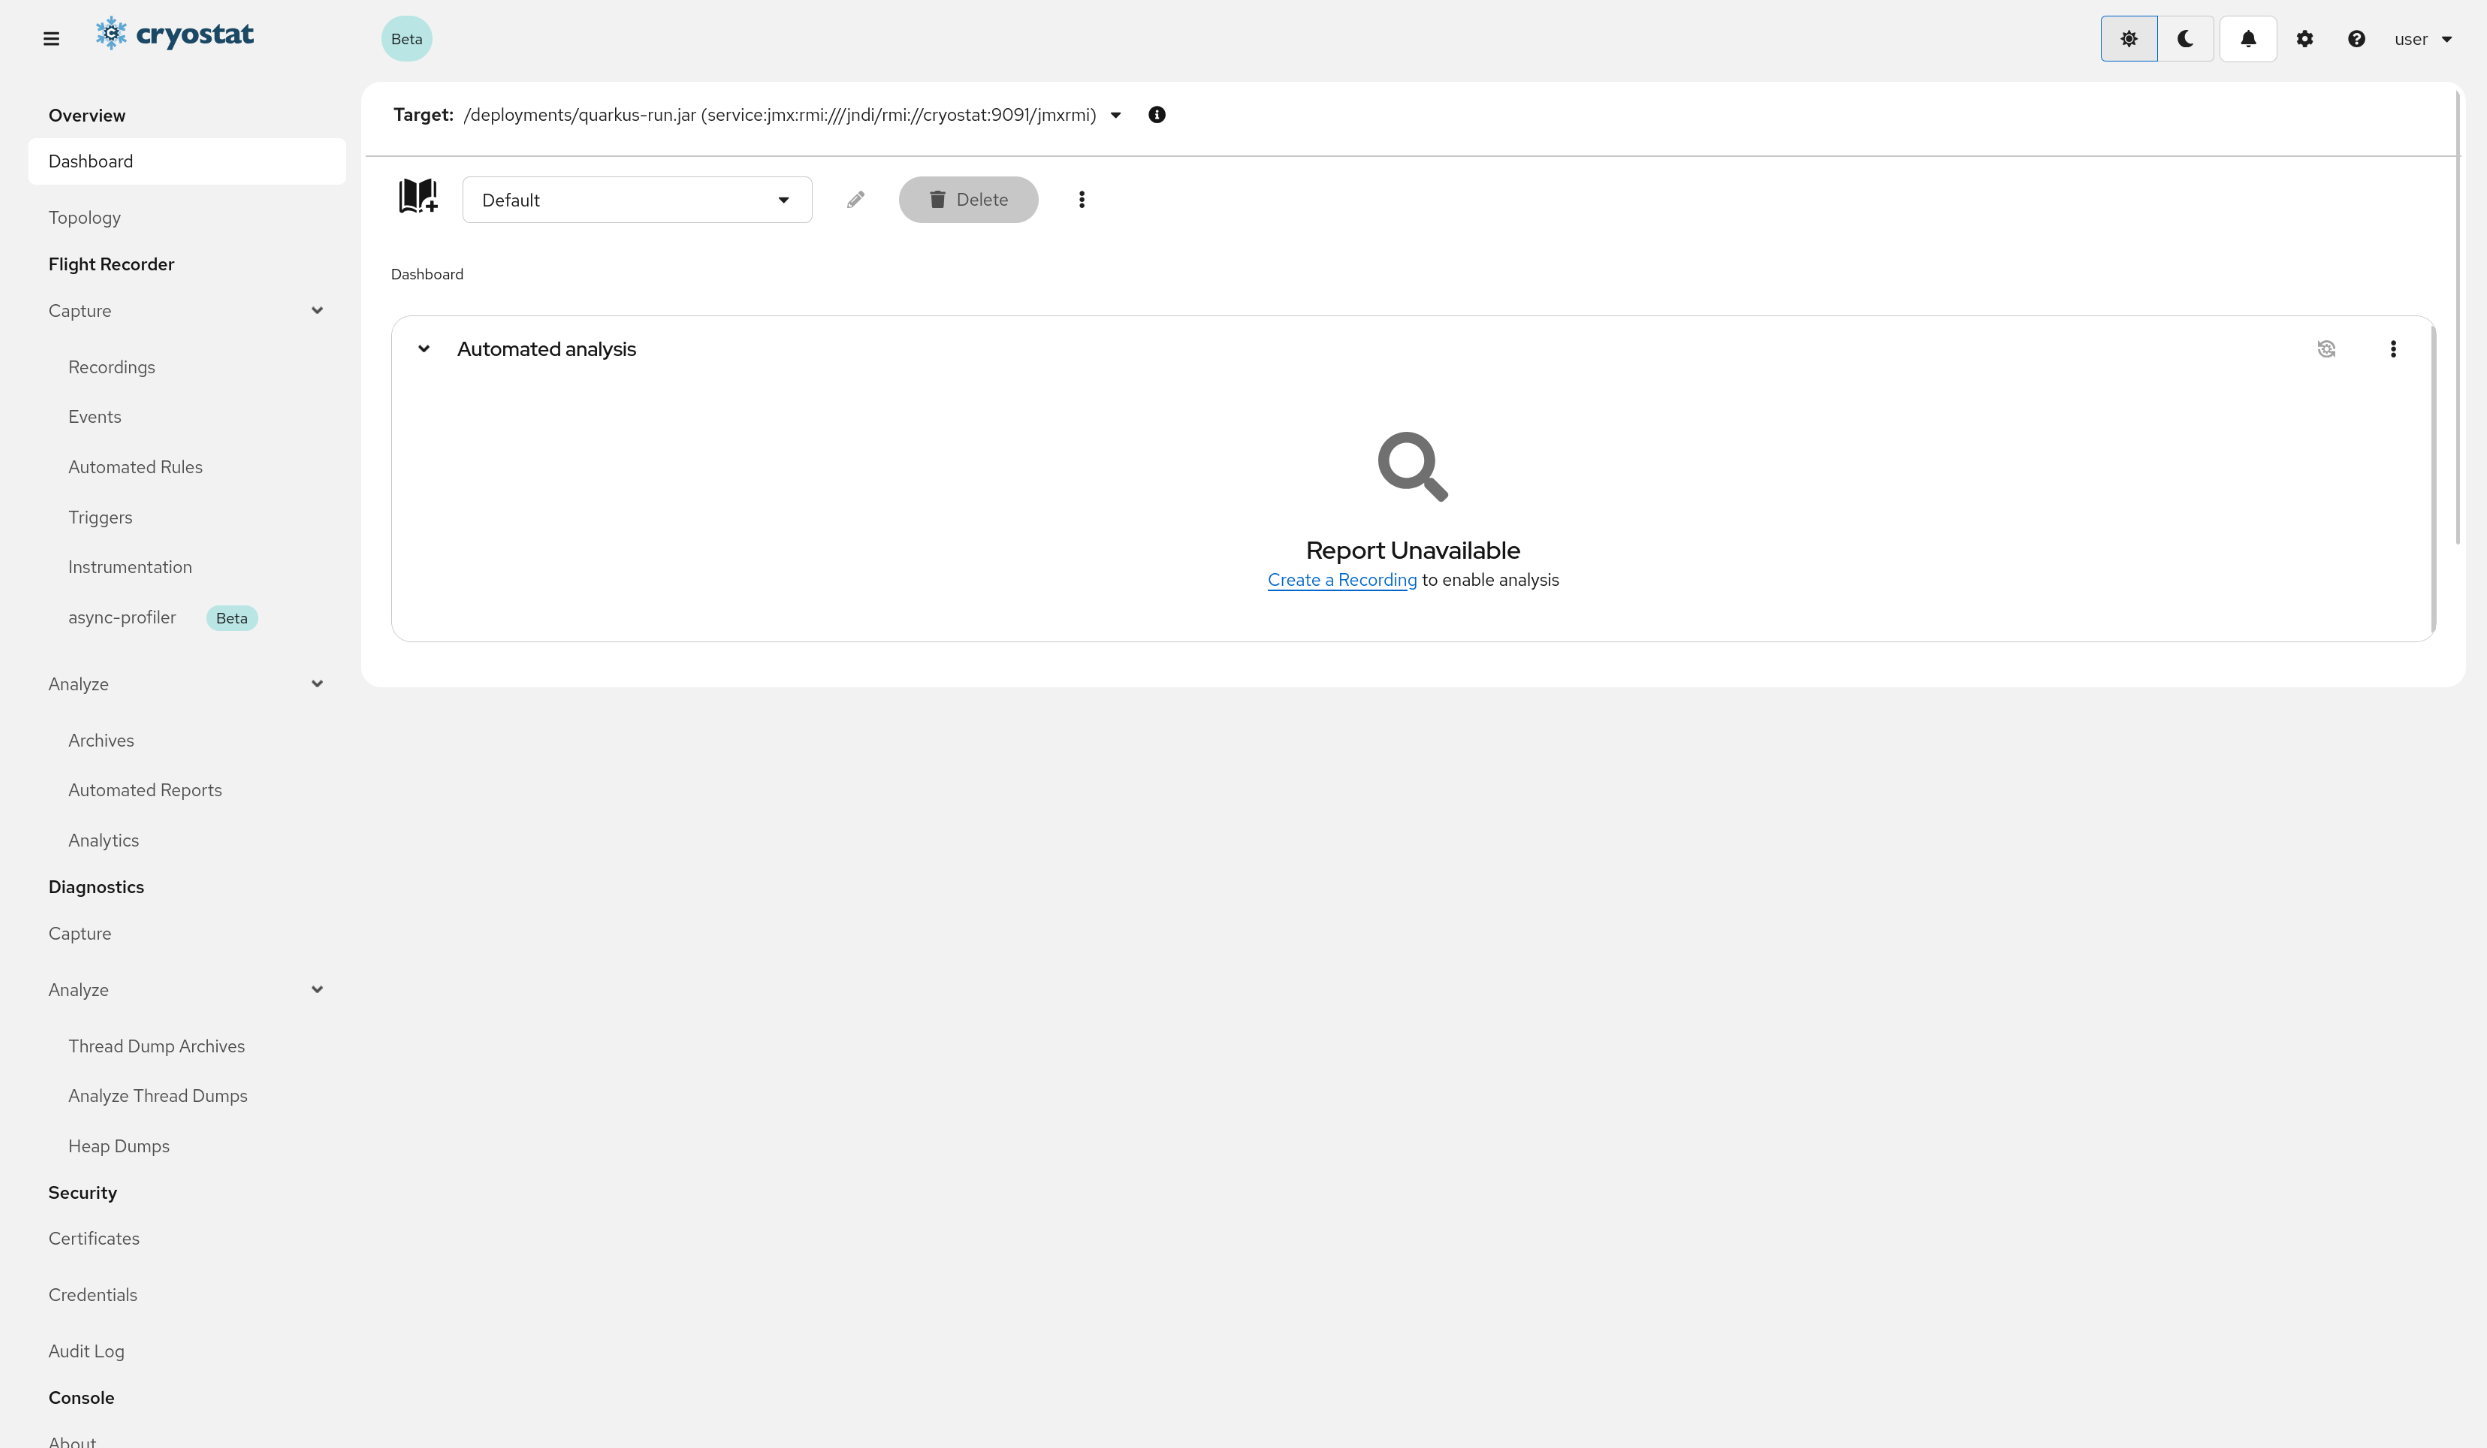
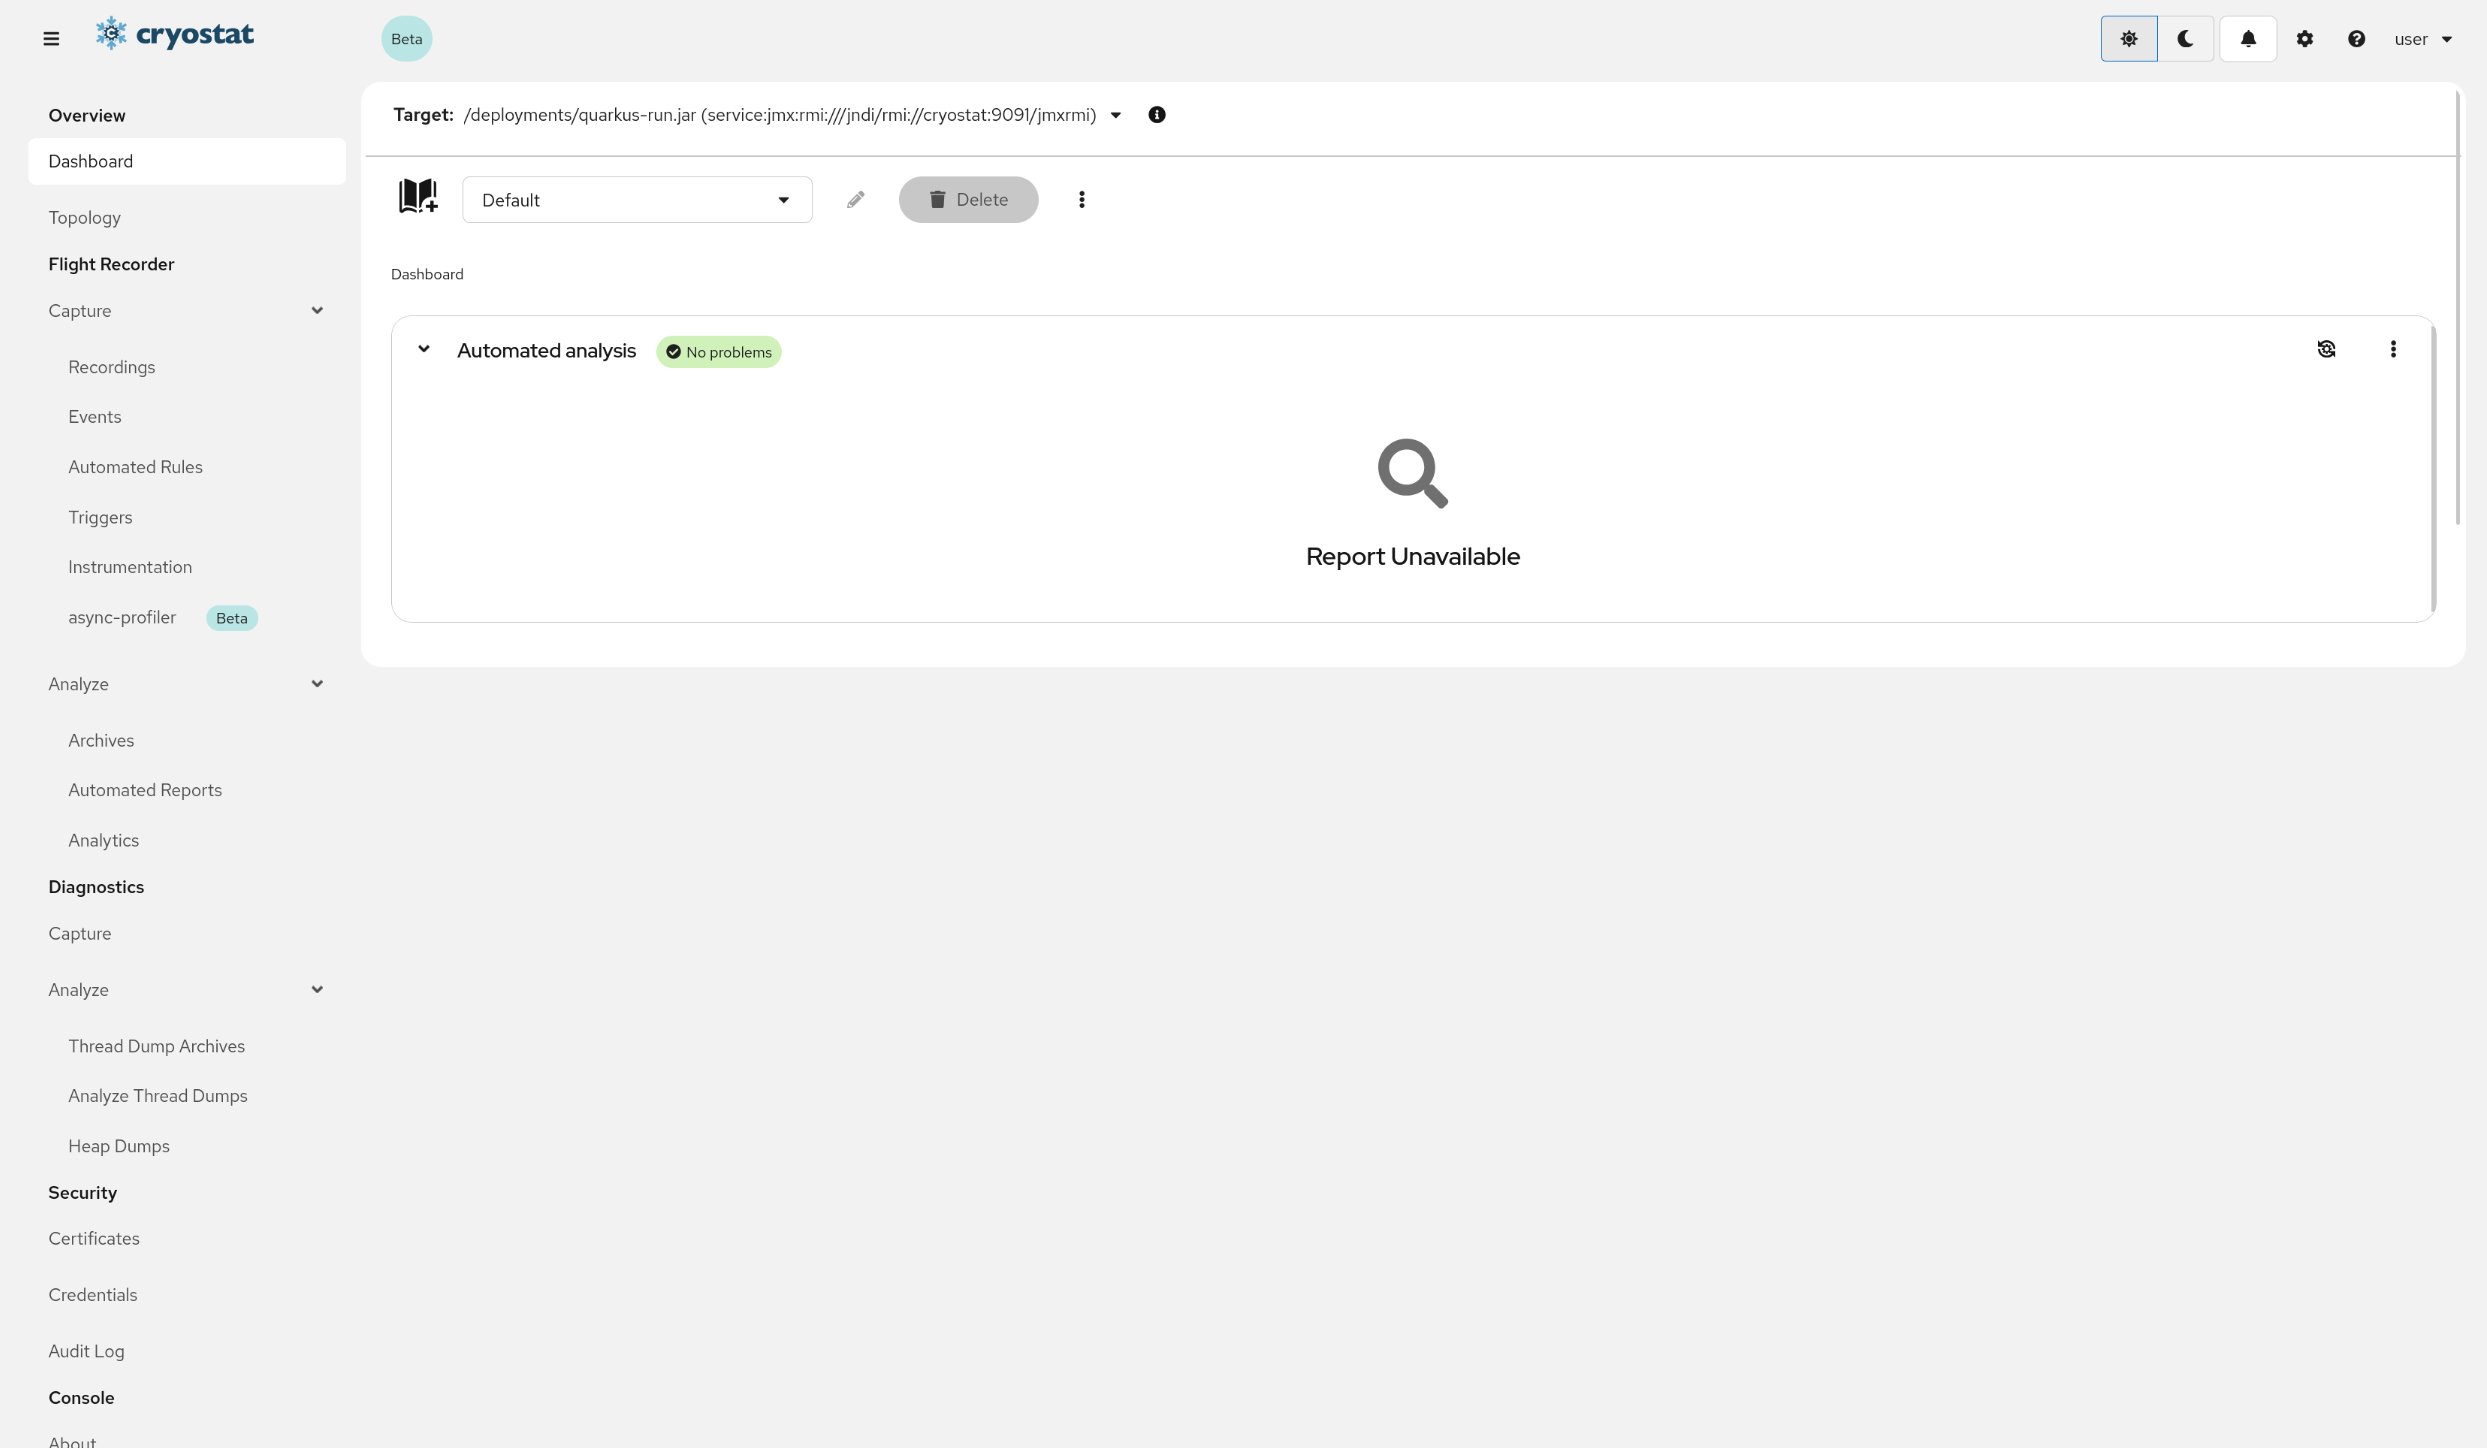
Finish Card CreationThe card will be added to the dashboard with an empty state. The Create a Recording call to action will guide you through recording creation with suggested default settings. Return to the Dashboard once a recording has been started.
Perform Analysis
View resultsThe Automated Analysiscard displayed with a successful report.
After clicking Create Recording, the card should be populated with report data containing the Results of the Automated Analysis report.
Add the MBean Metrics ChartCardClick on the MBean Metrics Chartcard for a preview.
The MBean Metrics Chartcard displays performance metrics about the targetJVM through remote access to supported Java MXBeans interfaces of the JVM, including Thread, Runtime, OperatingSystem, and Memory MXBeans.
Cryostat gathers this data and displays them in various charts. You can customize each card by going through the card creation wizard. The wizard will guide you through the process of selecting the metrics you want to display, how you want to display them, and other various configuration options. Some examples of Performance Metrics that can be displayed are:
Process CPU Load
System Load Average
Heap Memory Usage
...
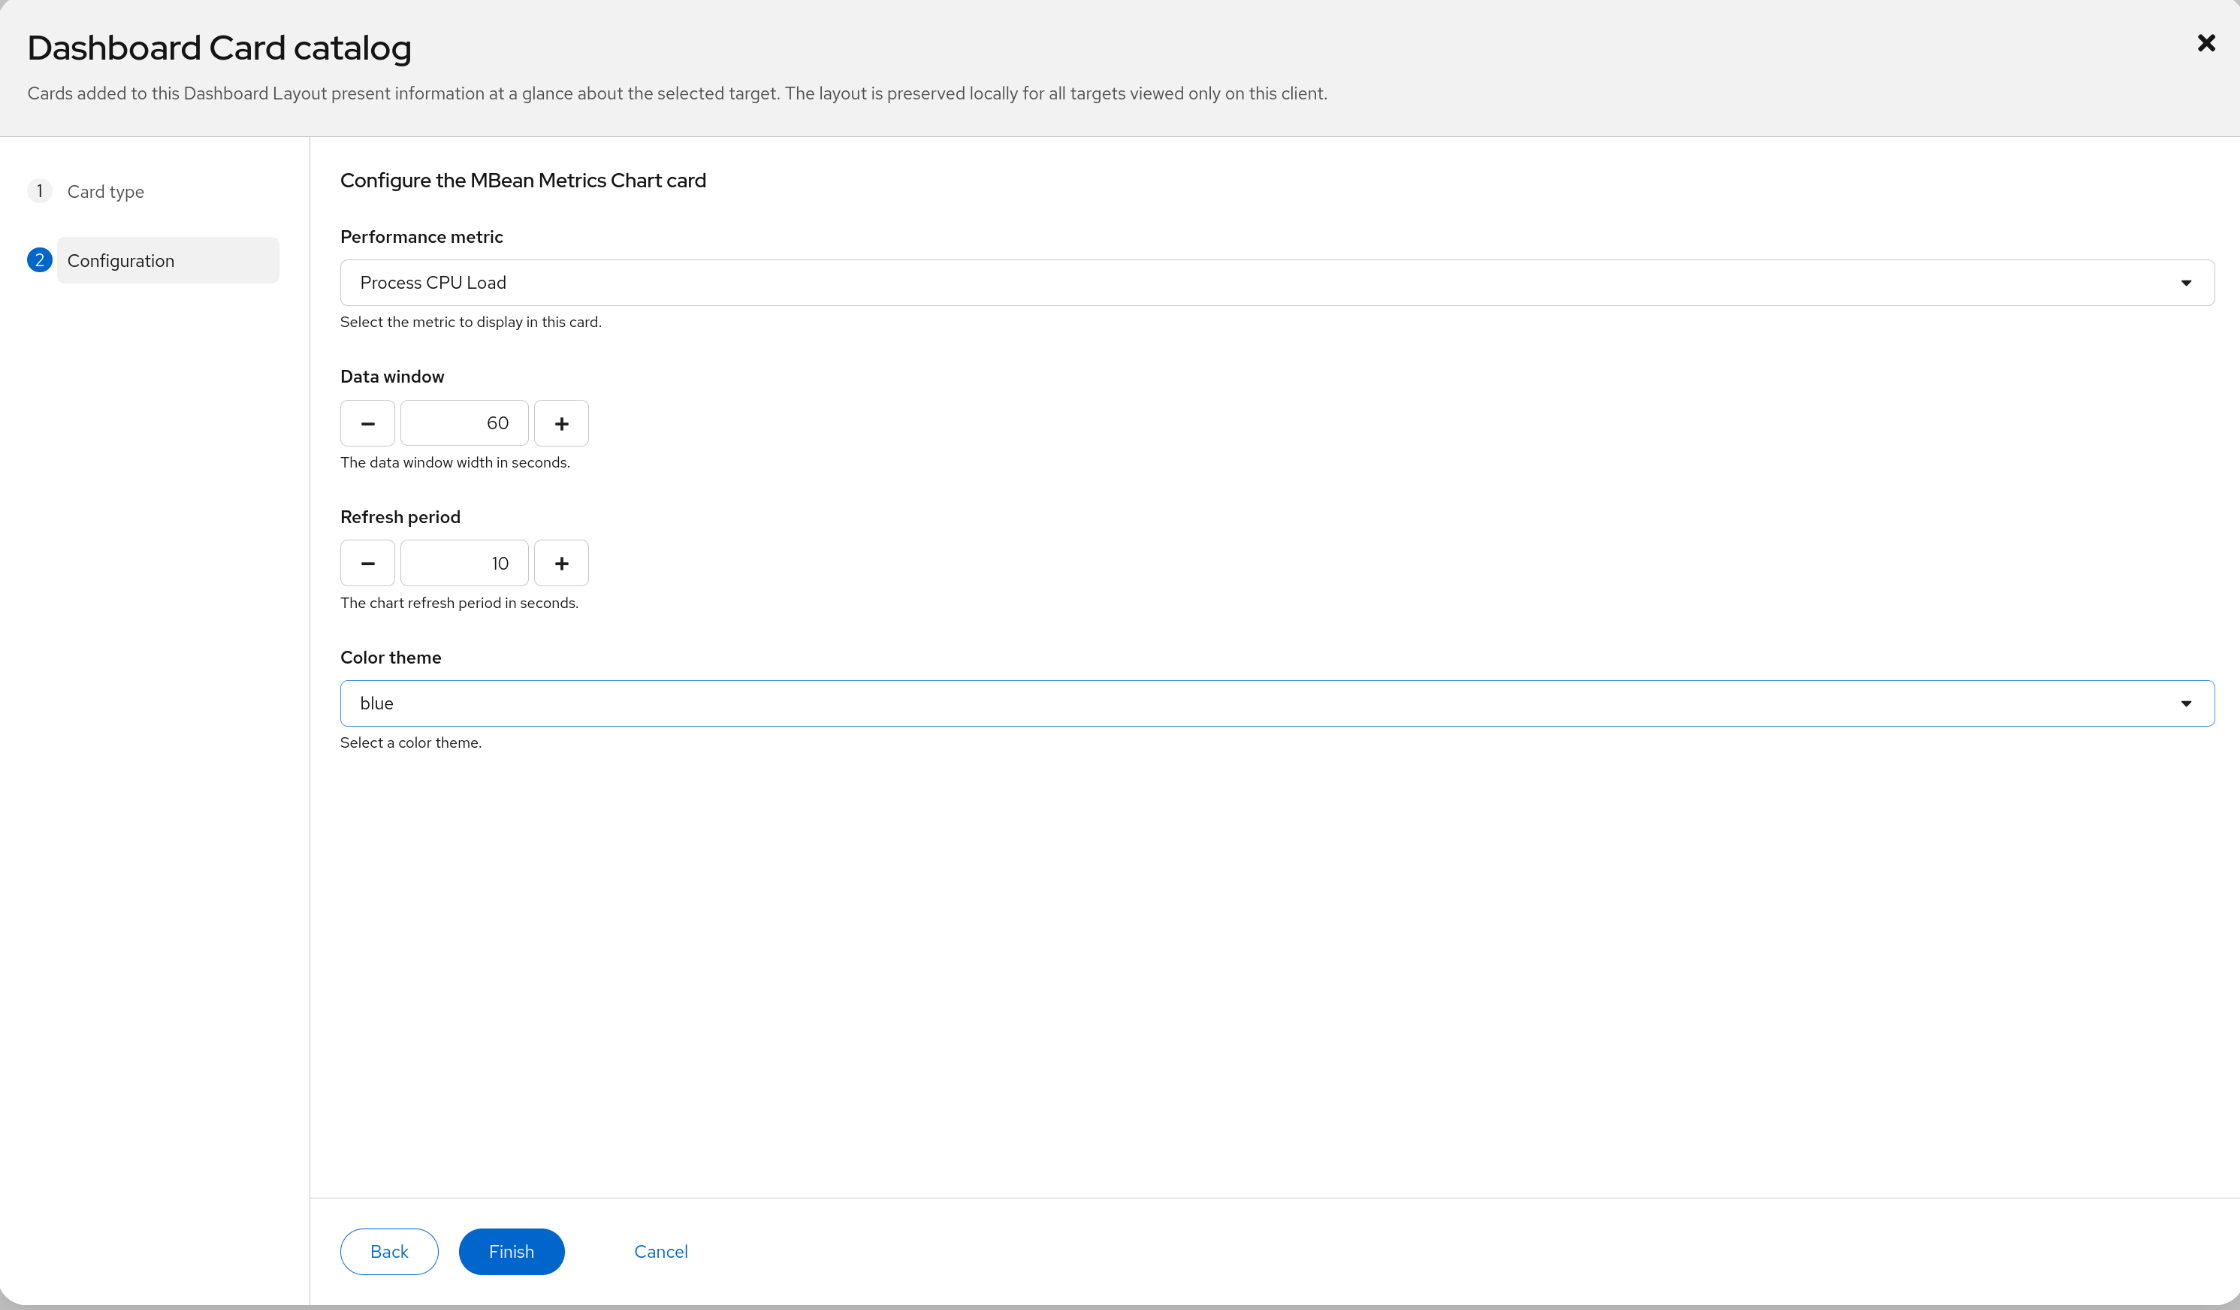
Configure the MBean Metrics ChartCardClick Next to provide card configuration.
In the next steps of the card creation, you can configure the details of the chart card.
Configure the metric data by clicking the Performance Metric dropdown and selecting a metric. You can also configure the Data Window to display a specific time range of data, the Refresh Period to control how often the chart is updated, and the Color Theme to change the chart metric color.
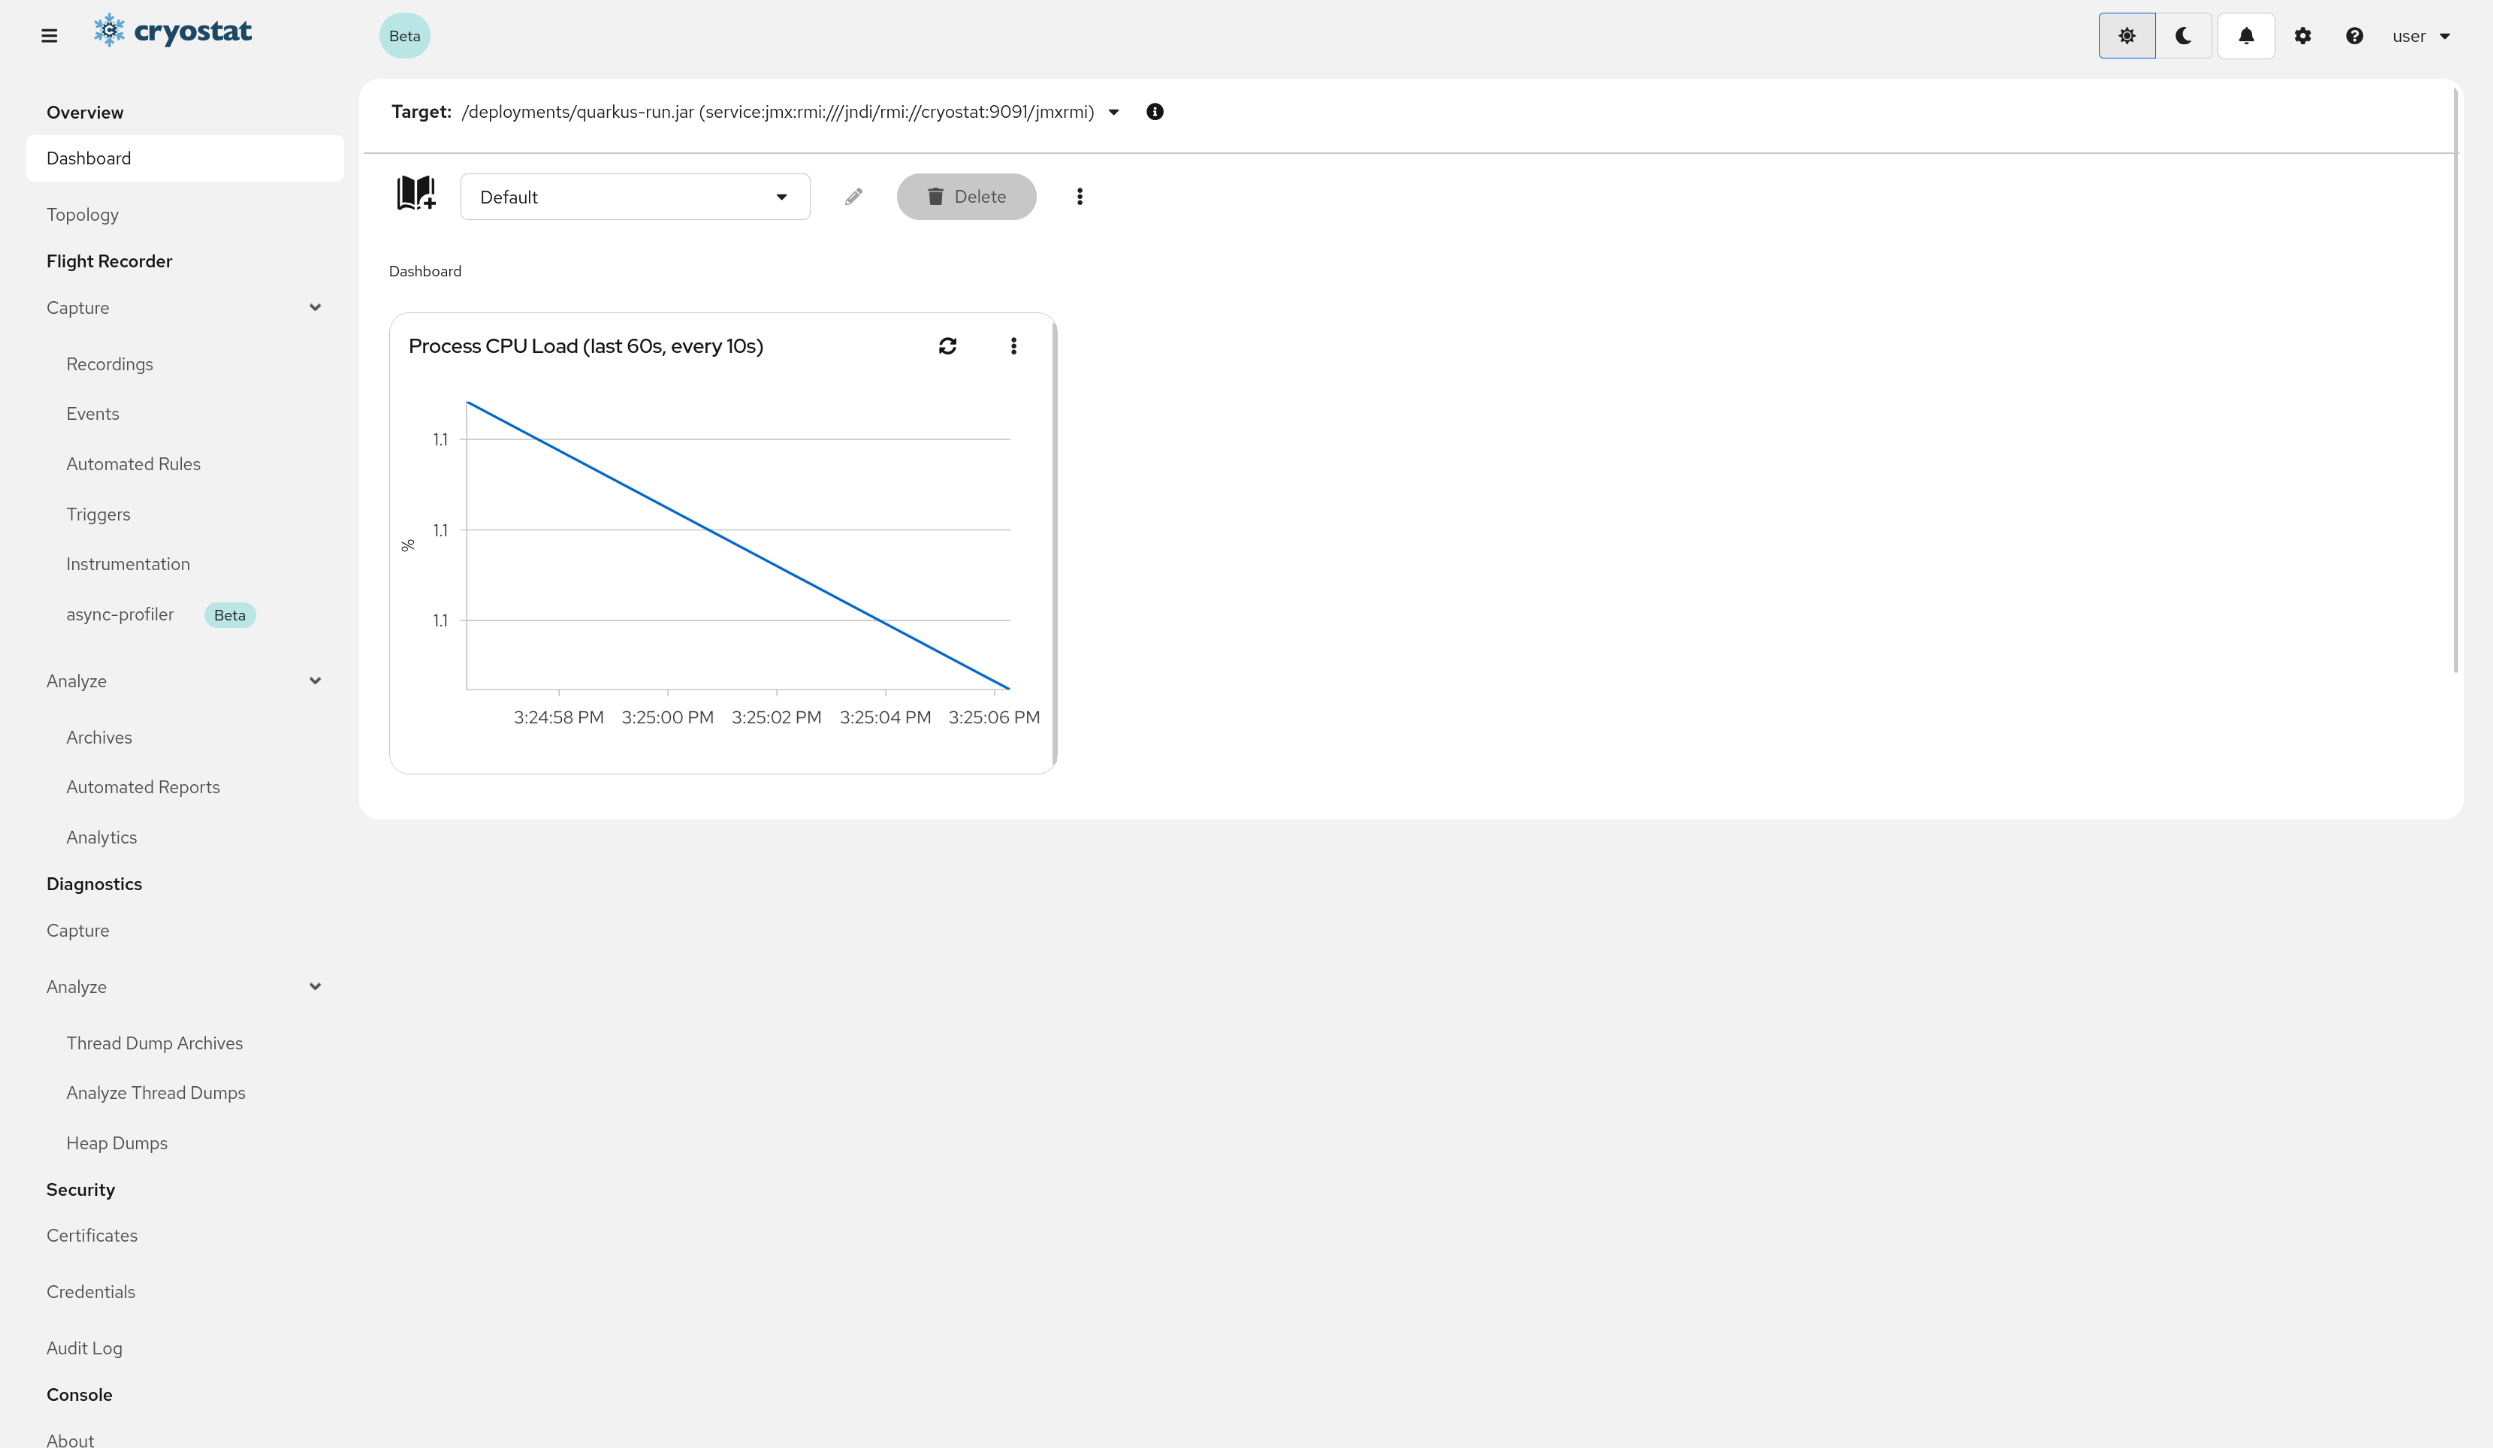
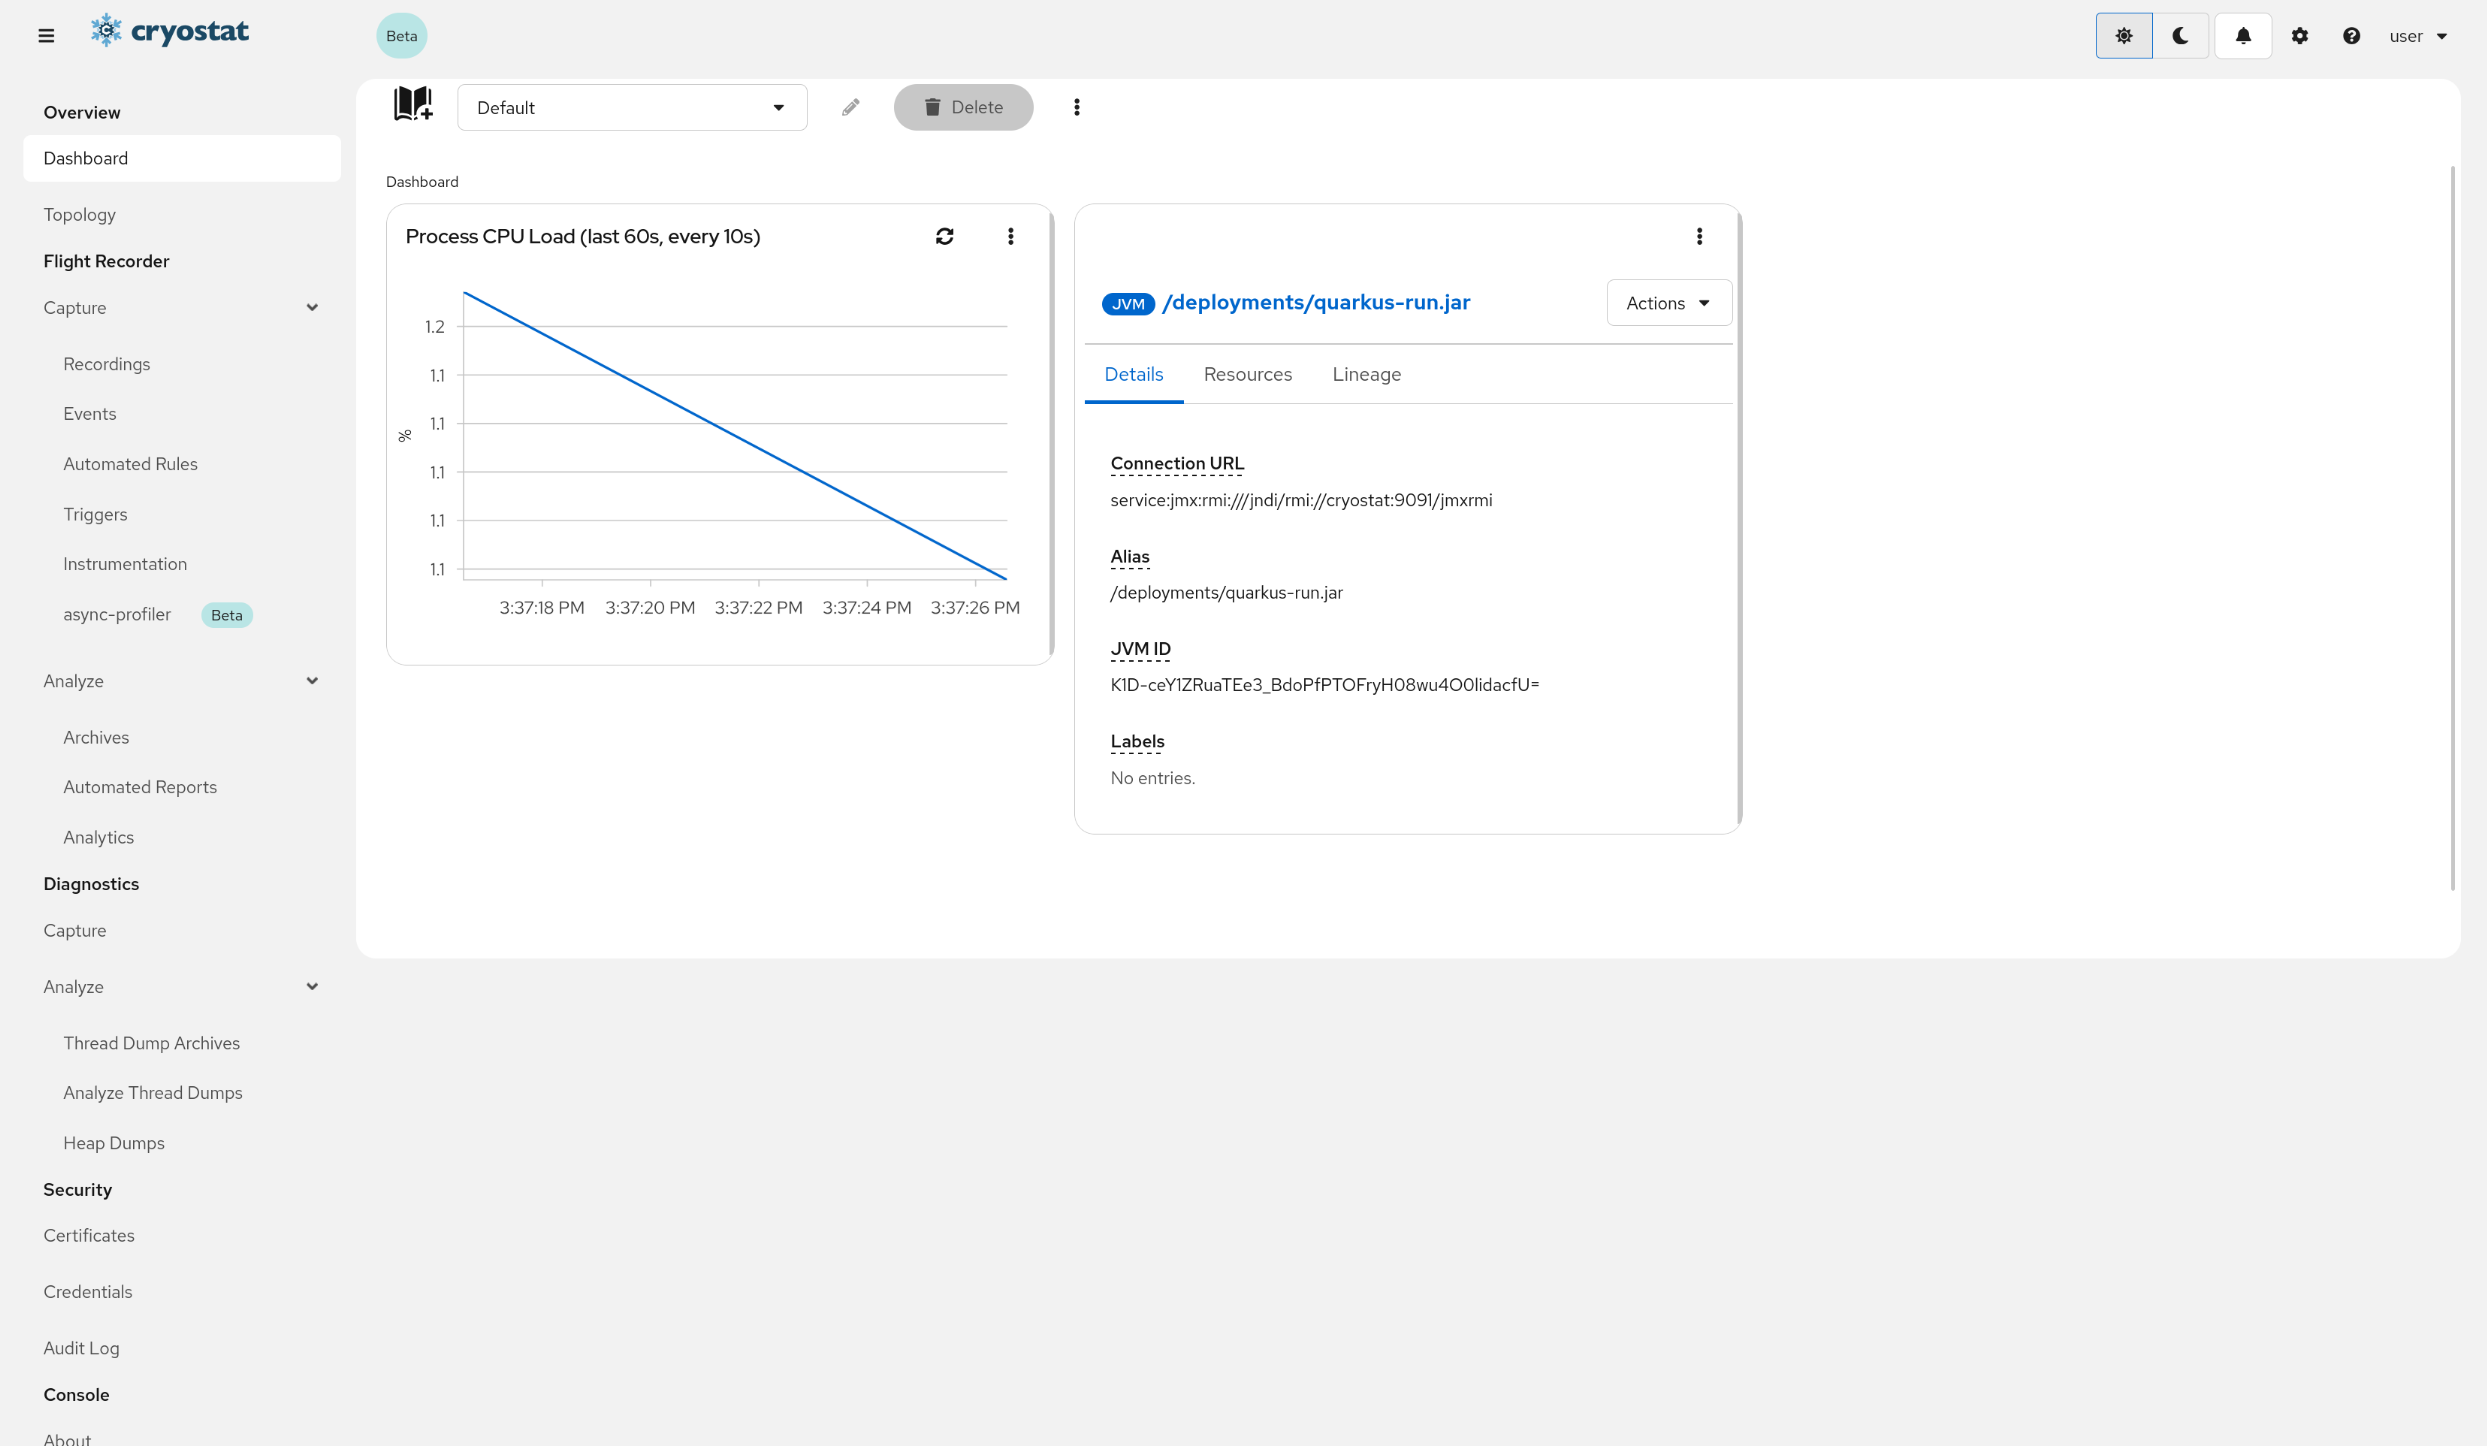
Finish Card CreationThe MBean Metrics Chartcard displayed with the Process CPU Load metric.
After clicking Finish, the card will be added to the dashboard. You can click the refresh button "↻" on the top right of the card at any time to reload the metrics.
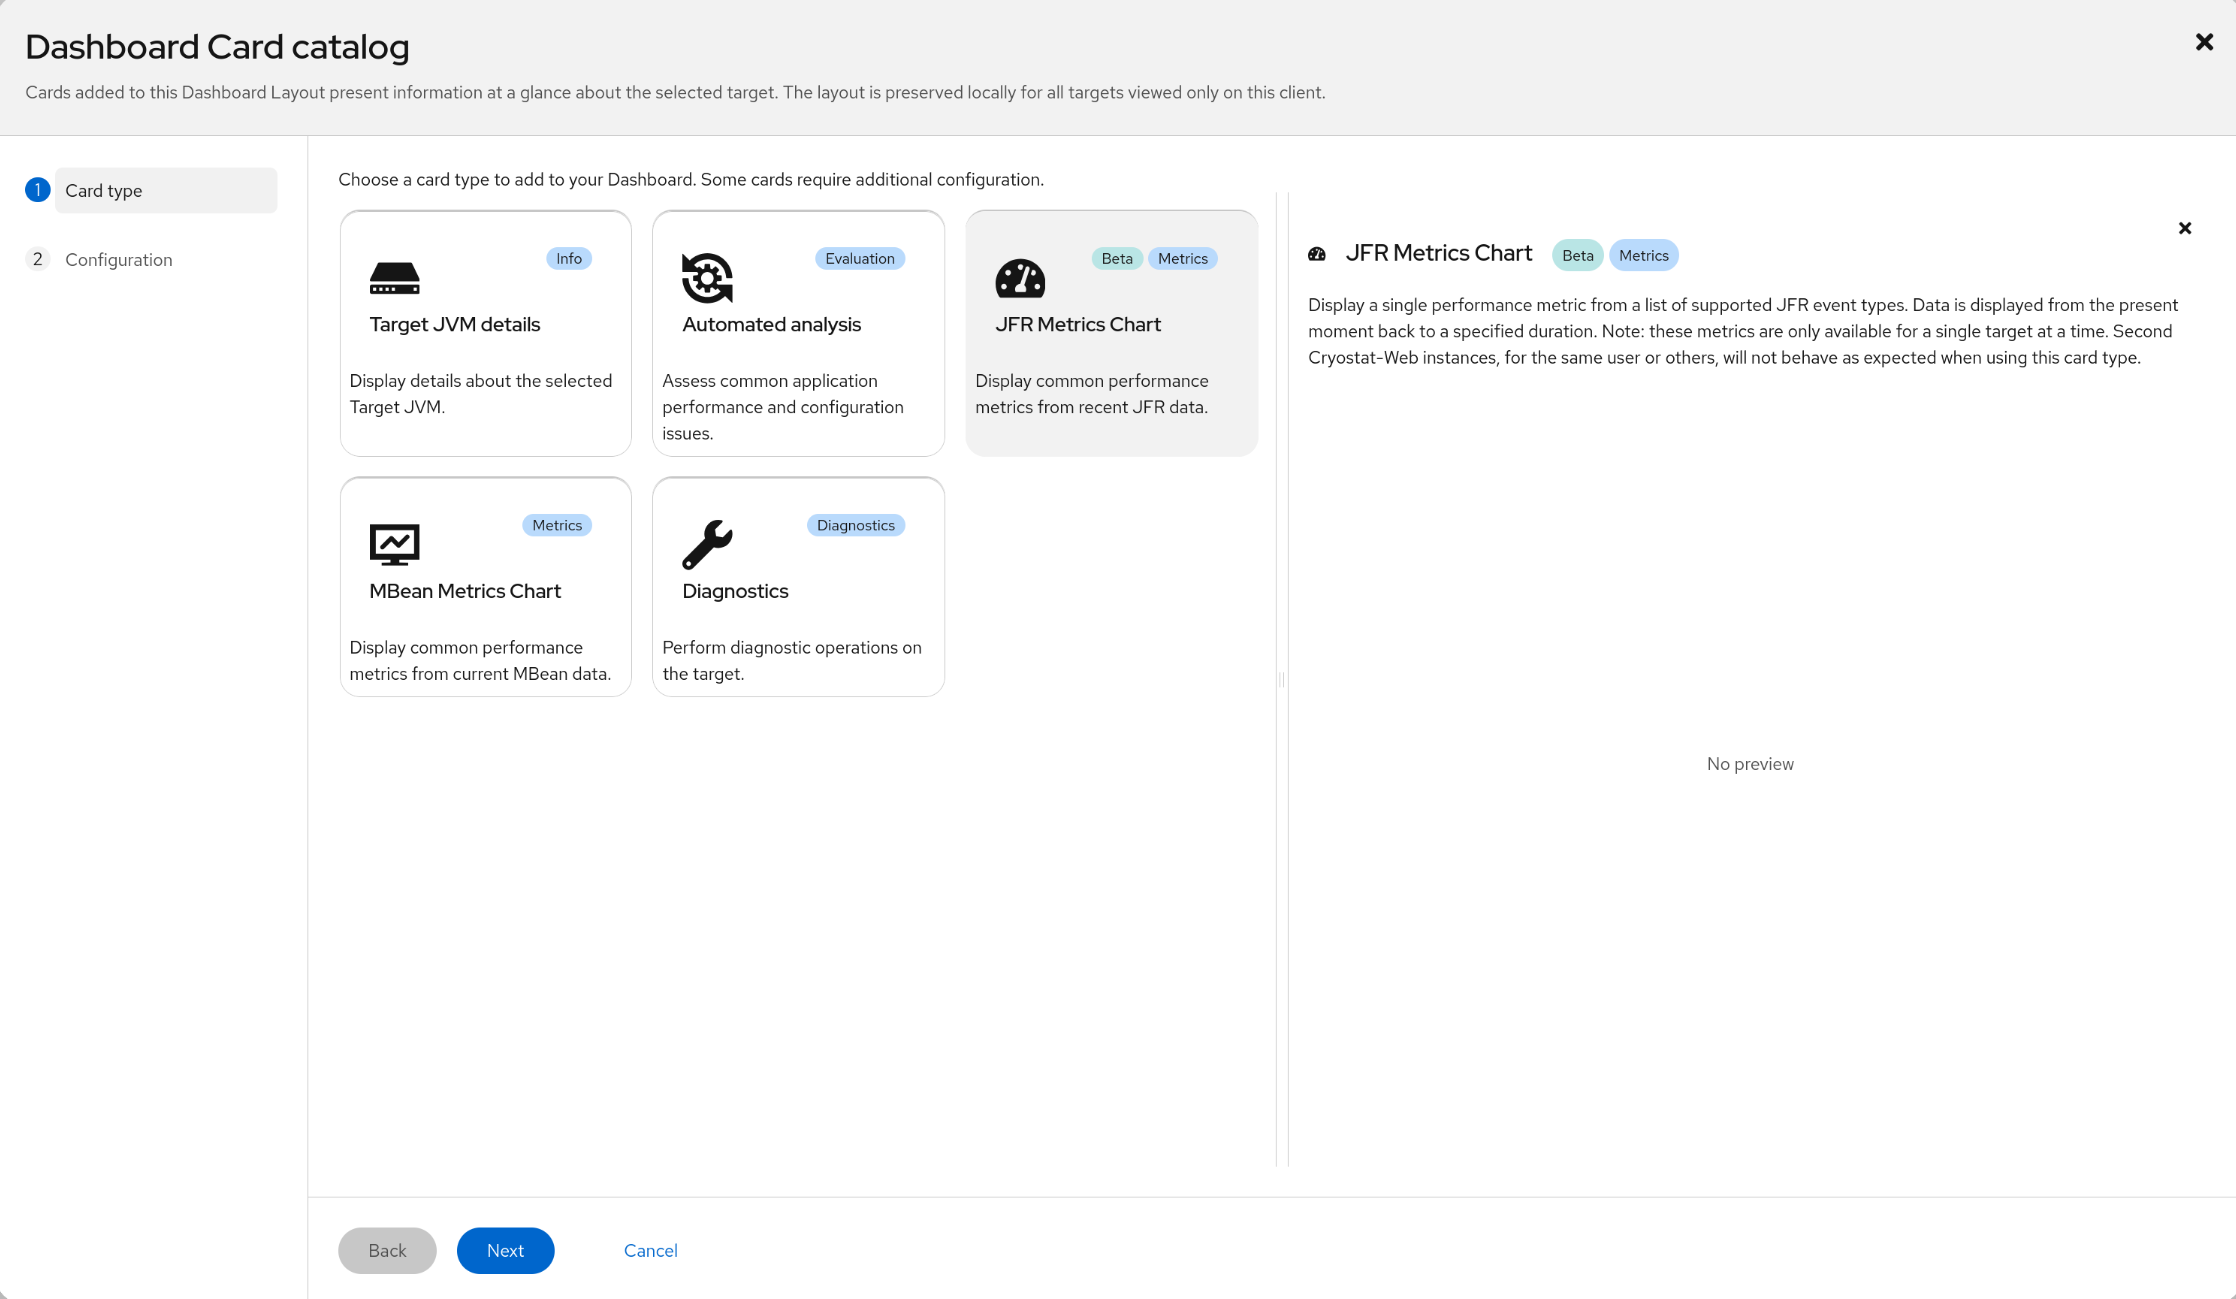
Add the JFR Metrics ChartCardClick on the JFR Metrics Chartcard. No preview is available.
The JFR Metrics Chartcard displays performance metrics about the targetJVM by visualizing JFR data snapshots via embedded Grafana visualization panels as Dashboard cards. This is a Beta-level feature. A significant limitation of this card is that it depends upon the stateful jfr-datasource backend component, which only converts one Flight Recording file at a time to Grafana data. Therefore, this card does not behave well if multiple web-client instances are open at the same time, whether used by one user or multiple human users.
Cryostat gathers typical JFR data from the selected Targetand periodically updates the Grafana visualizations. You can customize each card by going through the card creation wizard. The wizard will guide you through the process of selecting the metrics you want to display, how you want to display them, and other various configuration options. Some examples of Performance Metrics that can be displayed are:
CPU Load
Memory Usage
Heap Usage
Network Utilization
File I/O
Exception Statistics
...
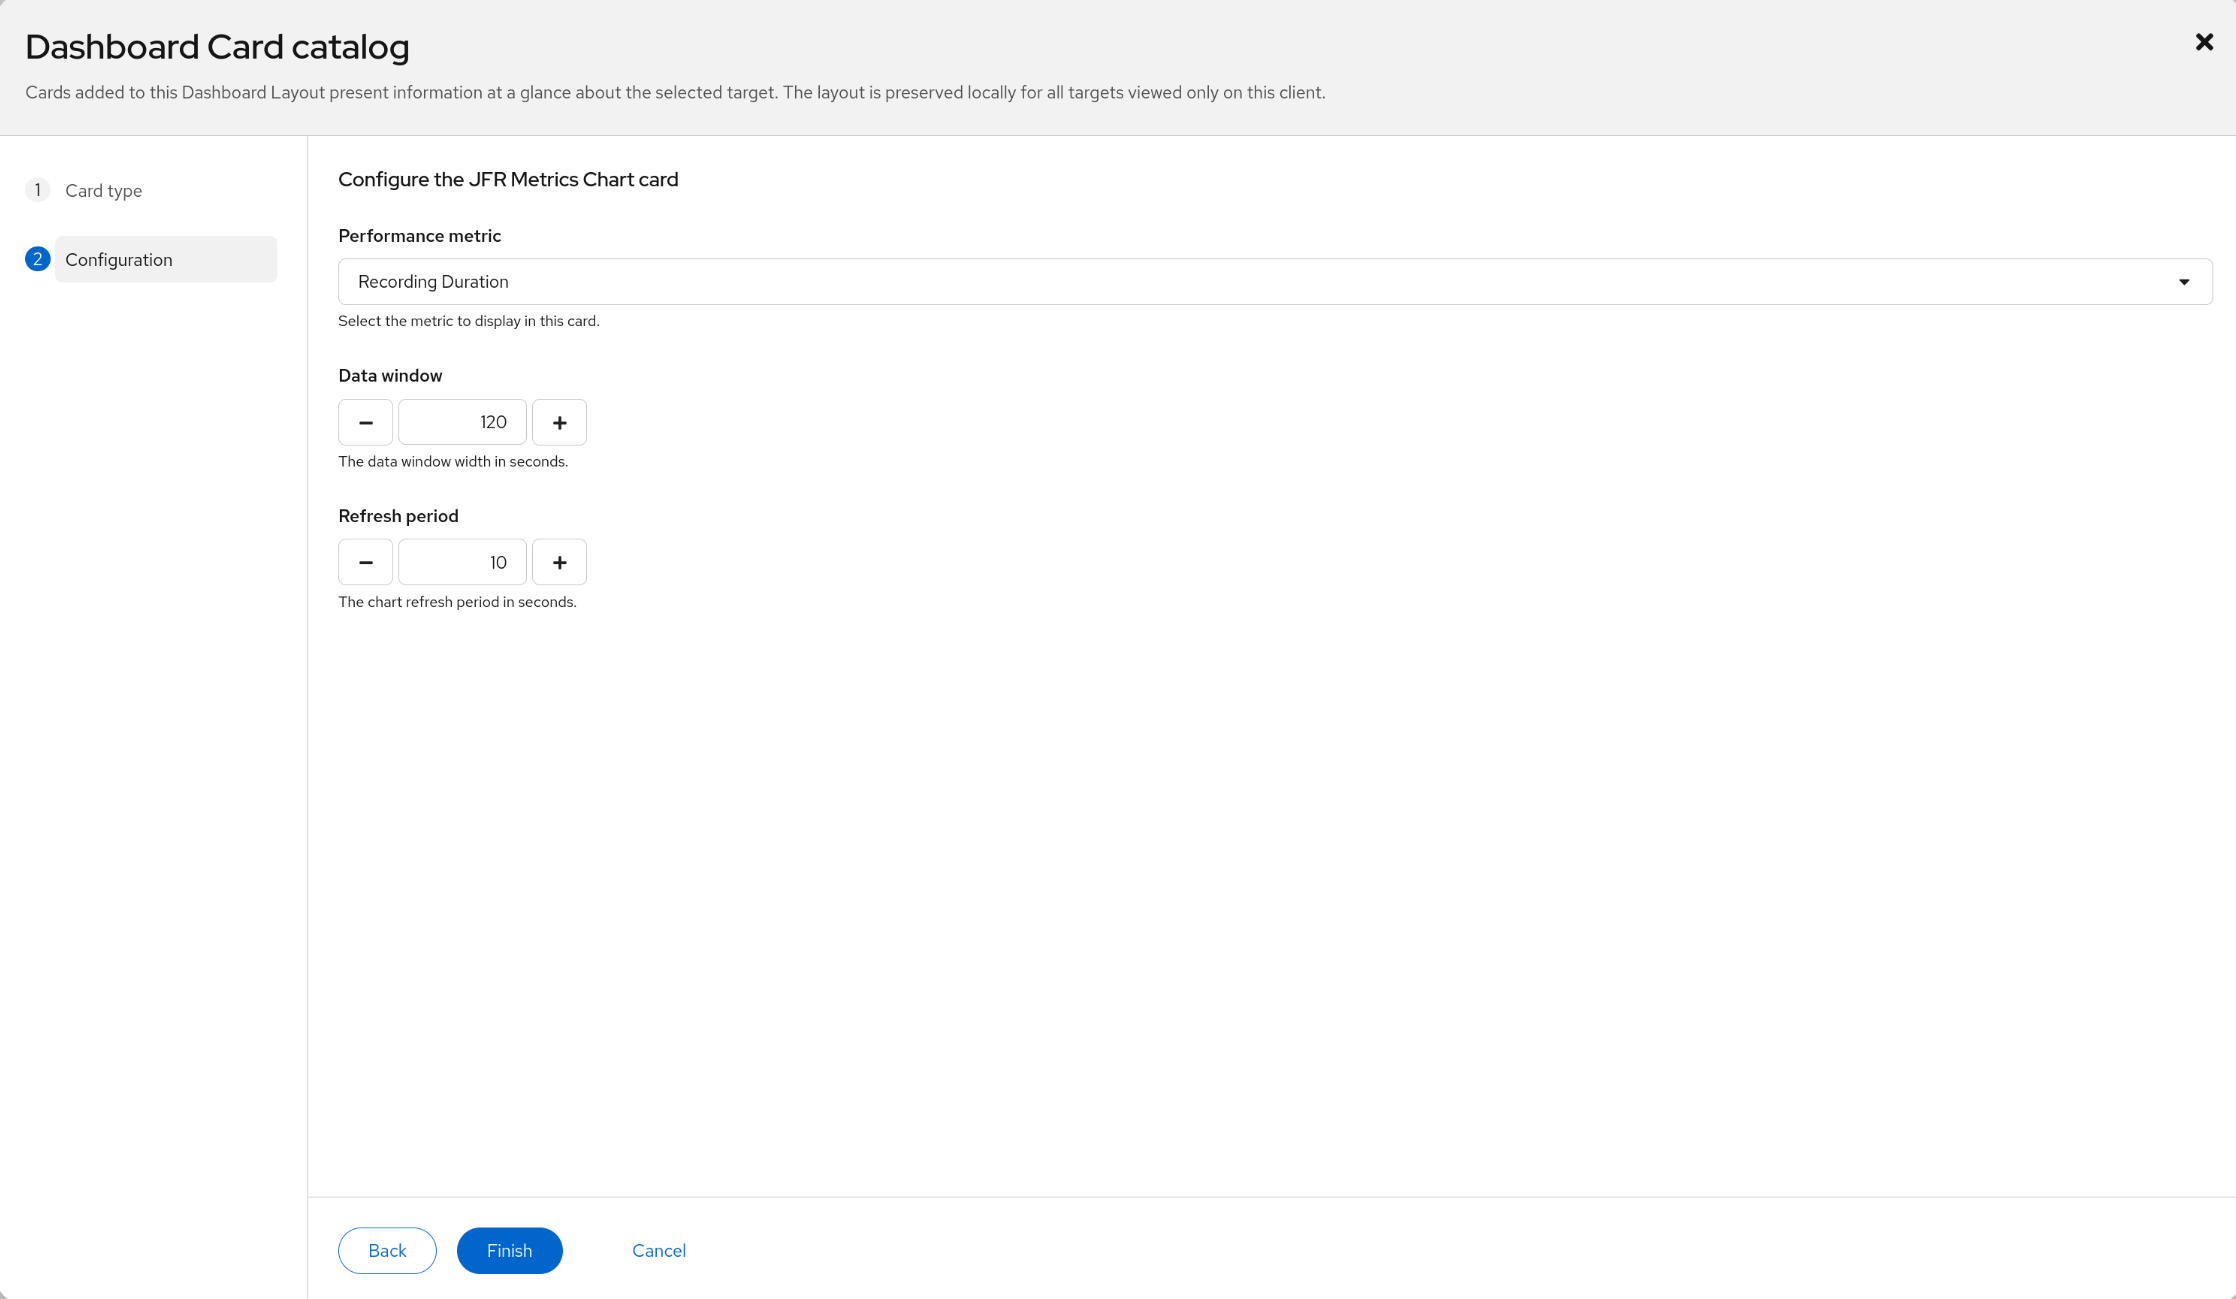
Configure the JFR Metrics ChartCardClick Next to provide card configuration.
In the next steps of the card creation, you can configure the details of the chart card.
Configure the metric data by clicking the Performance Metric dropdown and selecting a metric. You can also configure the Data Window to display a specific time range of data and the Refresh Period to control how often the chart is updated.
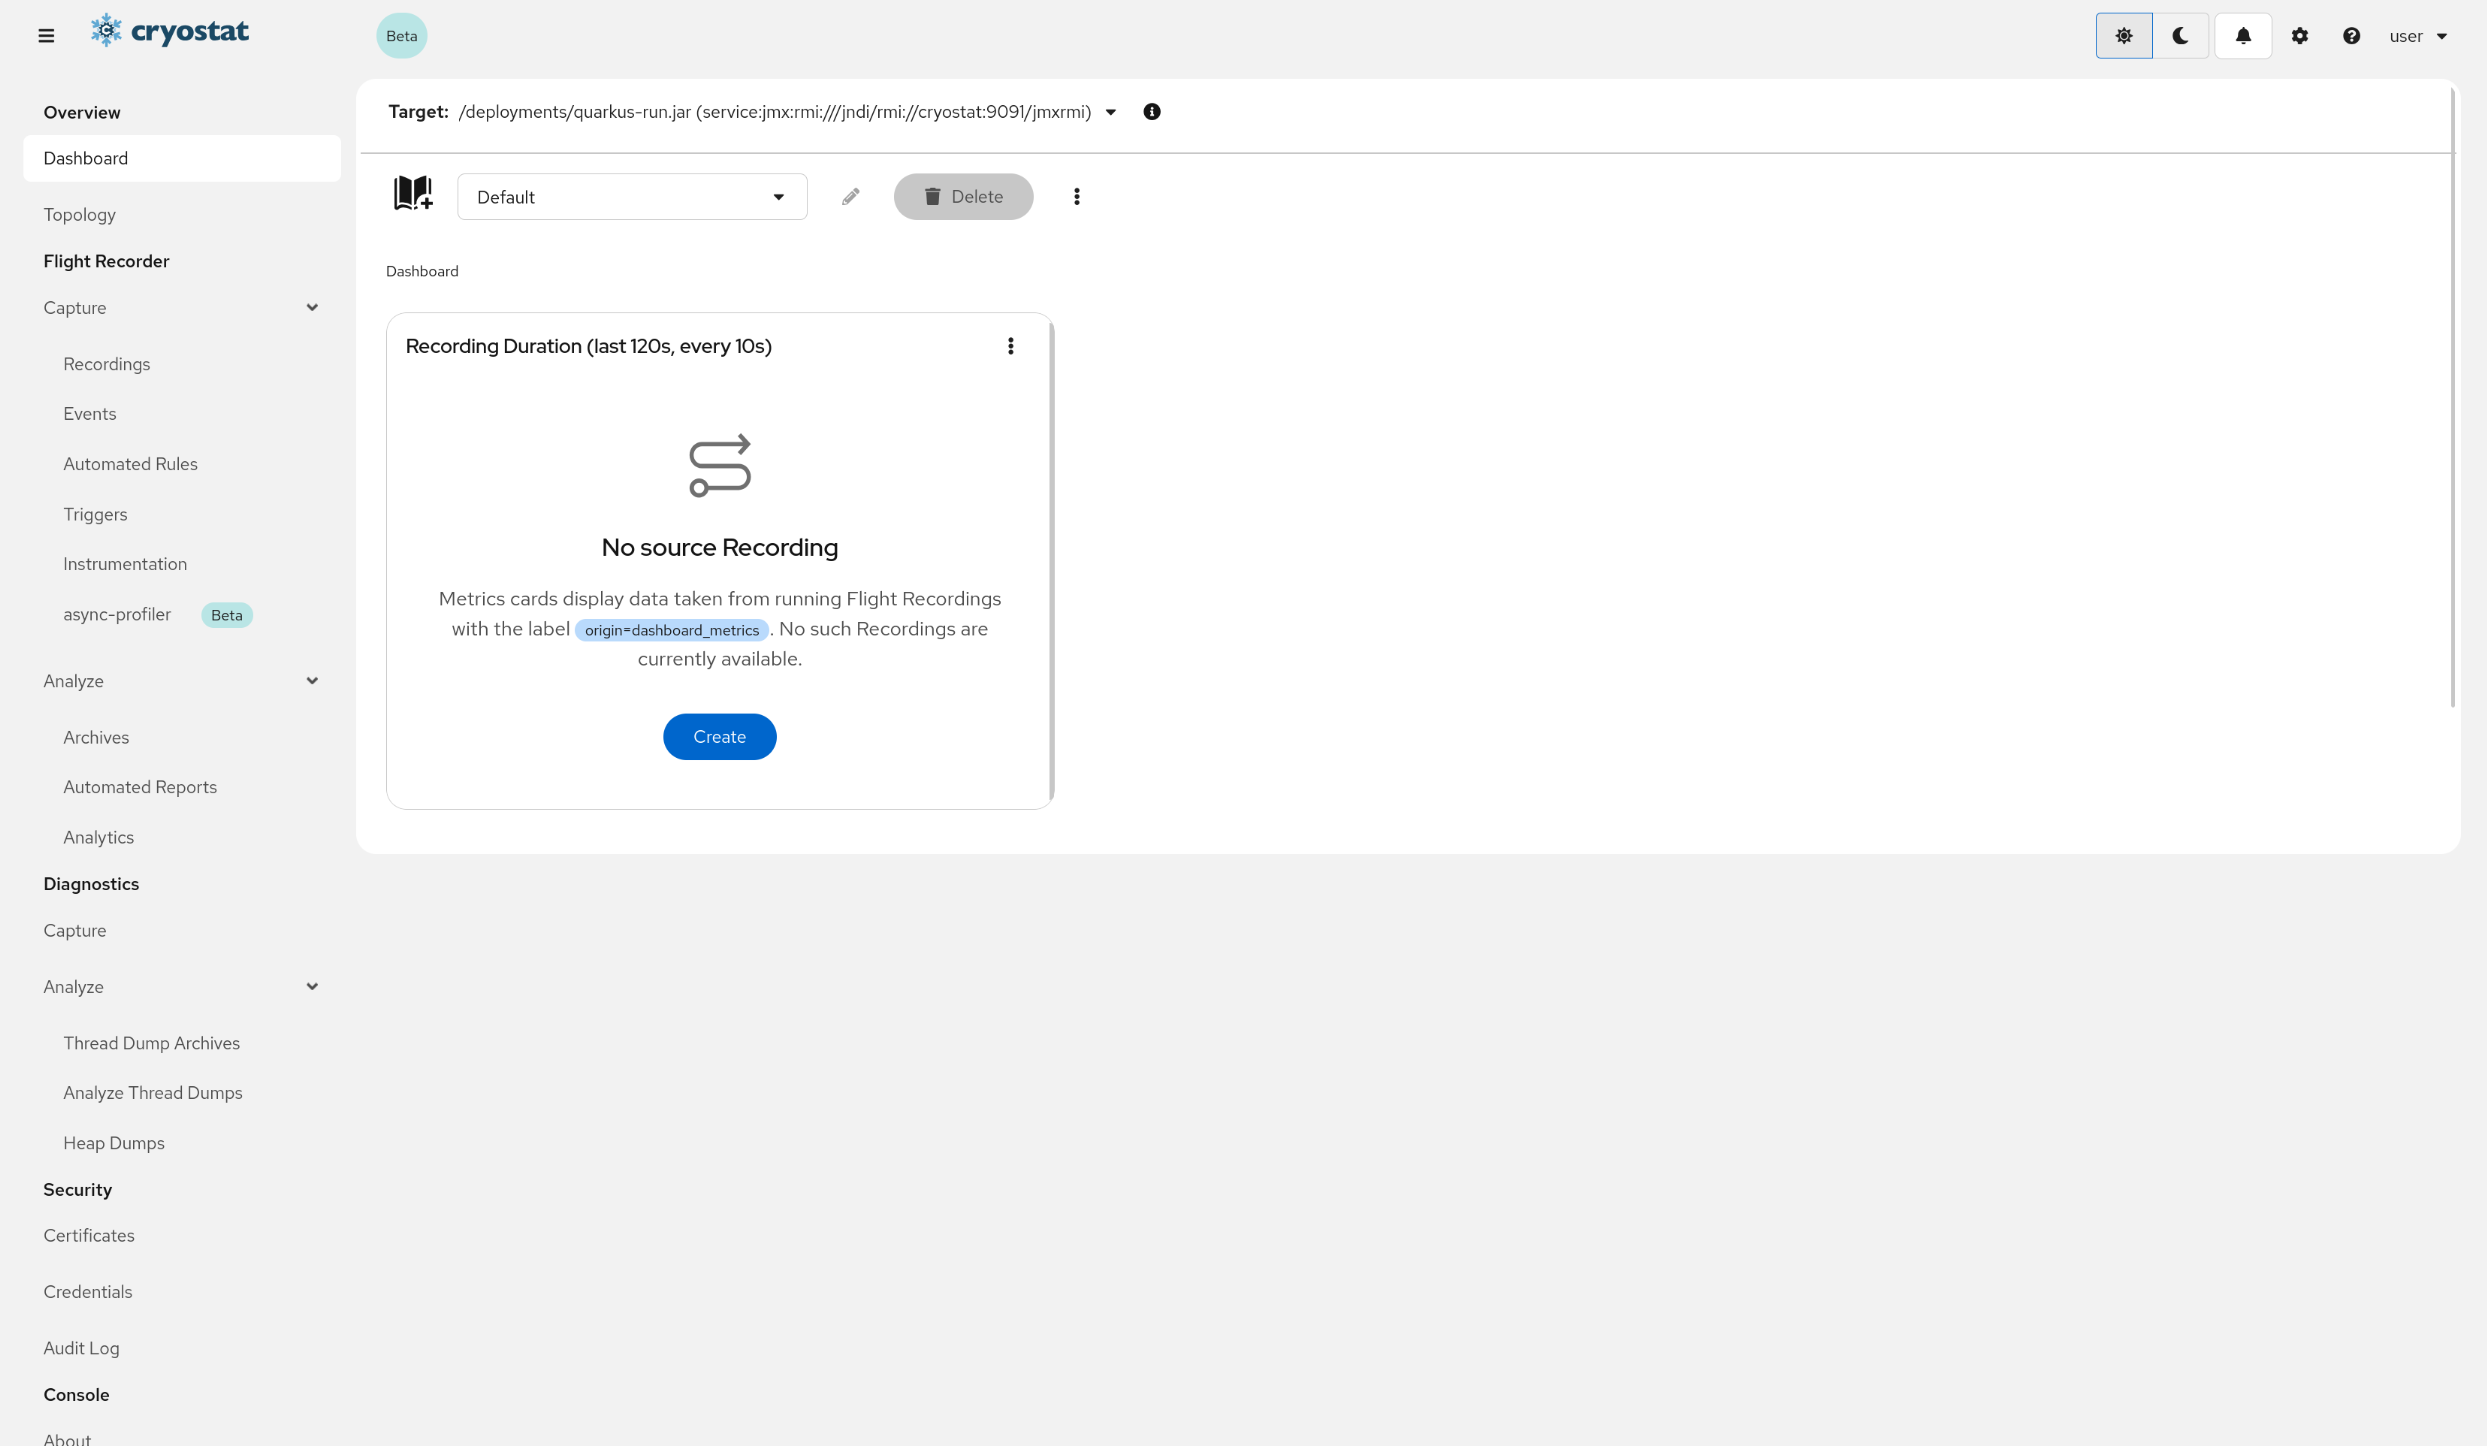
Finish Card CreationThe JFR Metrics Chartcard created with no source recording.
After clicking Finish, the card will be added to the dashboard. Initially the card will have no source Recording and display no data.
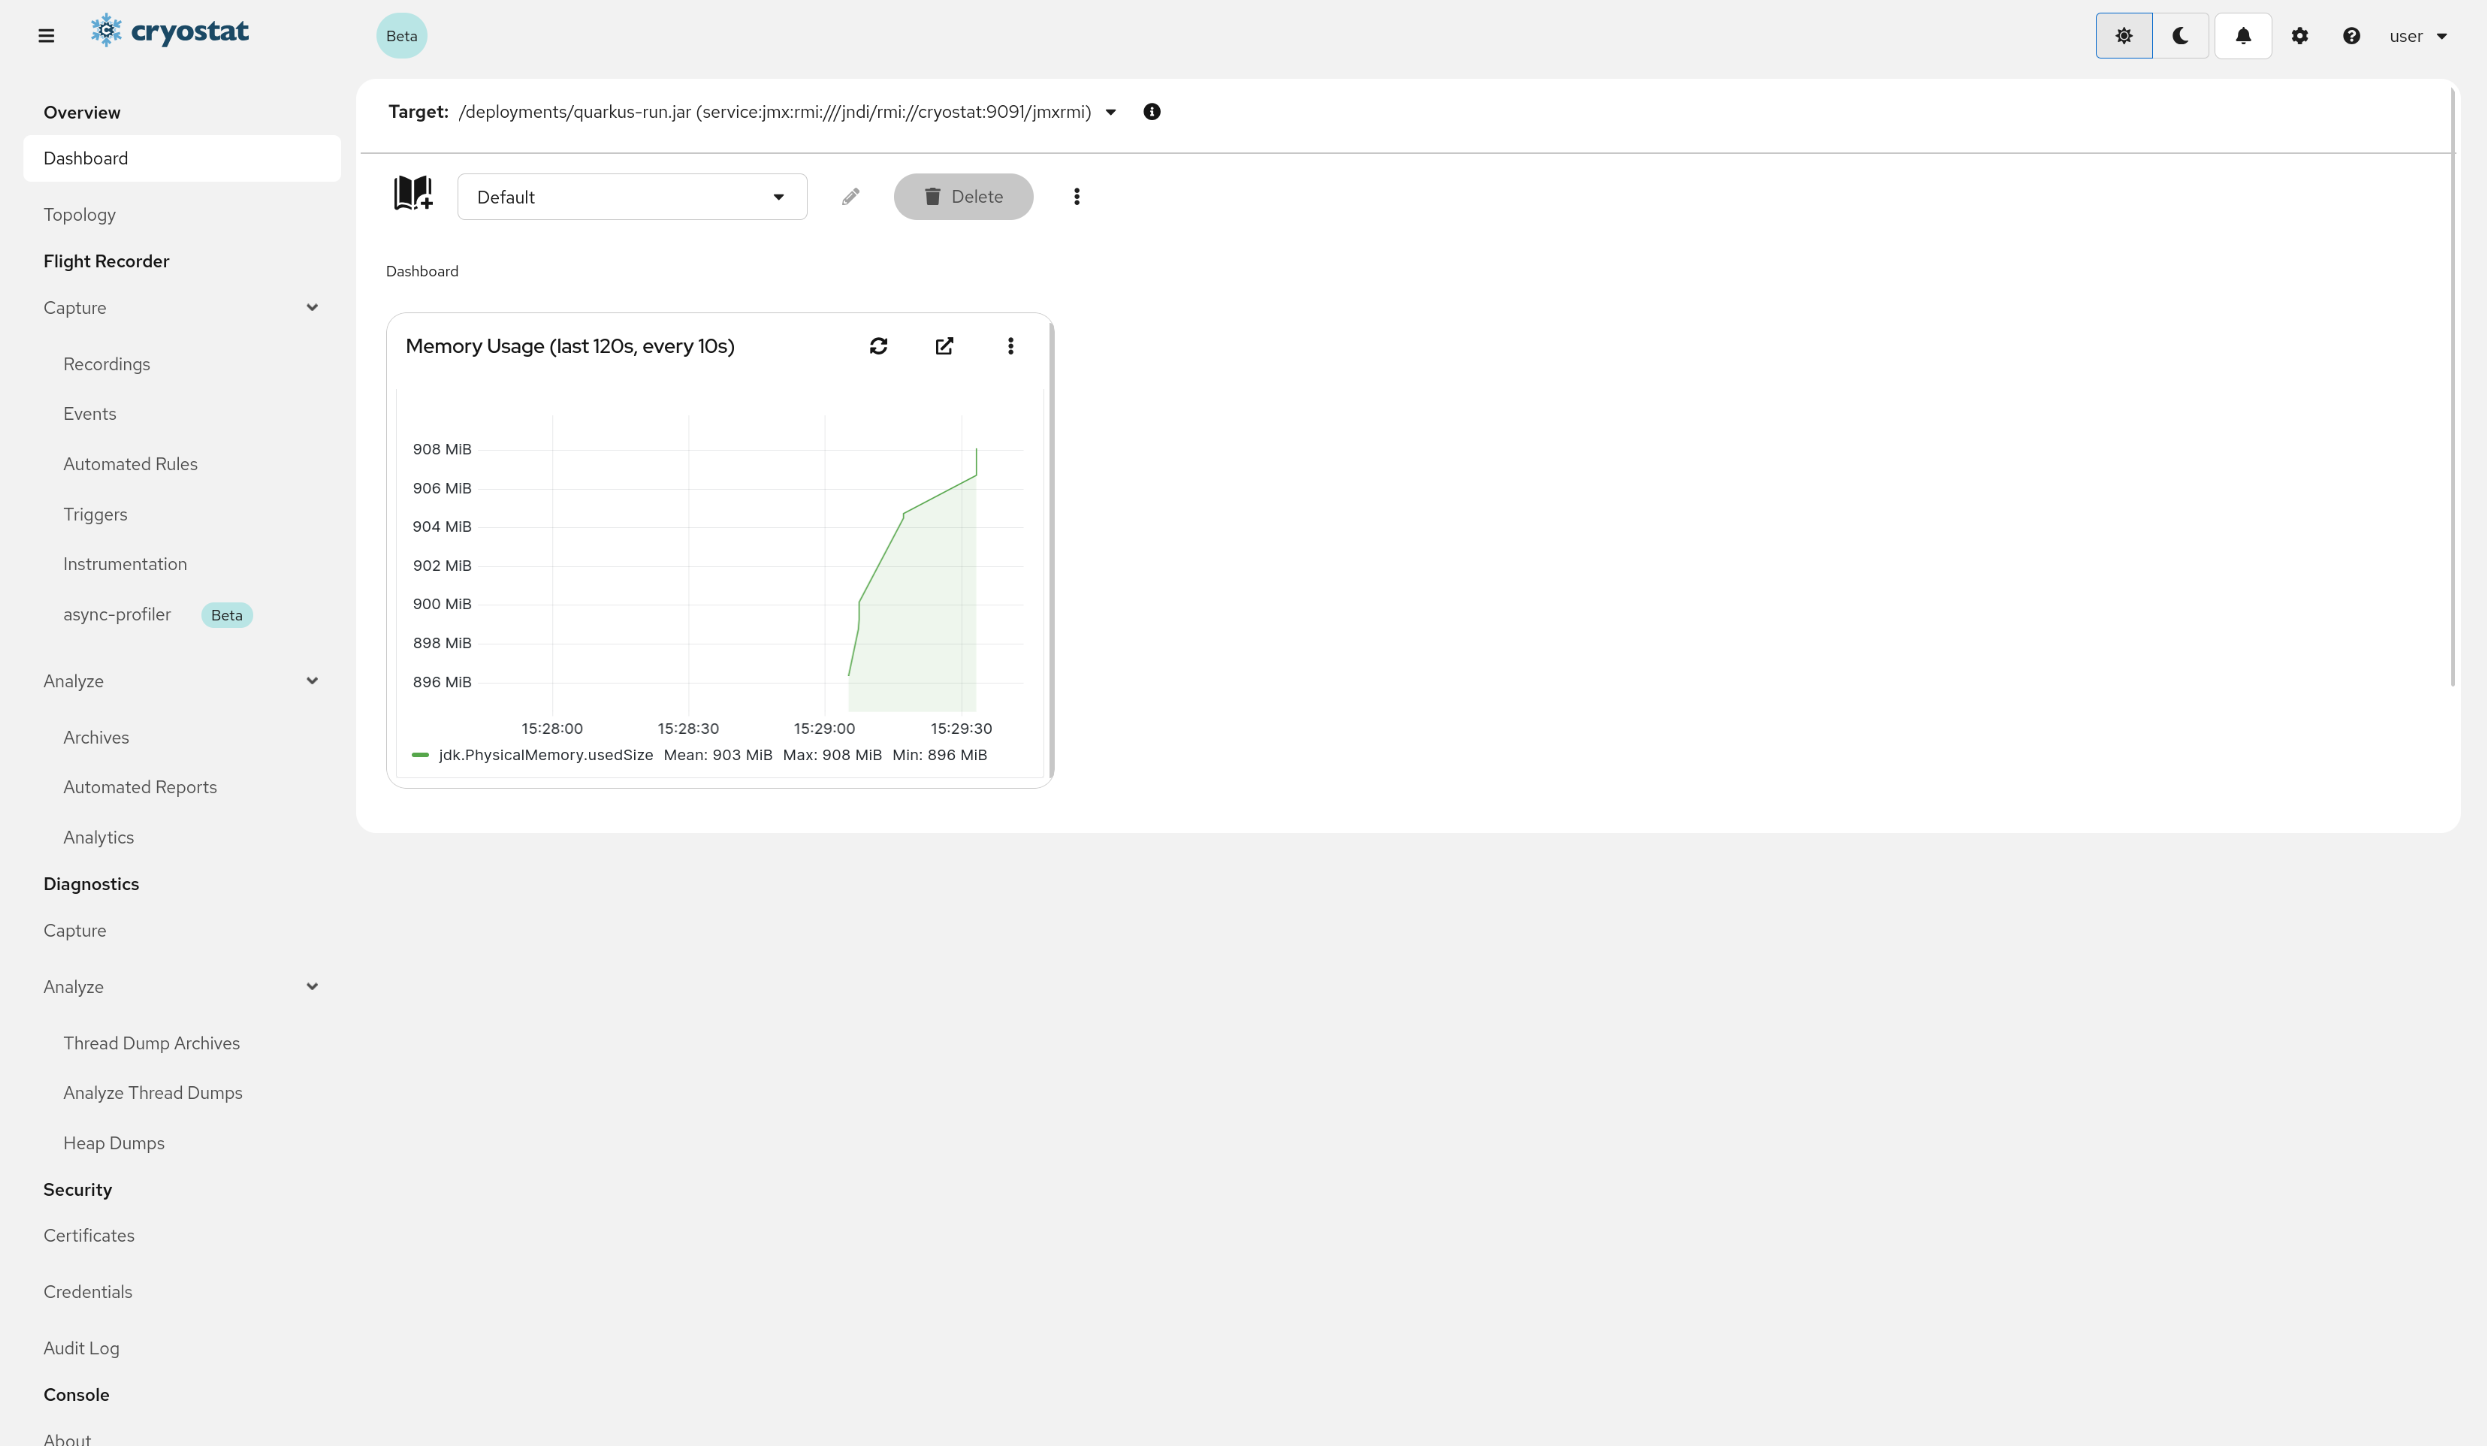
Start source Flight RecordingThe JFR Metrics Chartcard displayed with the Memory Usage metric.
Click Create on the card to create a source Recording. Cryostat will walk you through creating the Recording. You can simply click through the form and accept the suggested default settings. This will begin a Flight Recording on the selected Target and send you to the Recordings view. Once you return to the Dashboard and the recording is available then Cryostat will begin to process and update the Recording to update the card visualization.
The Dashboard is highly customizable and can be configured to display the cards you want to see. You can customize the layout of the cards on the dashboard by Moving, Resizing, and Removingcards.
Add a Card to the DashboardOpen the card catalog by clicking the Catalog icon on the Dashboard toolbar.
Let's add the Target JVM Detailscard.
Resize the CardClick and drag the right edge of the card to resize it.
Add another Card to the DashboardOpen the card catalog by clicking the Catalog icon on the Dashboard toolbar.
Let's add the MBean Metrics Chartcard this time.
Rearrange CardsClick and drag the Target JVM Detailscard's header on top or to the right of the MBeans Metrics Chartcard to swap their positions.
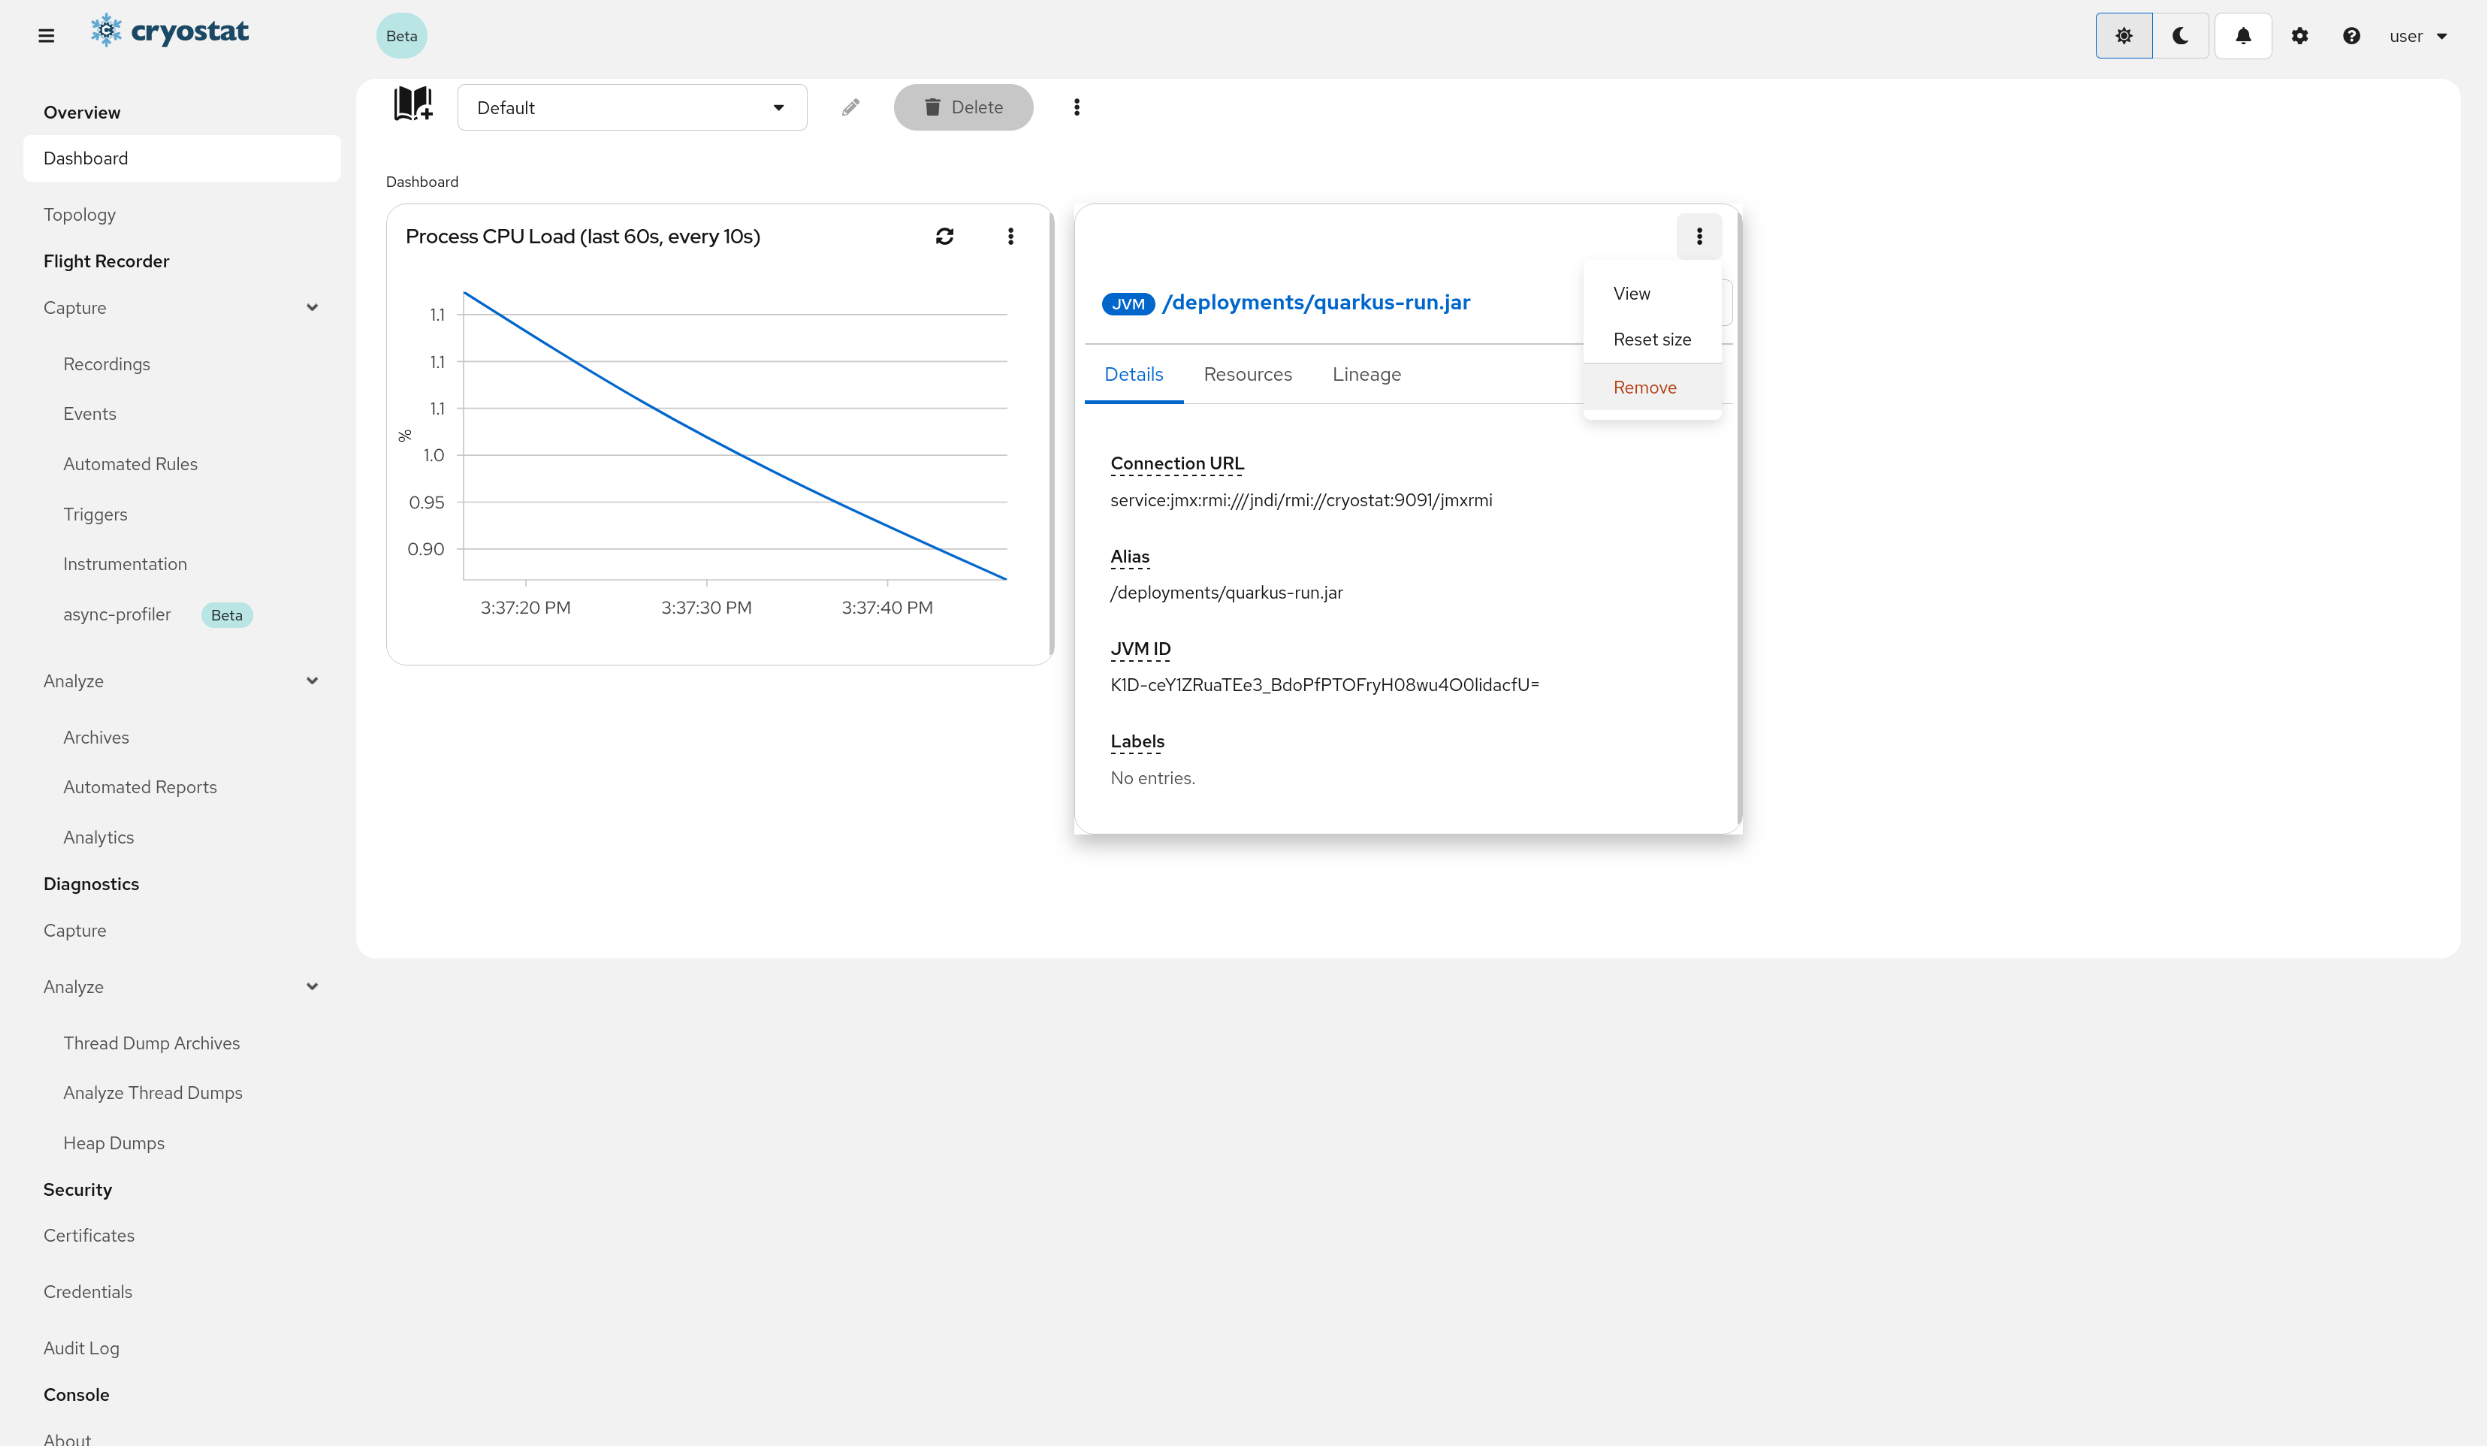
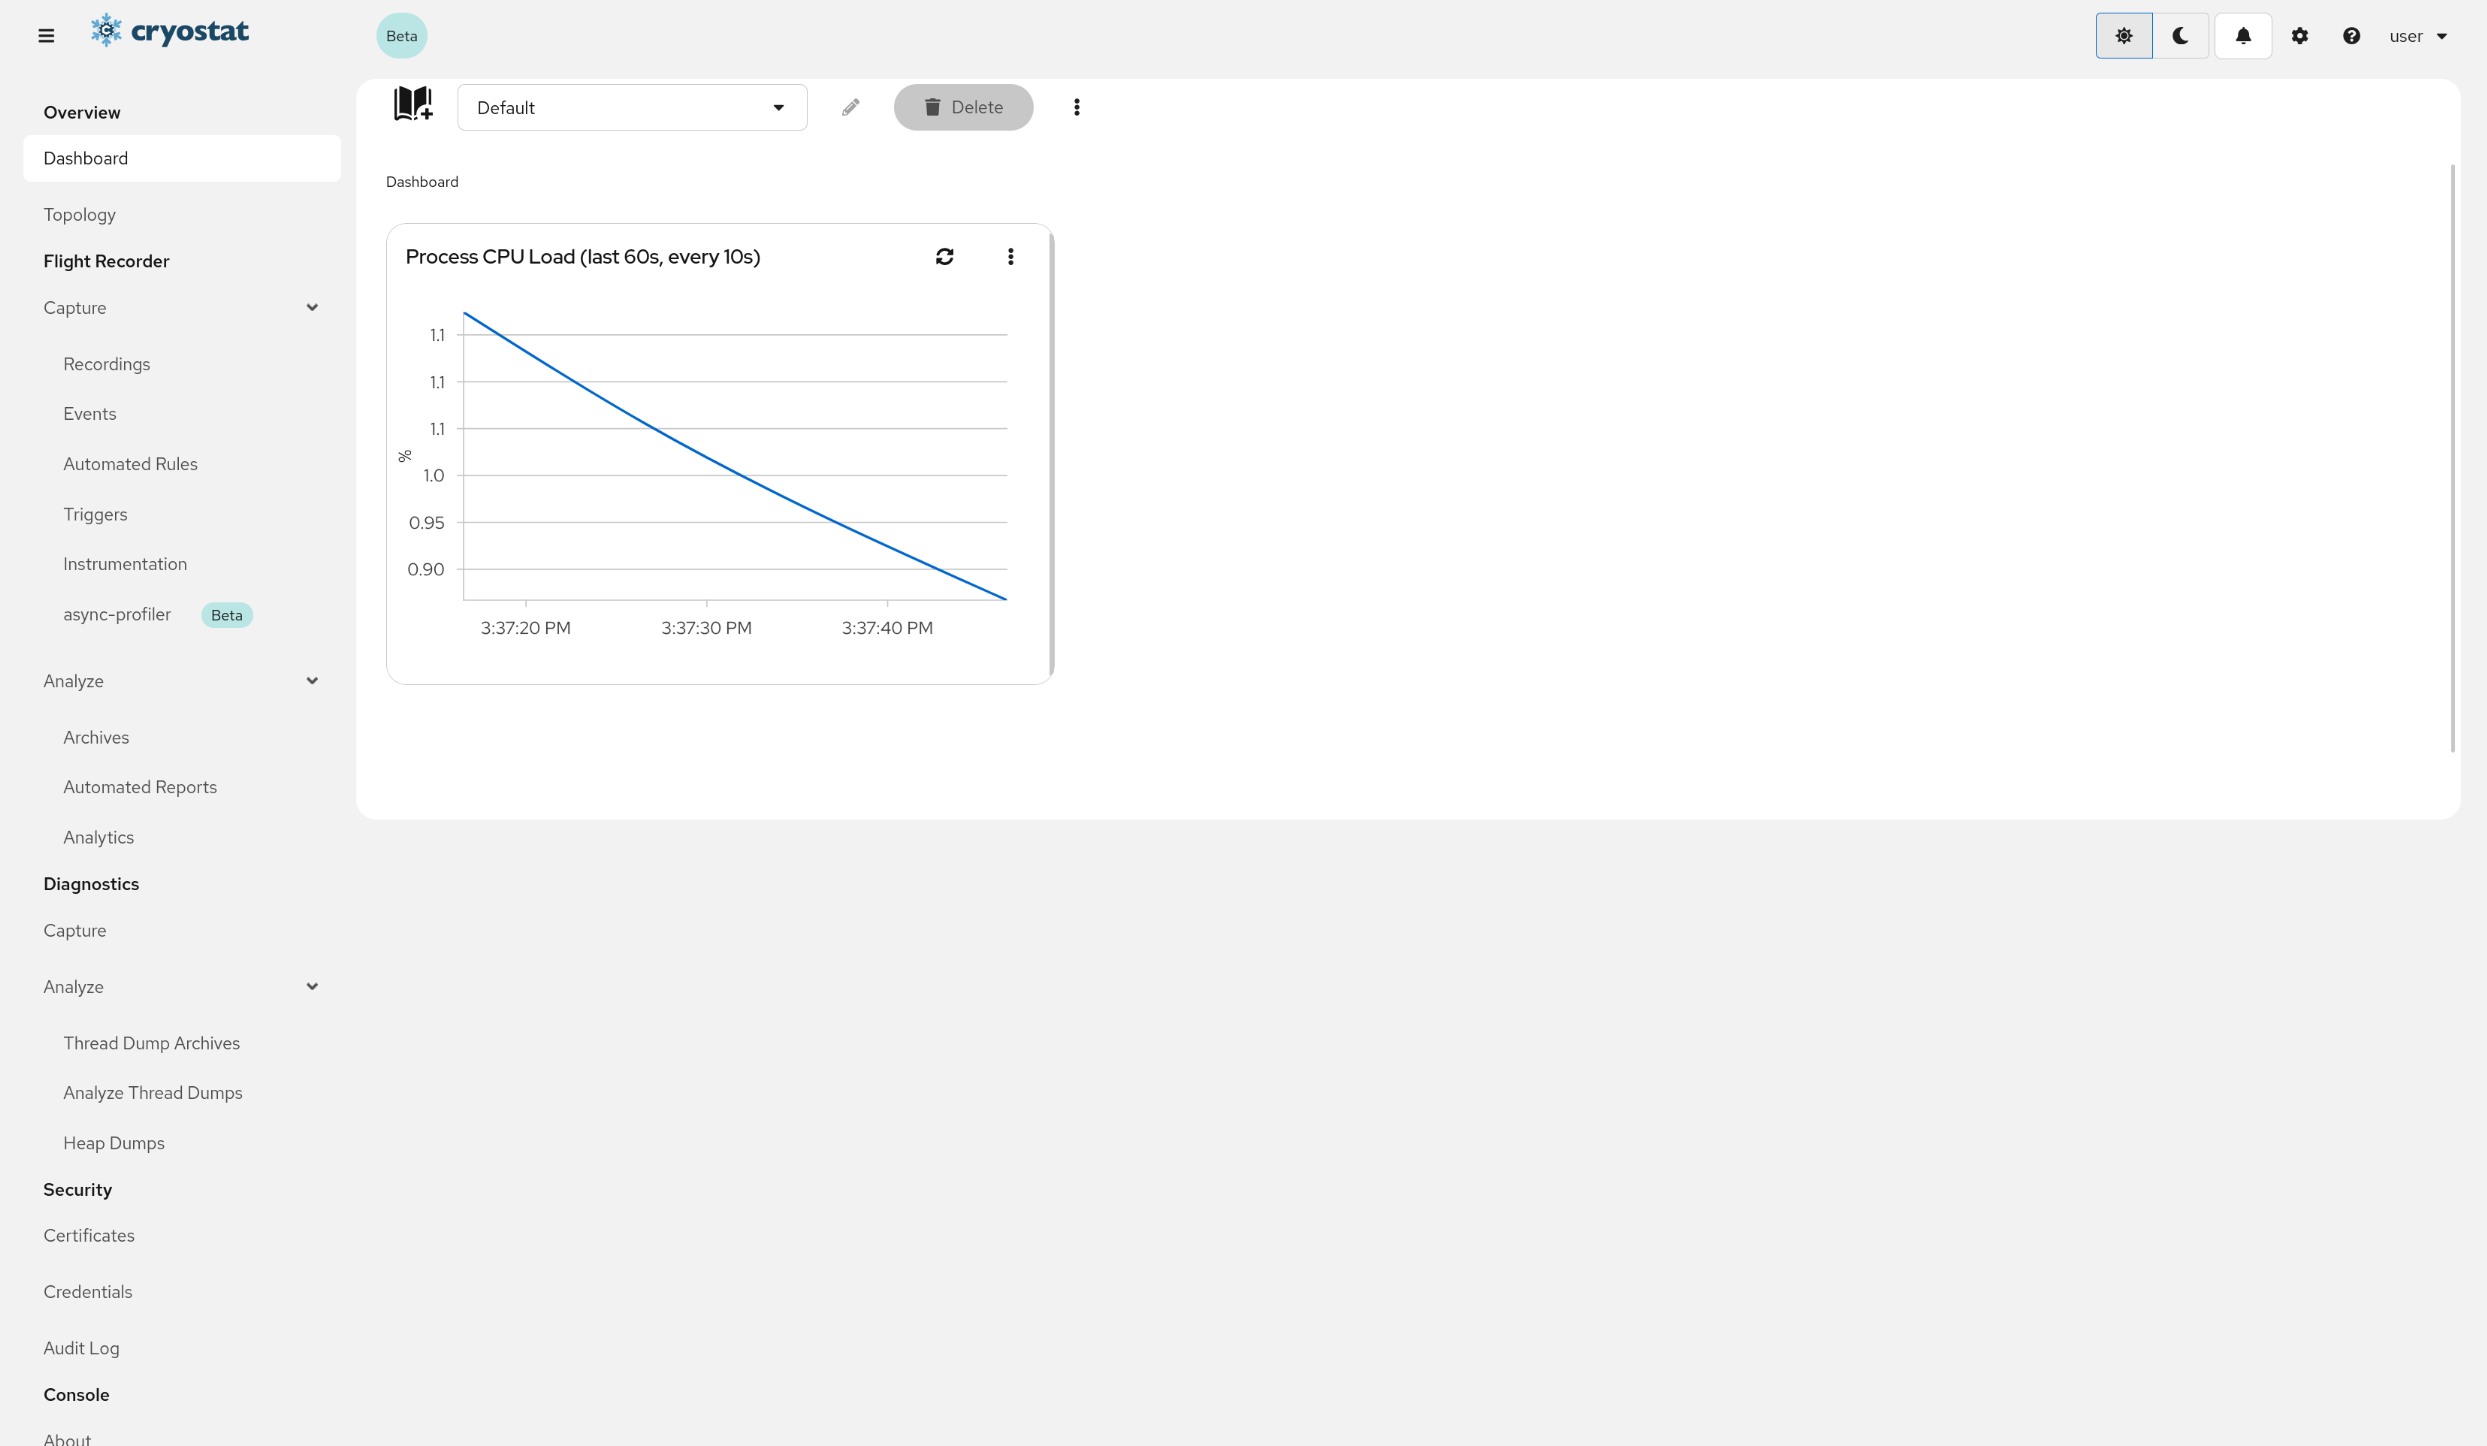
Remove CardsClick the Kebab icon on the card header to open the card actions menu.
Each card header contains a kebab icon that opens a menu of card actions. The actions menu contains the following options:
Dashboard Layouts are a way to organize your dashboard cards into different views. You can create multiple layouts and switch between them to view different cards. Favorite, Rename, and Delete layouts to customize your dashboard.
By default, the Default layout is created for you. This layout contains the cards three MBean Metrics Chartcards. You can modify this layout’s card configuration, but you cannot Rename or Delete it.
Layout Templates save your layouts for later use. You can Create a template from a layout, and then use that template to Create a new layout with the same cards. You can also Import and Export templates to share them with other Cryostat users.
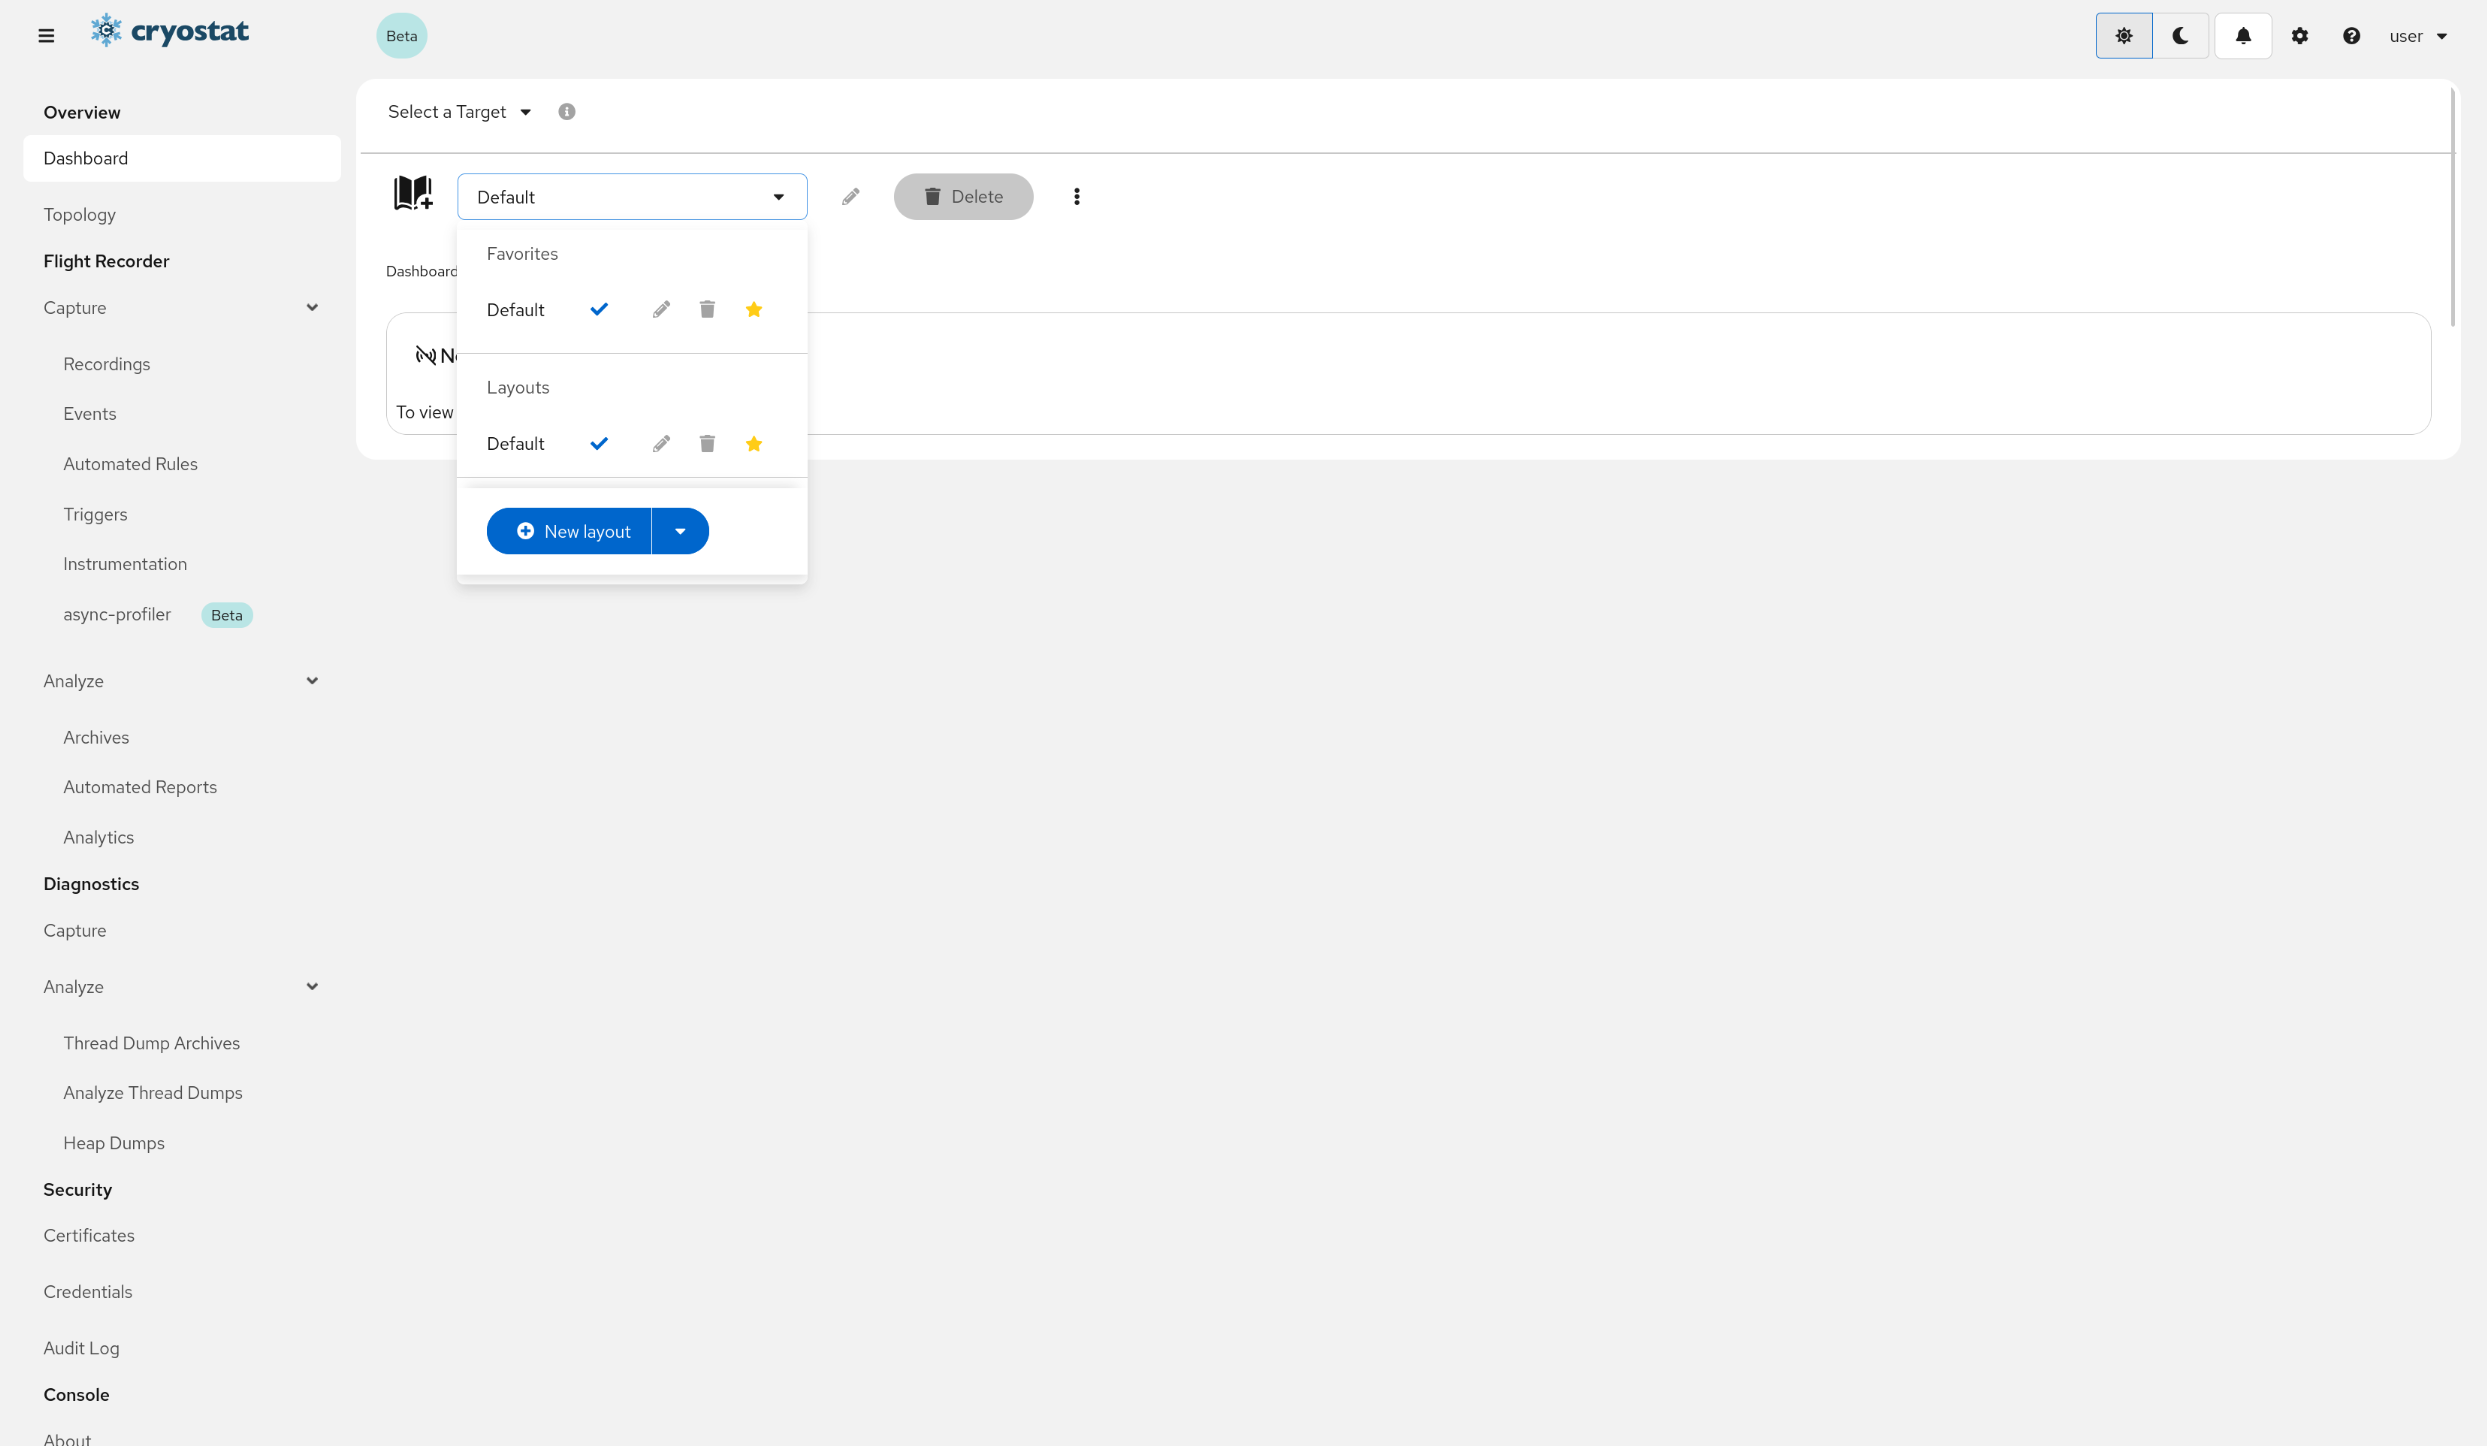
Open the Layout Selector DropdownClick the layout selector dropdown to view the available layouts.
The Layout Selector contains a list of all available layouts. The currently selected layout is indicated with a check mark "✓".
Click New Layout
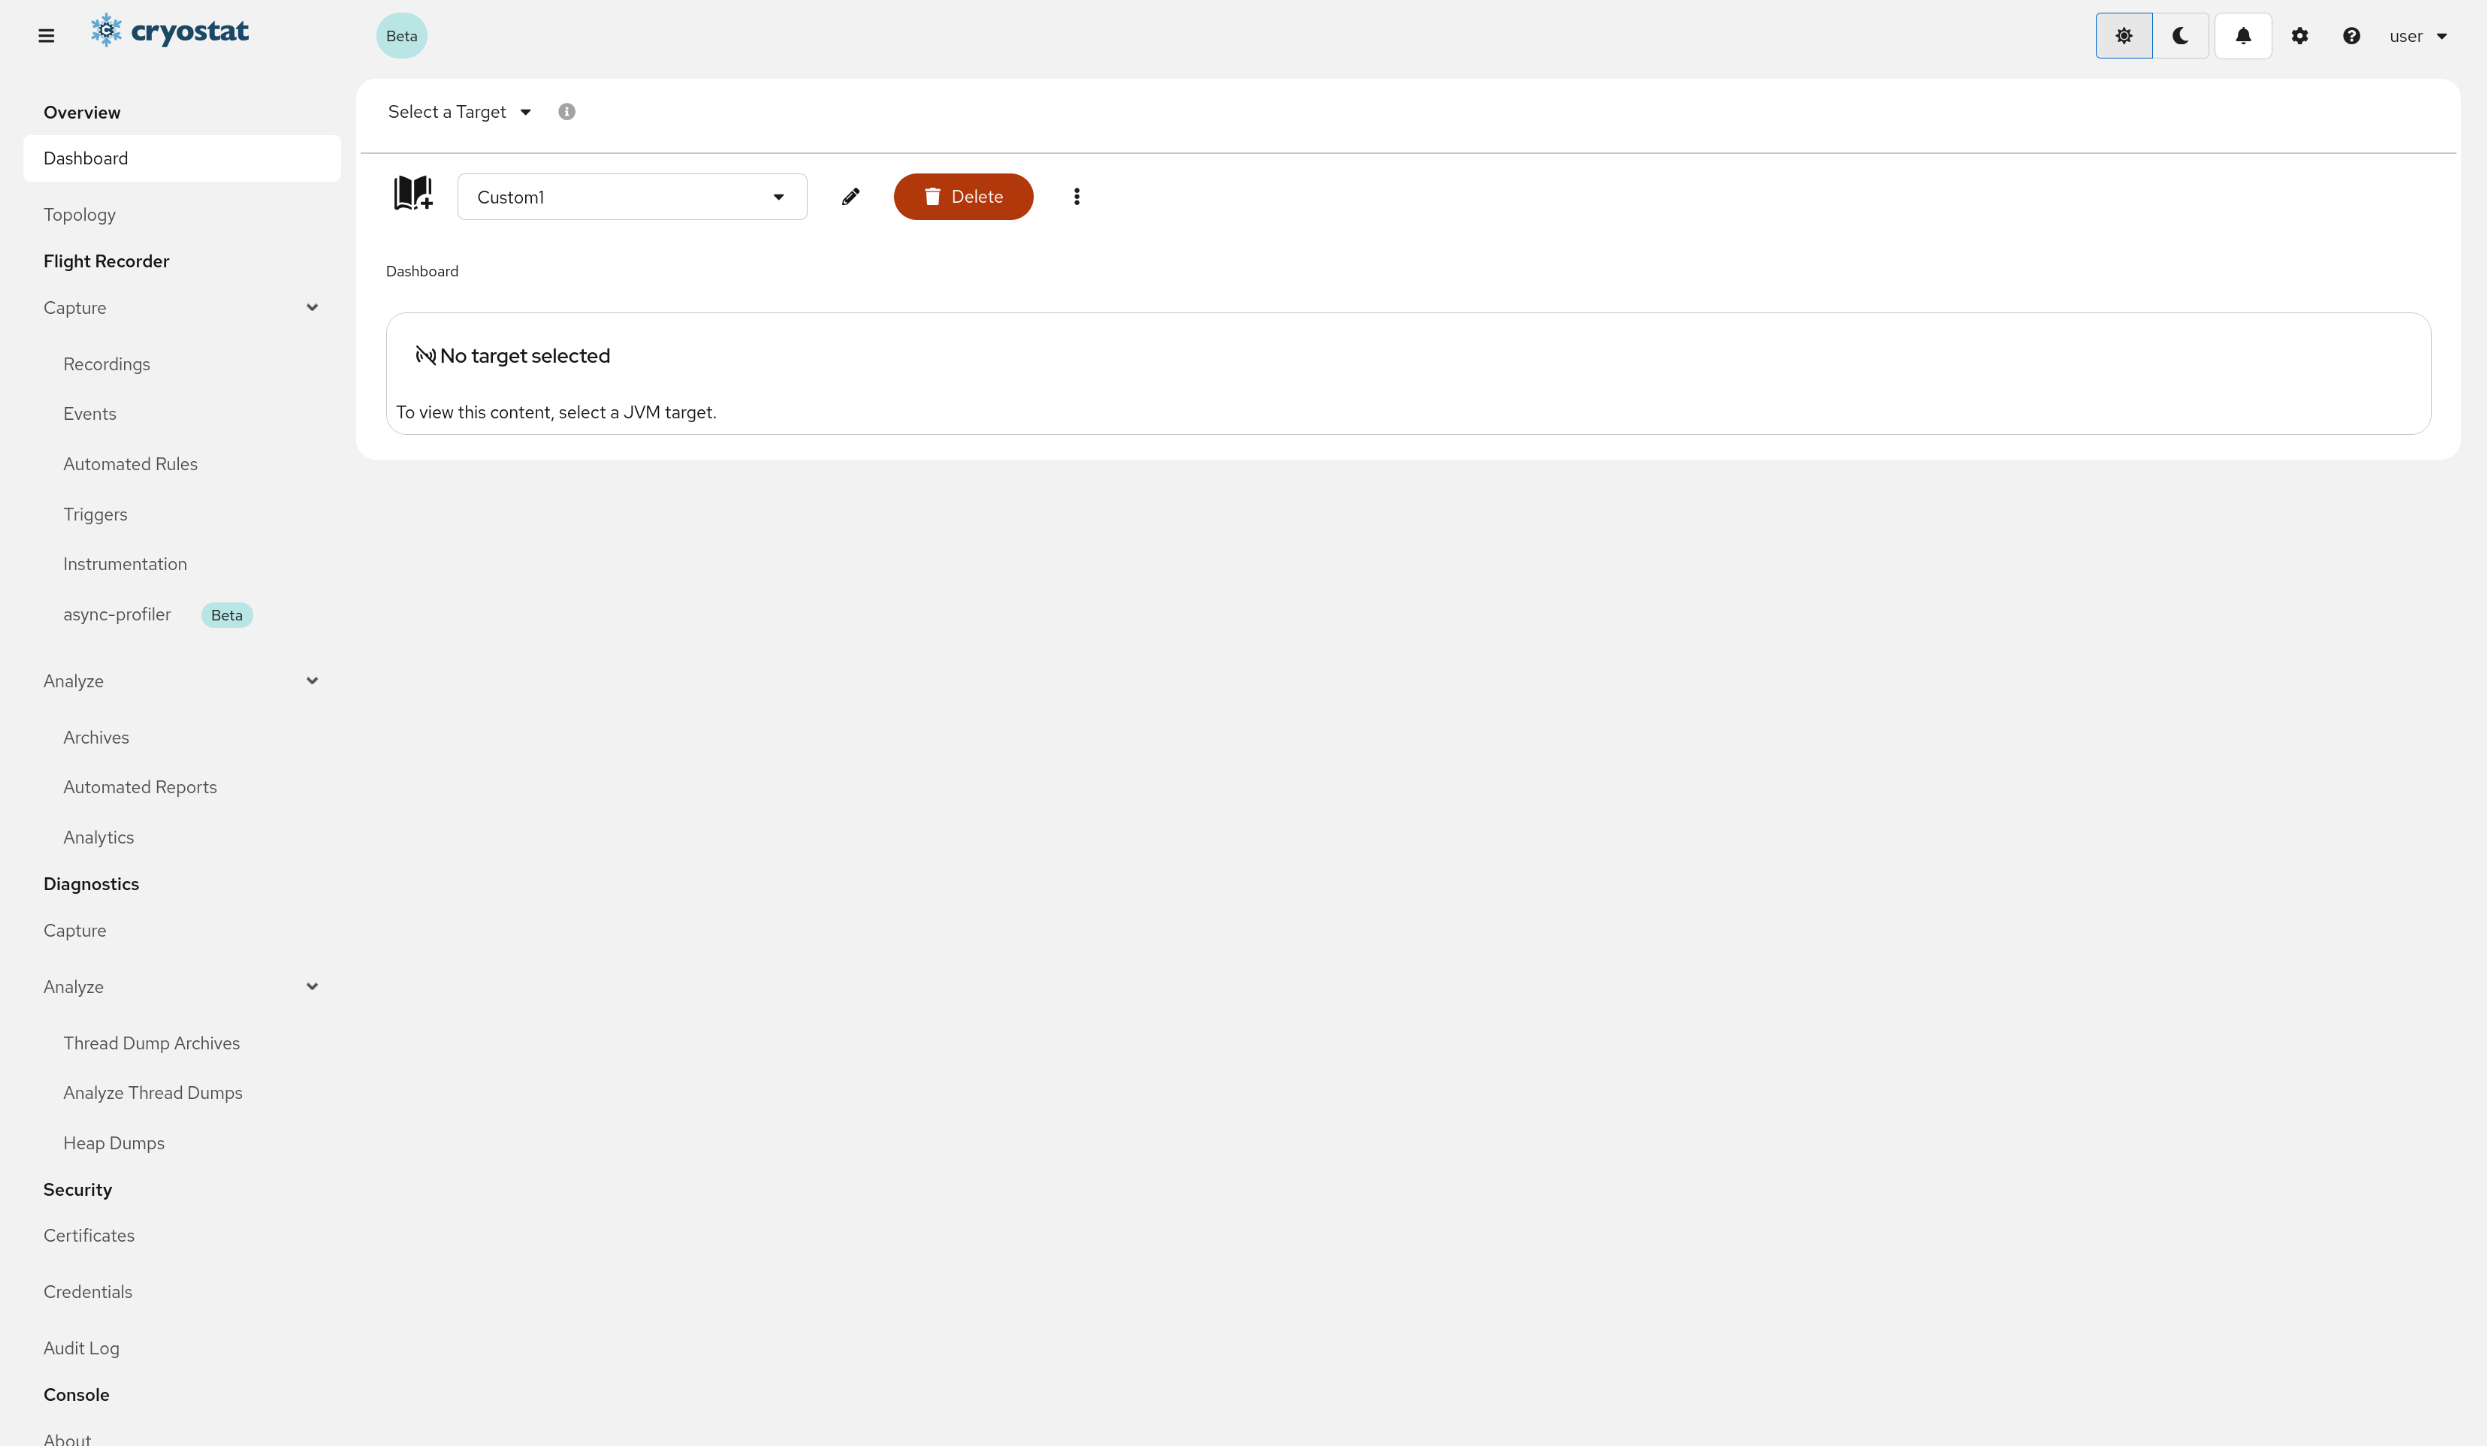
Clicking New Layout will create a new blank layout and switch the dashboard view to the new layout. The layout should be called something like Custom1.
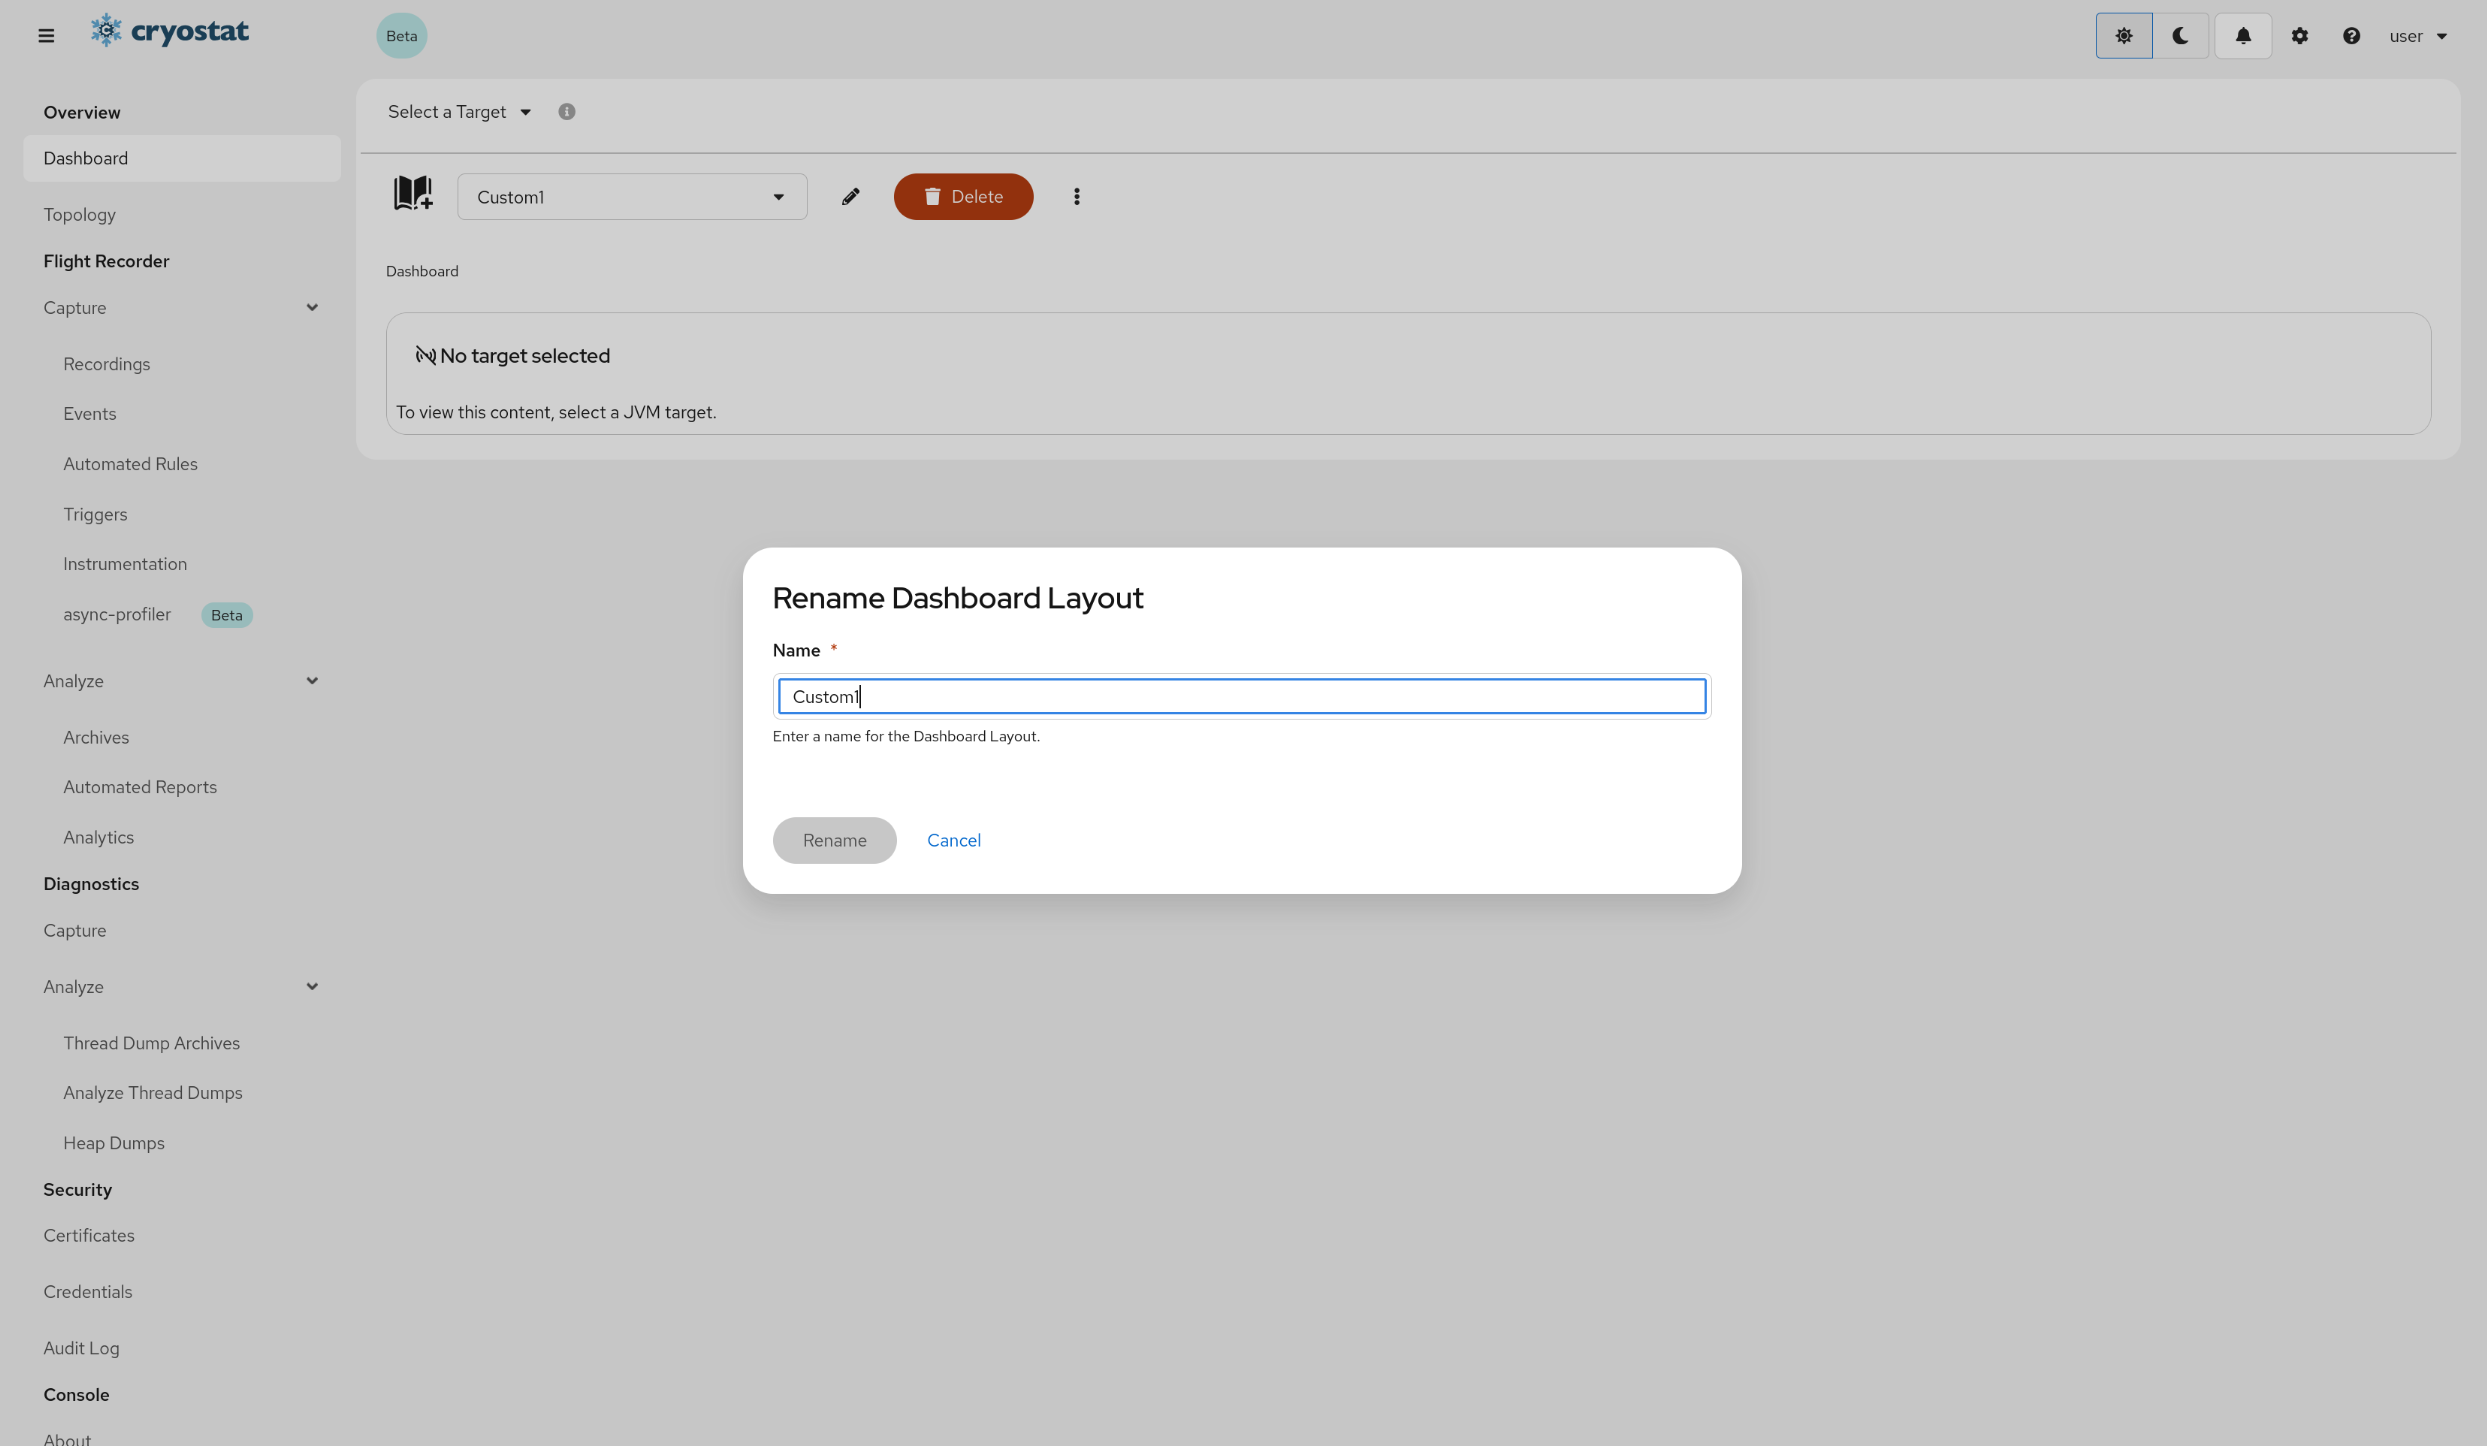
(Optional) Rename LayoutsClick the Pencil button to rename the currently selected layout.
You are able to rename layouts by clicking the Pencil button next to the layout selector. This will rename the currently selected layout. You can also rename layouts within the layout selector dropdown itself.
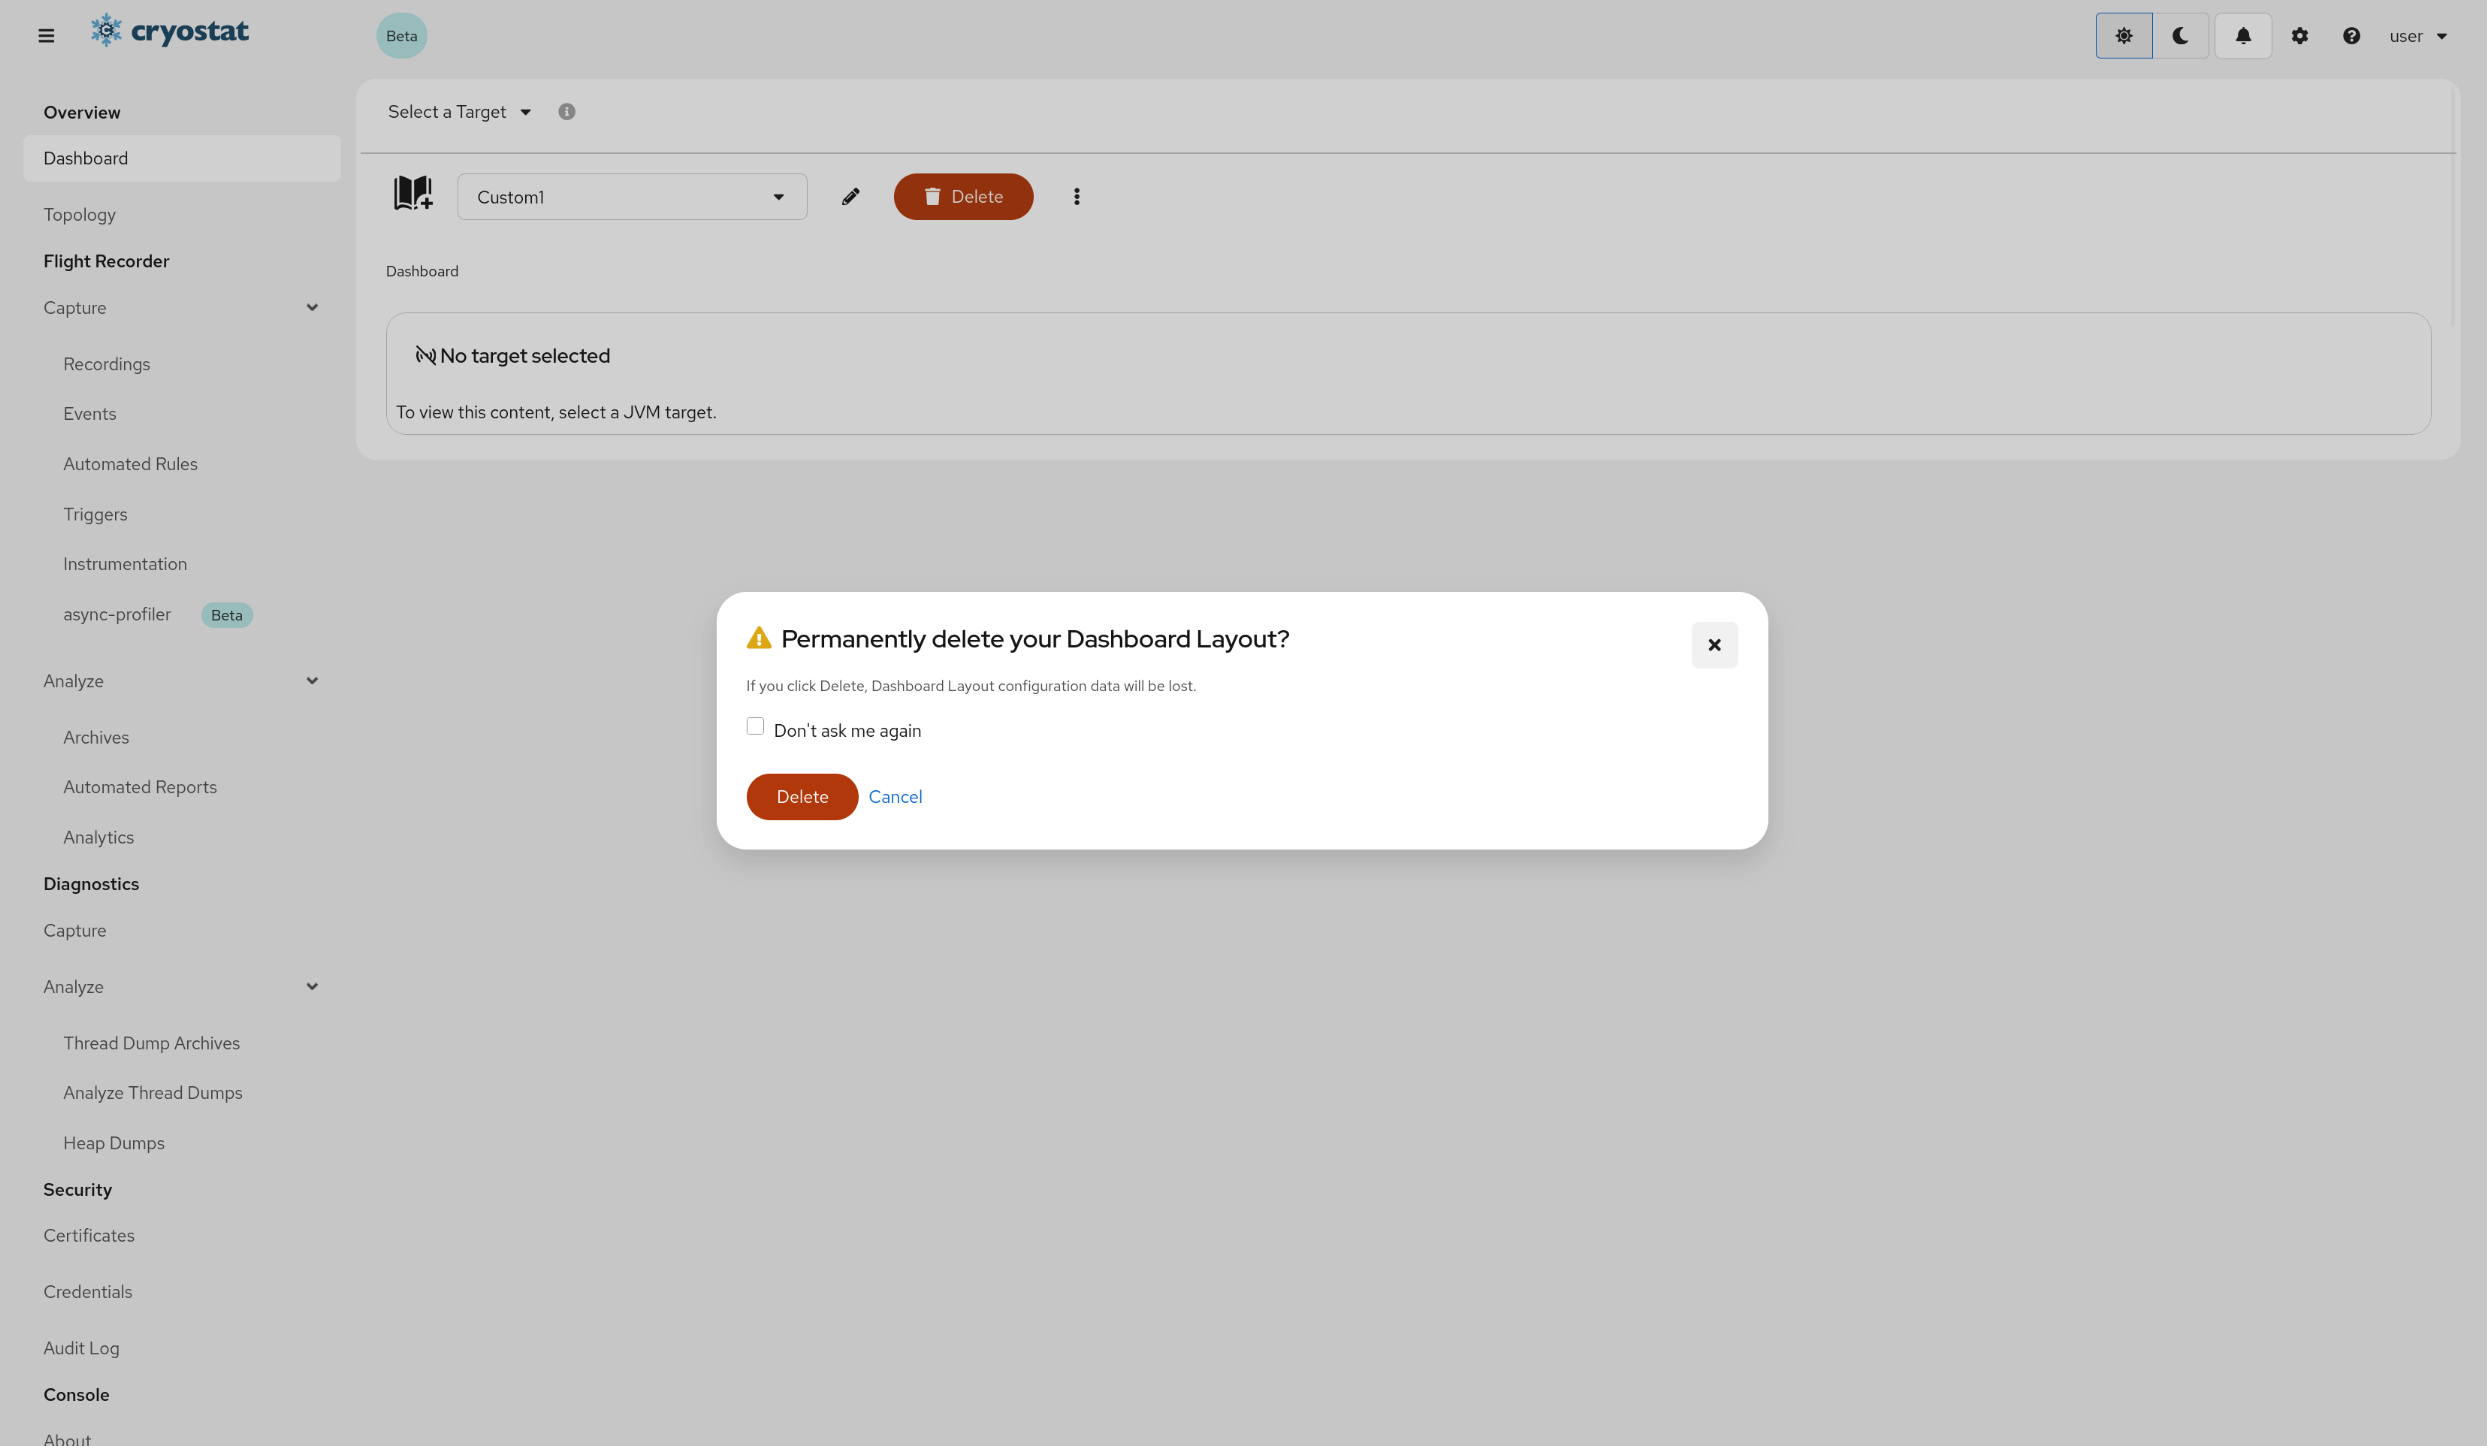
(Optional) Delete LayoutsClick 🗑️ Delete to delete the currently selected layout.
Deletion is similar to renaming. Click the trash can icon with the text Delete next to the layout selector to delete the currently selected layout. You can also delete layouts within the layout selector dropdown itself.
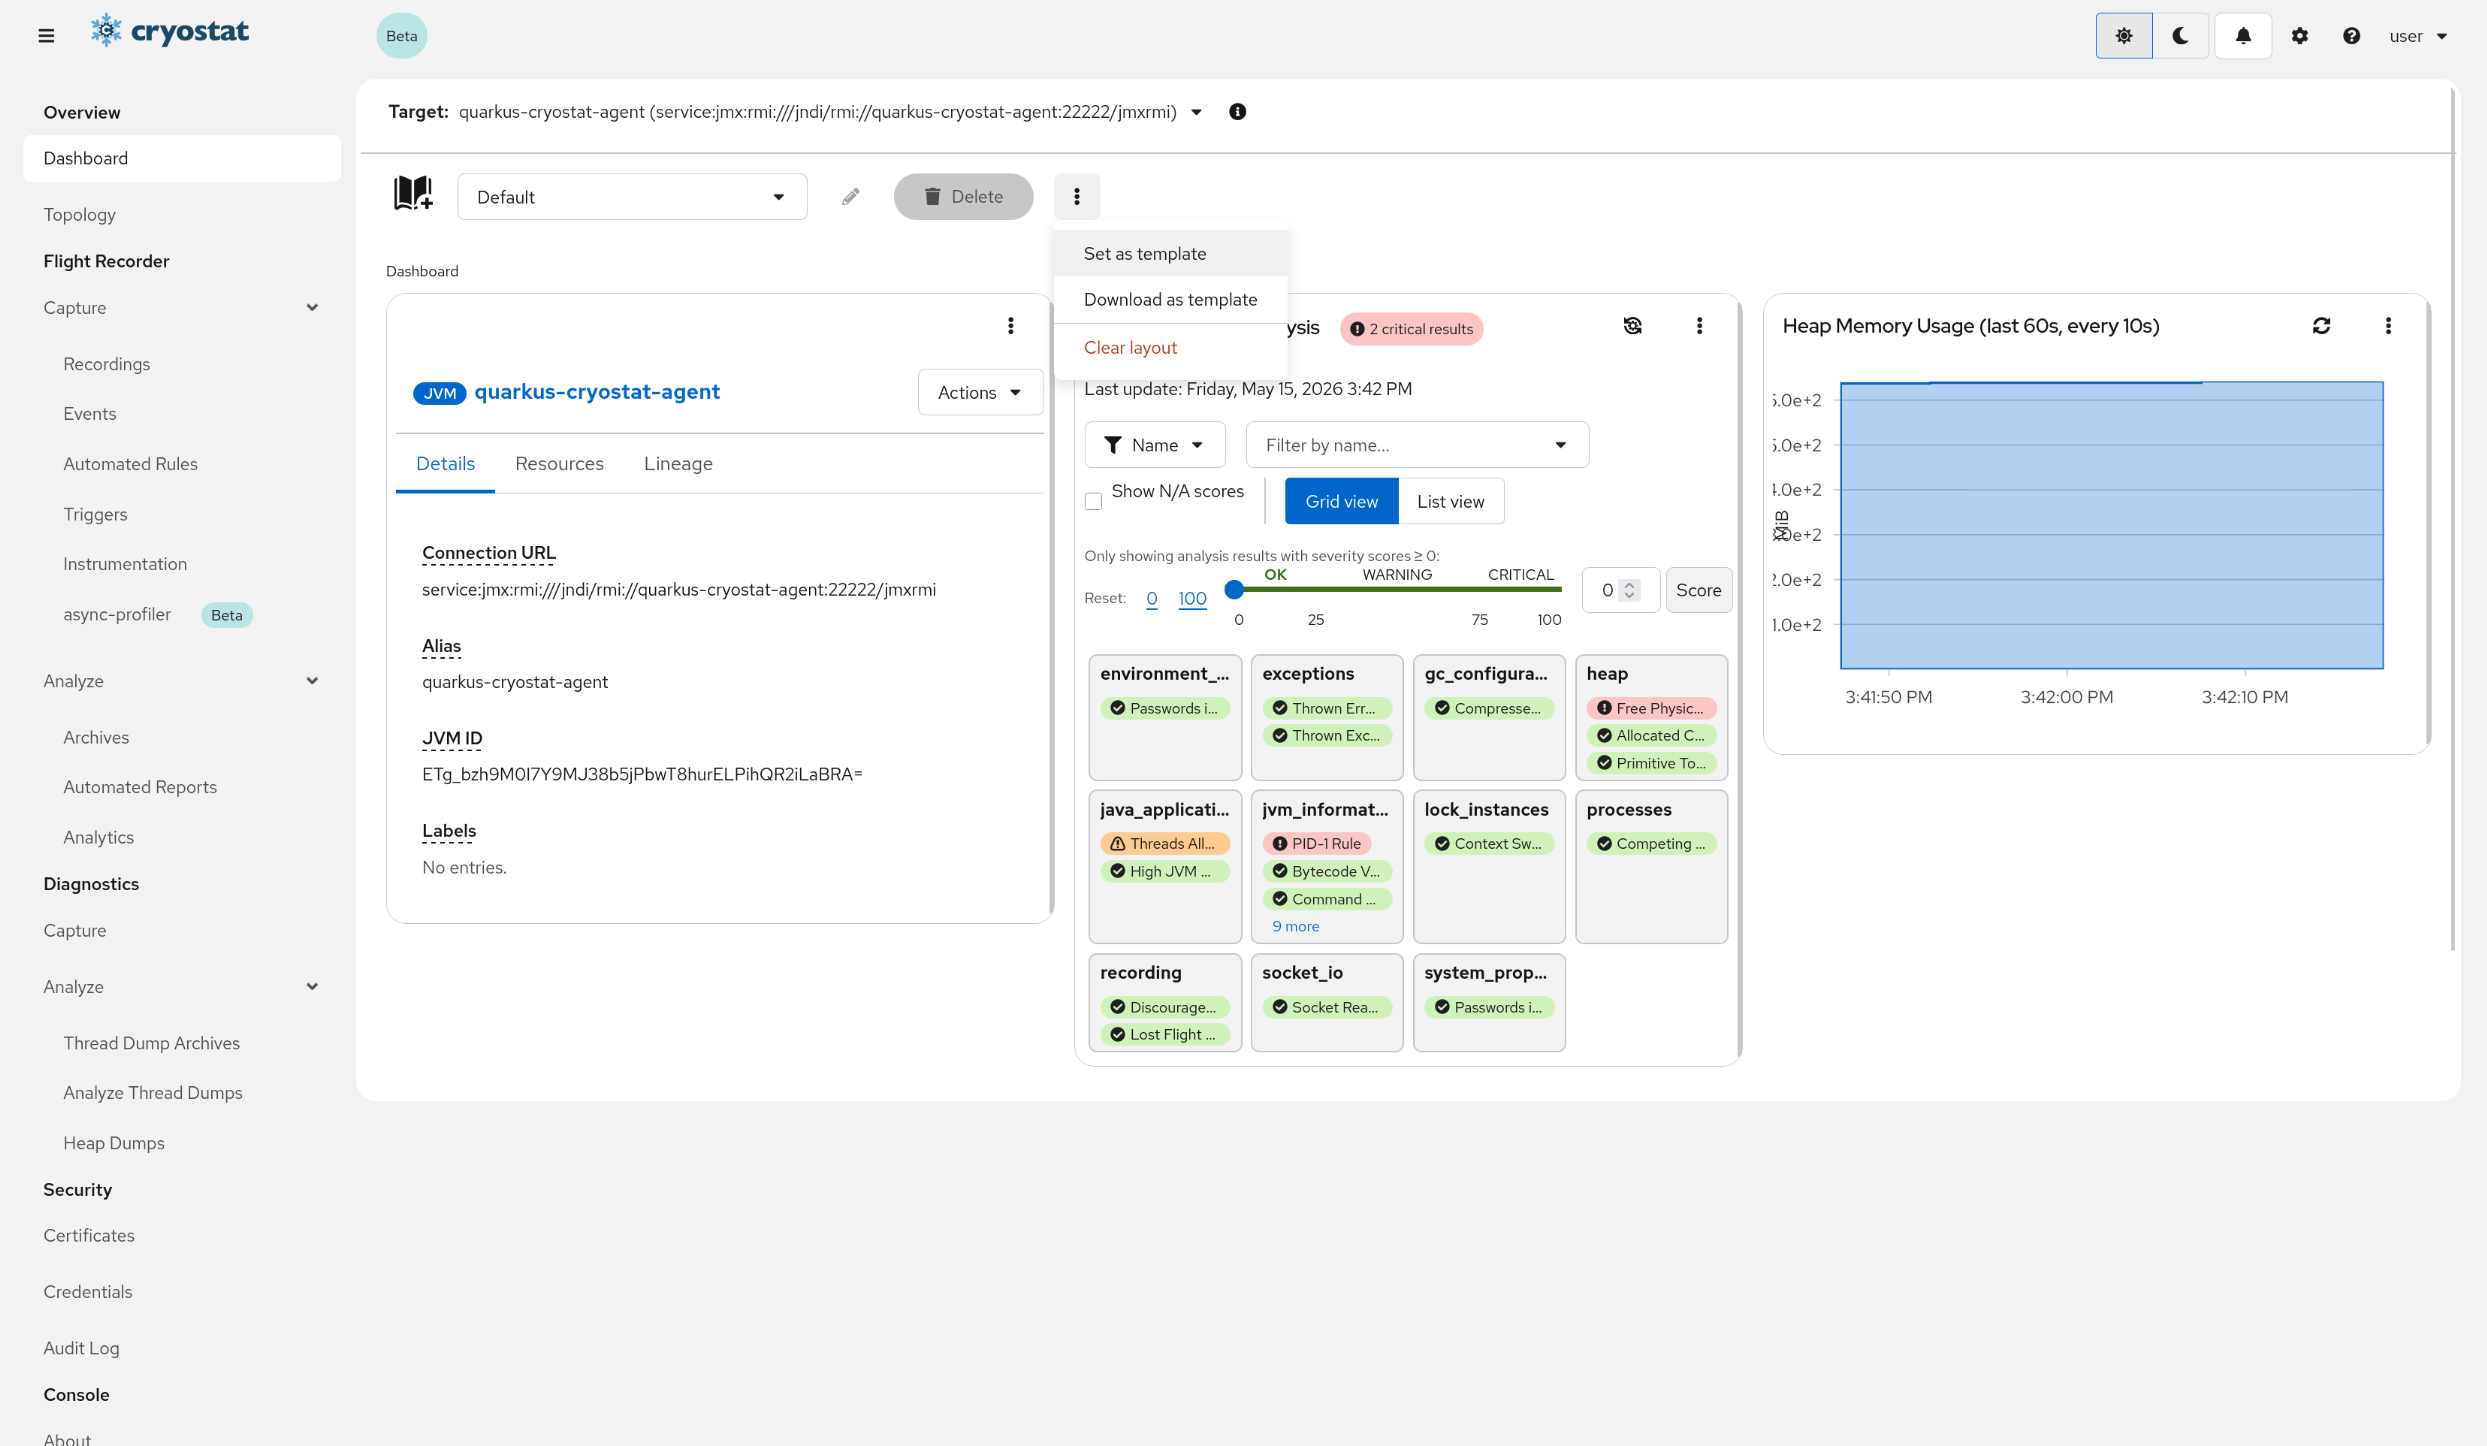
Save a layout as a templateClick more options "⋮" on the dashboard toolbar, then click Set as template to set the desired layout as a template.
The layout template will be saved as a User-submitted template in the template picker.
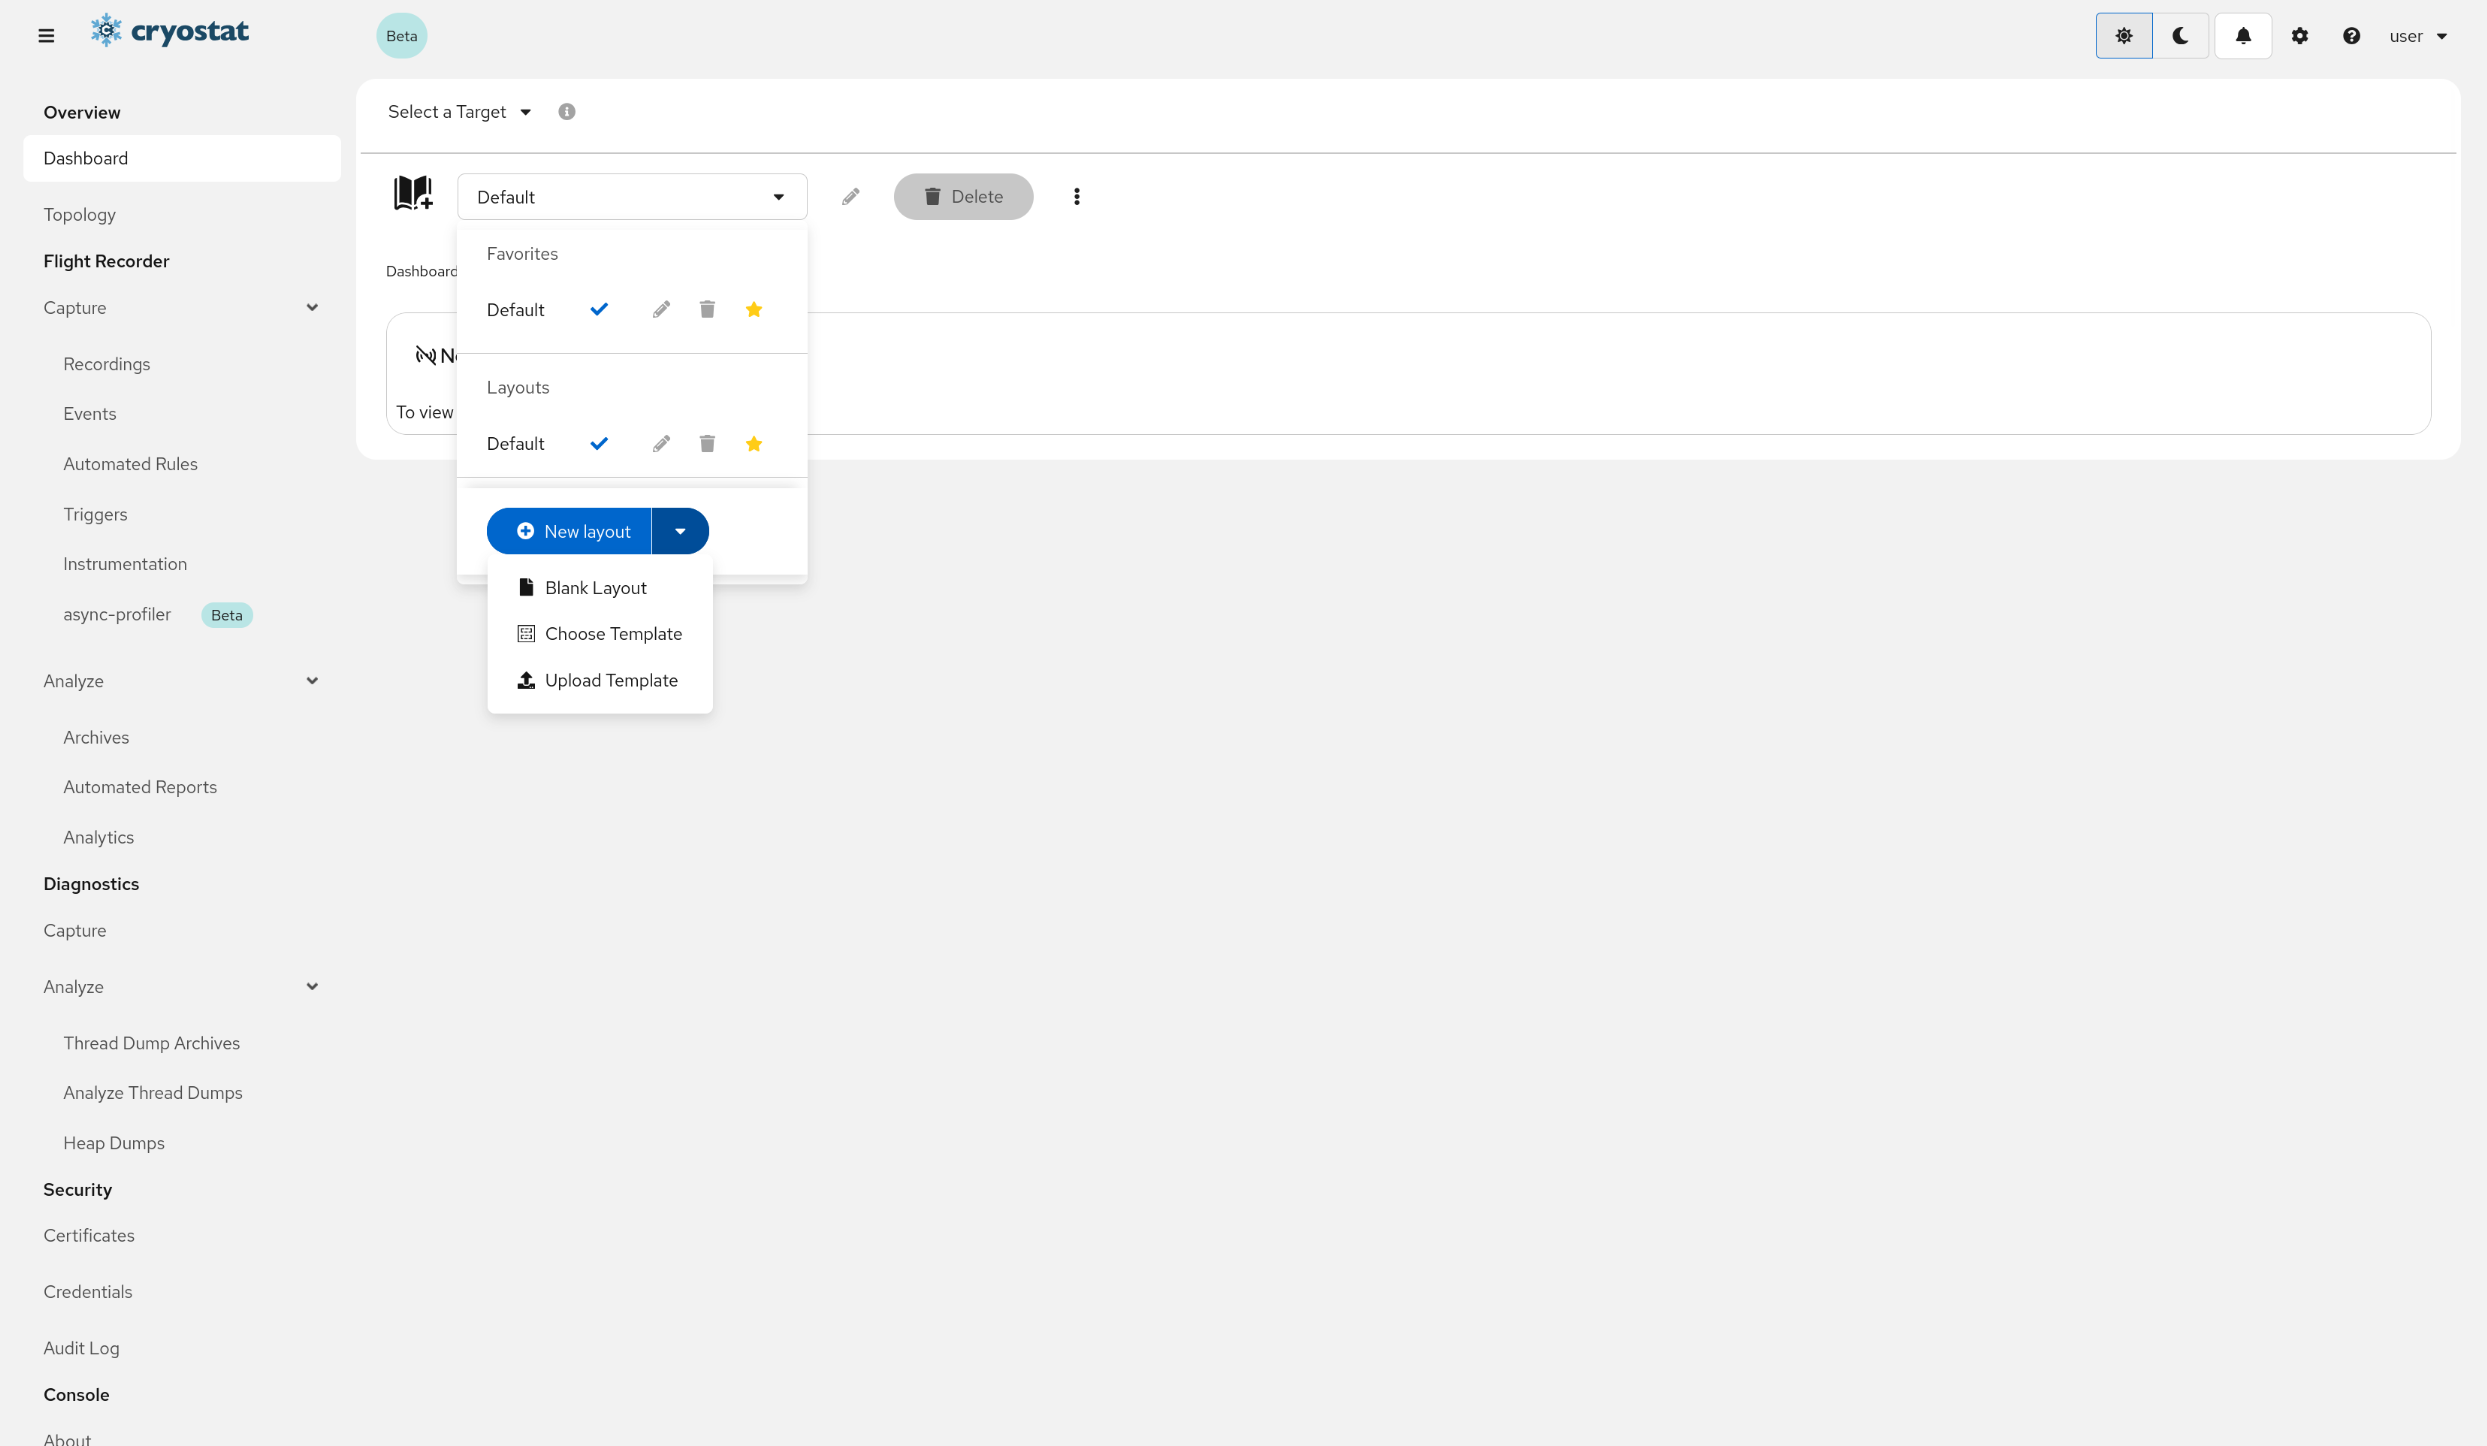
Open the Layout Selector DropdownClick the layout selector dropdown to view the available layouts.
The Layout Selector contains a list of all available layouts. The currently selected layout is indicated with a check mark "✓".
Select Choose Template
Click the expandable menu on New Layout button and select Choose Template. This will open the template picker.
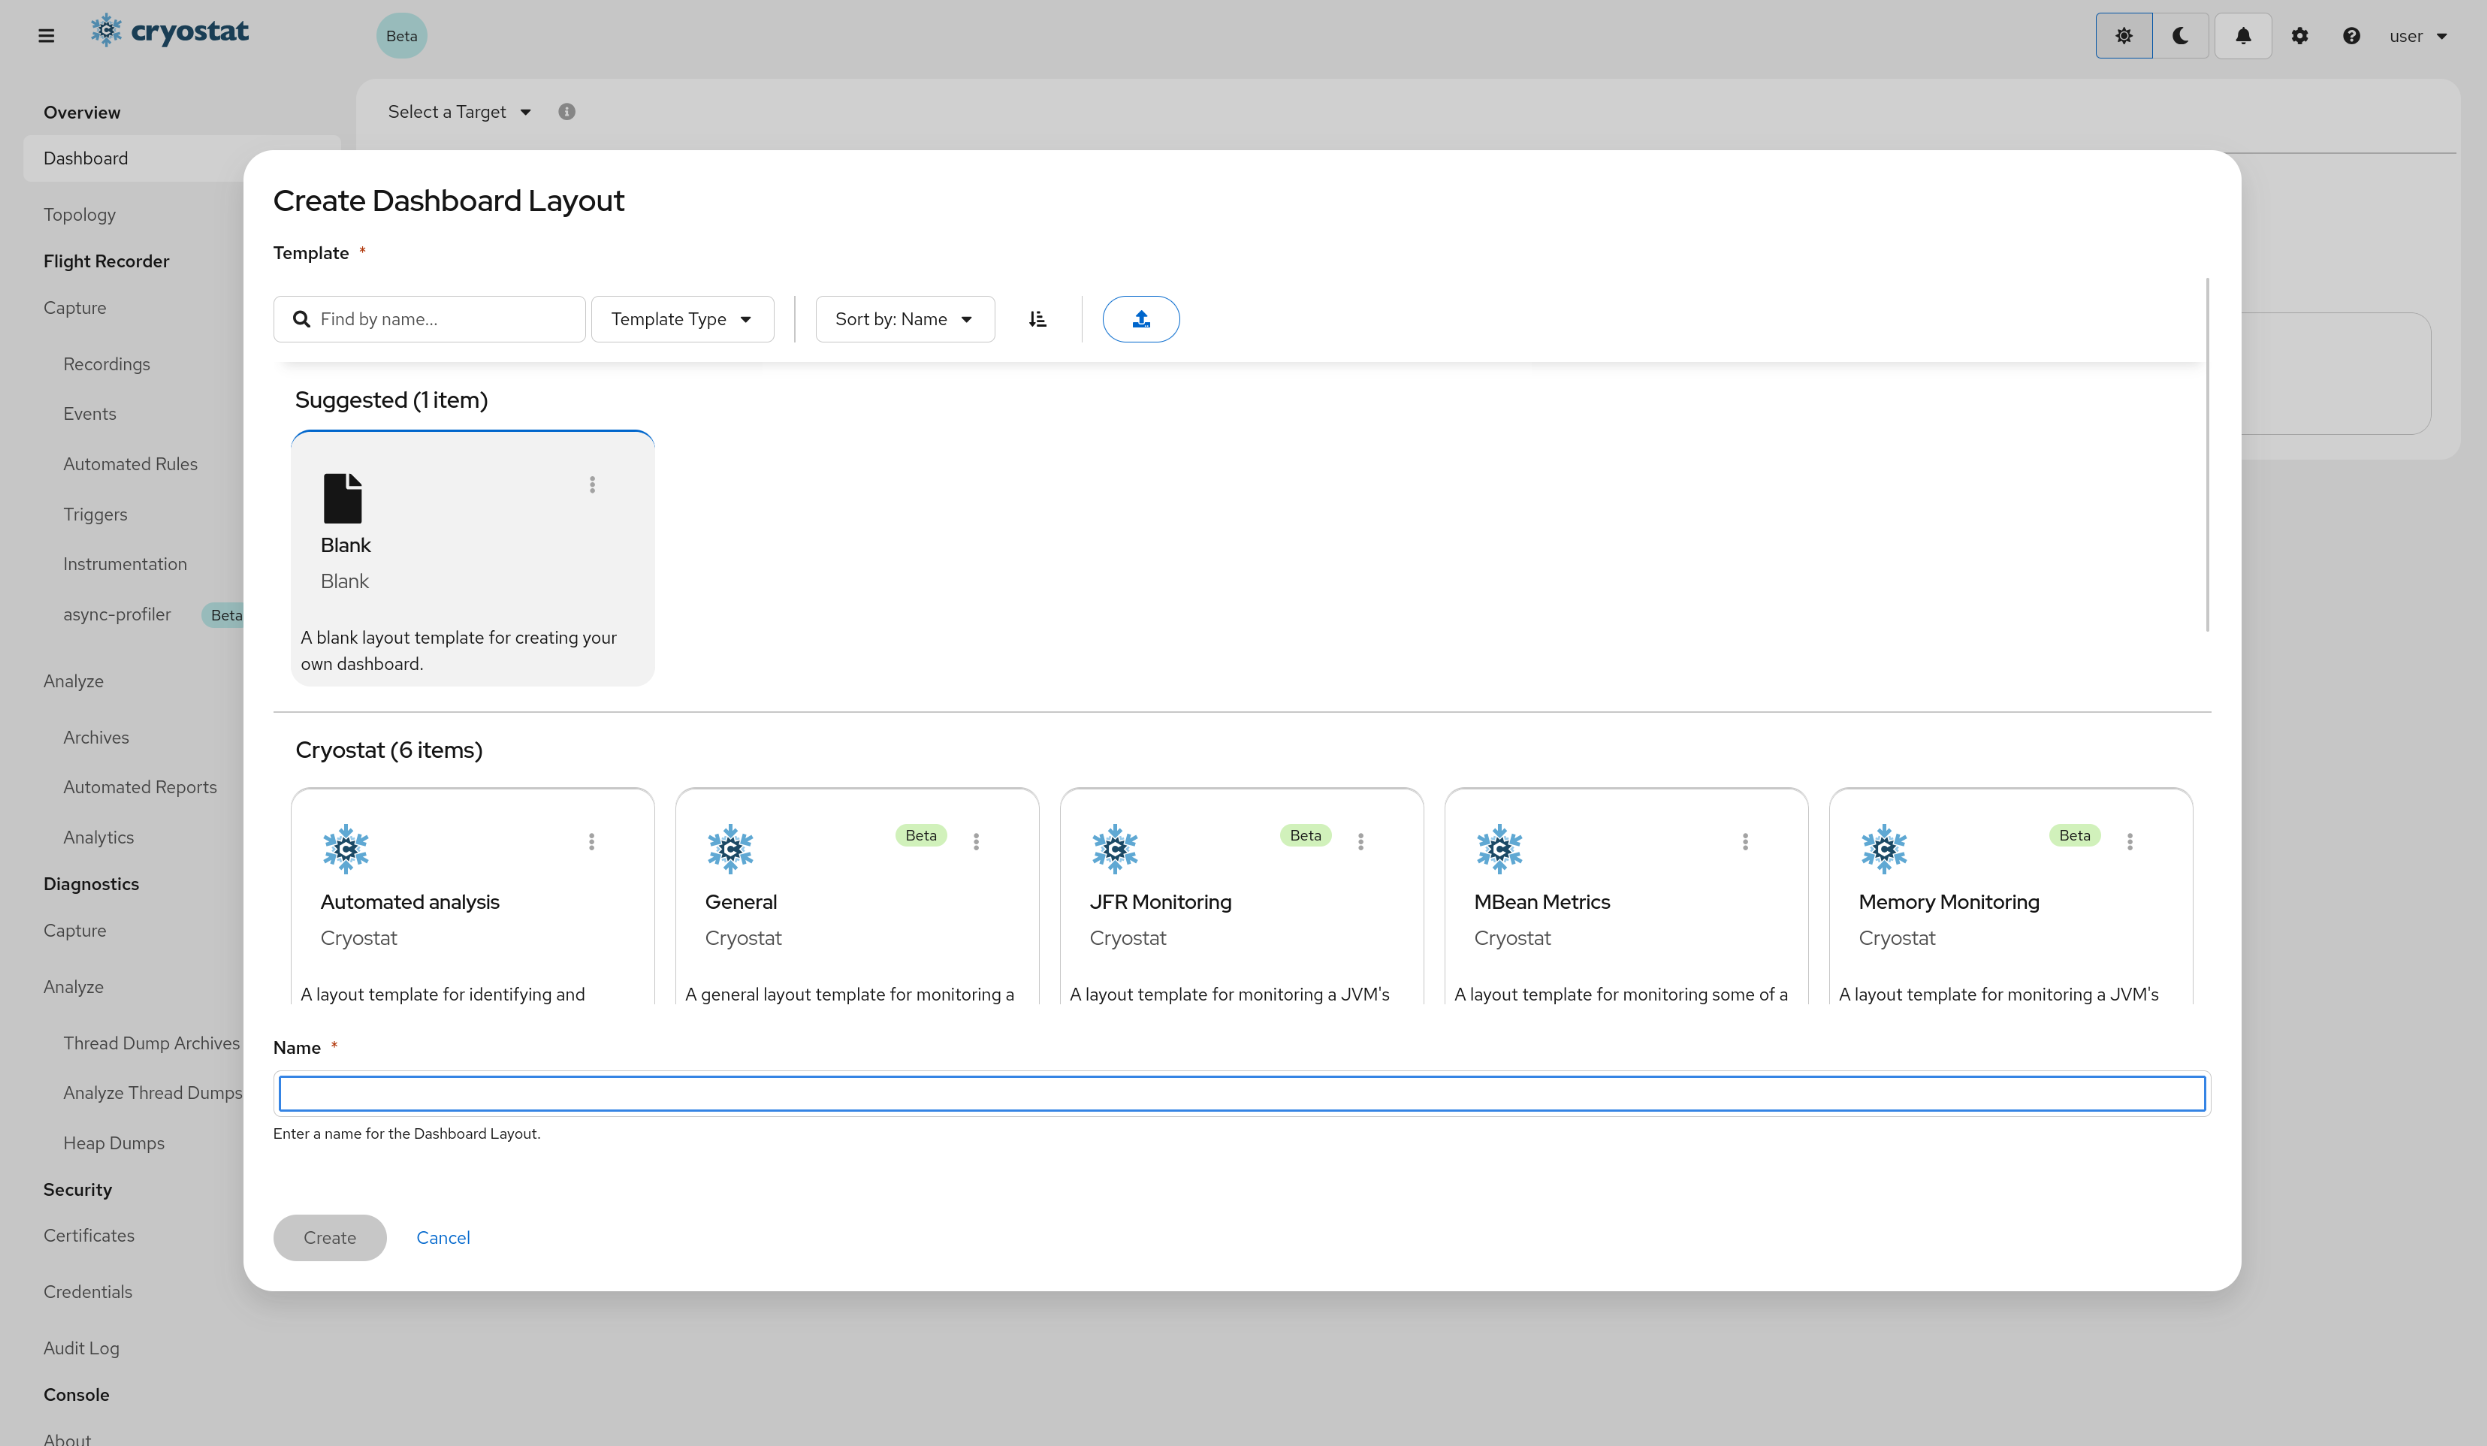
Choose a TemplateClicking a template will open a preview where you can view the template's cards.
The template picker displays all the available templates. Templates are categorized into 3 groups.
Suggested: Templates that are suggested for you based on recent activity.
Cryostat: Templates that come with Cryostat.
User-submitted: Templates that you have created or imported.
Additionally, you can search for templates by typing in the Search bar or Filter templates by category. You can also upload templates directly here by clicking Upload.
Select a template by clicking on it.
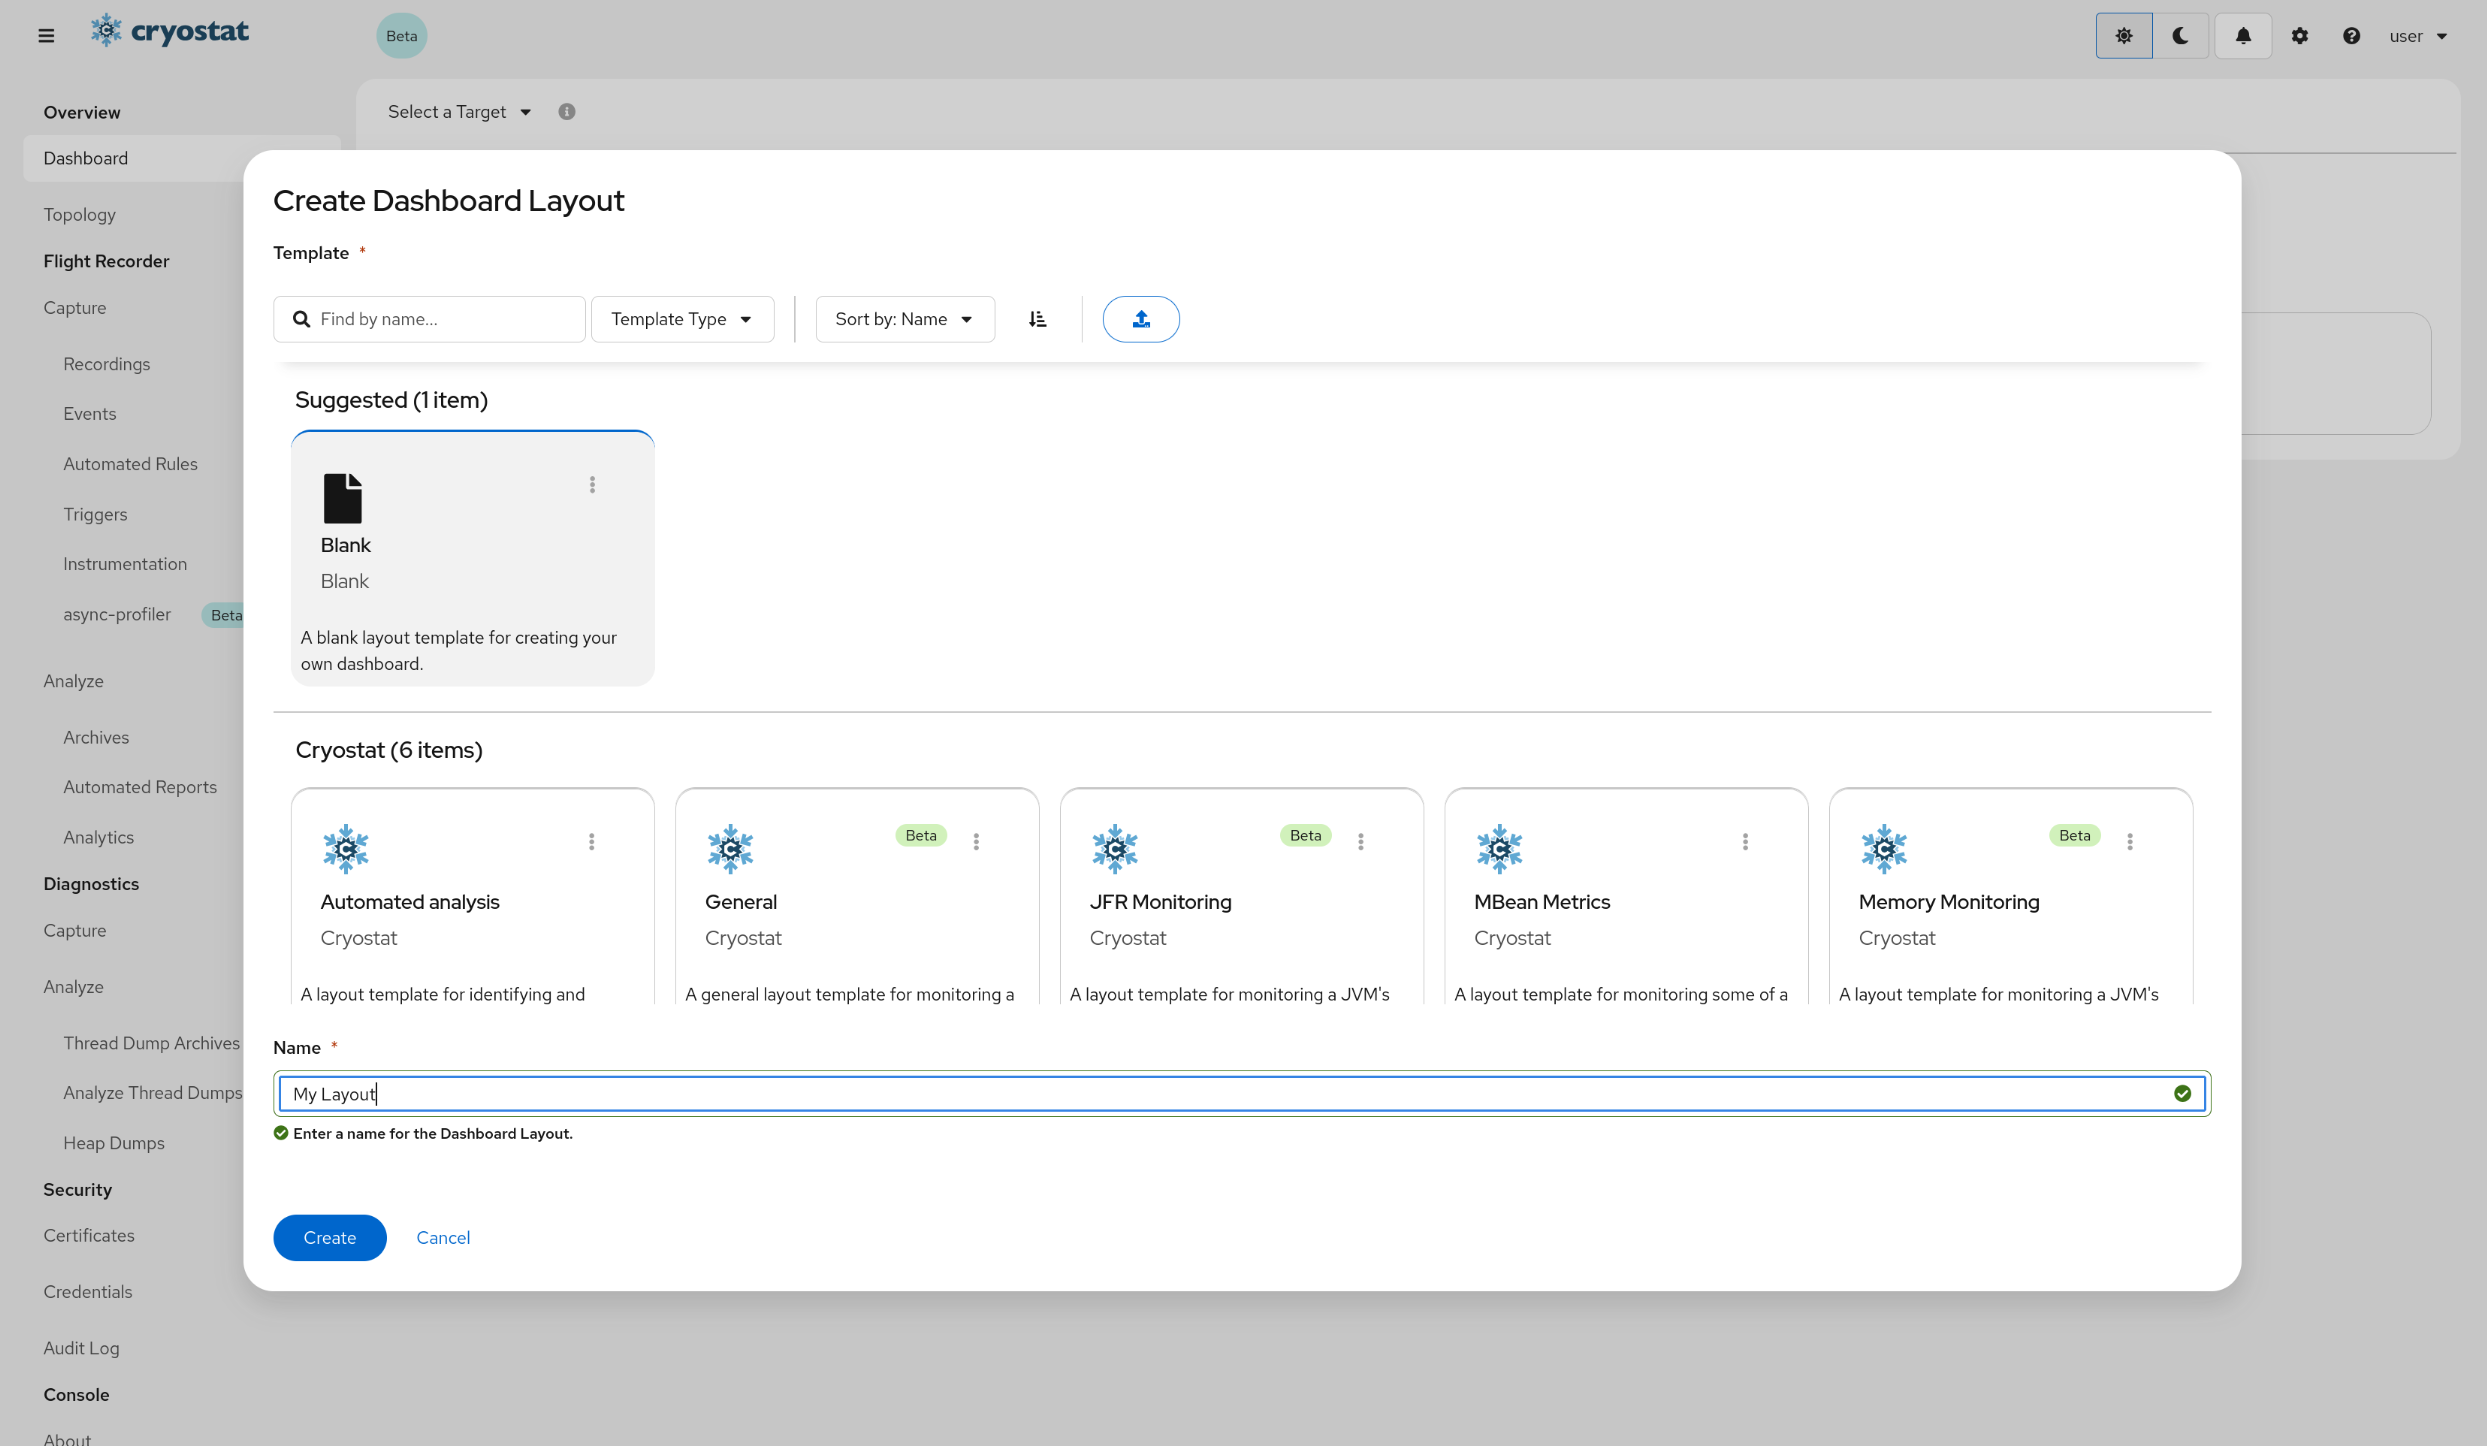
Enter a Name for the New Layout
A layout name must be entered before the Create button is enabled. The name must be alphanumeric, can only contain underscores, dashes, and periods, and must be 20 characters or less.
Click CreateThe new layout will be created and the dashboard view will switch to the new layout with the template applied.
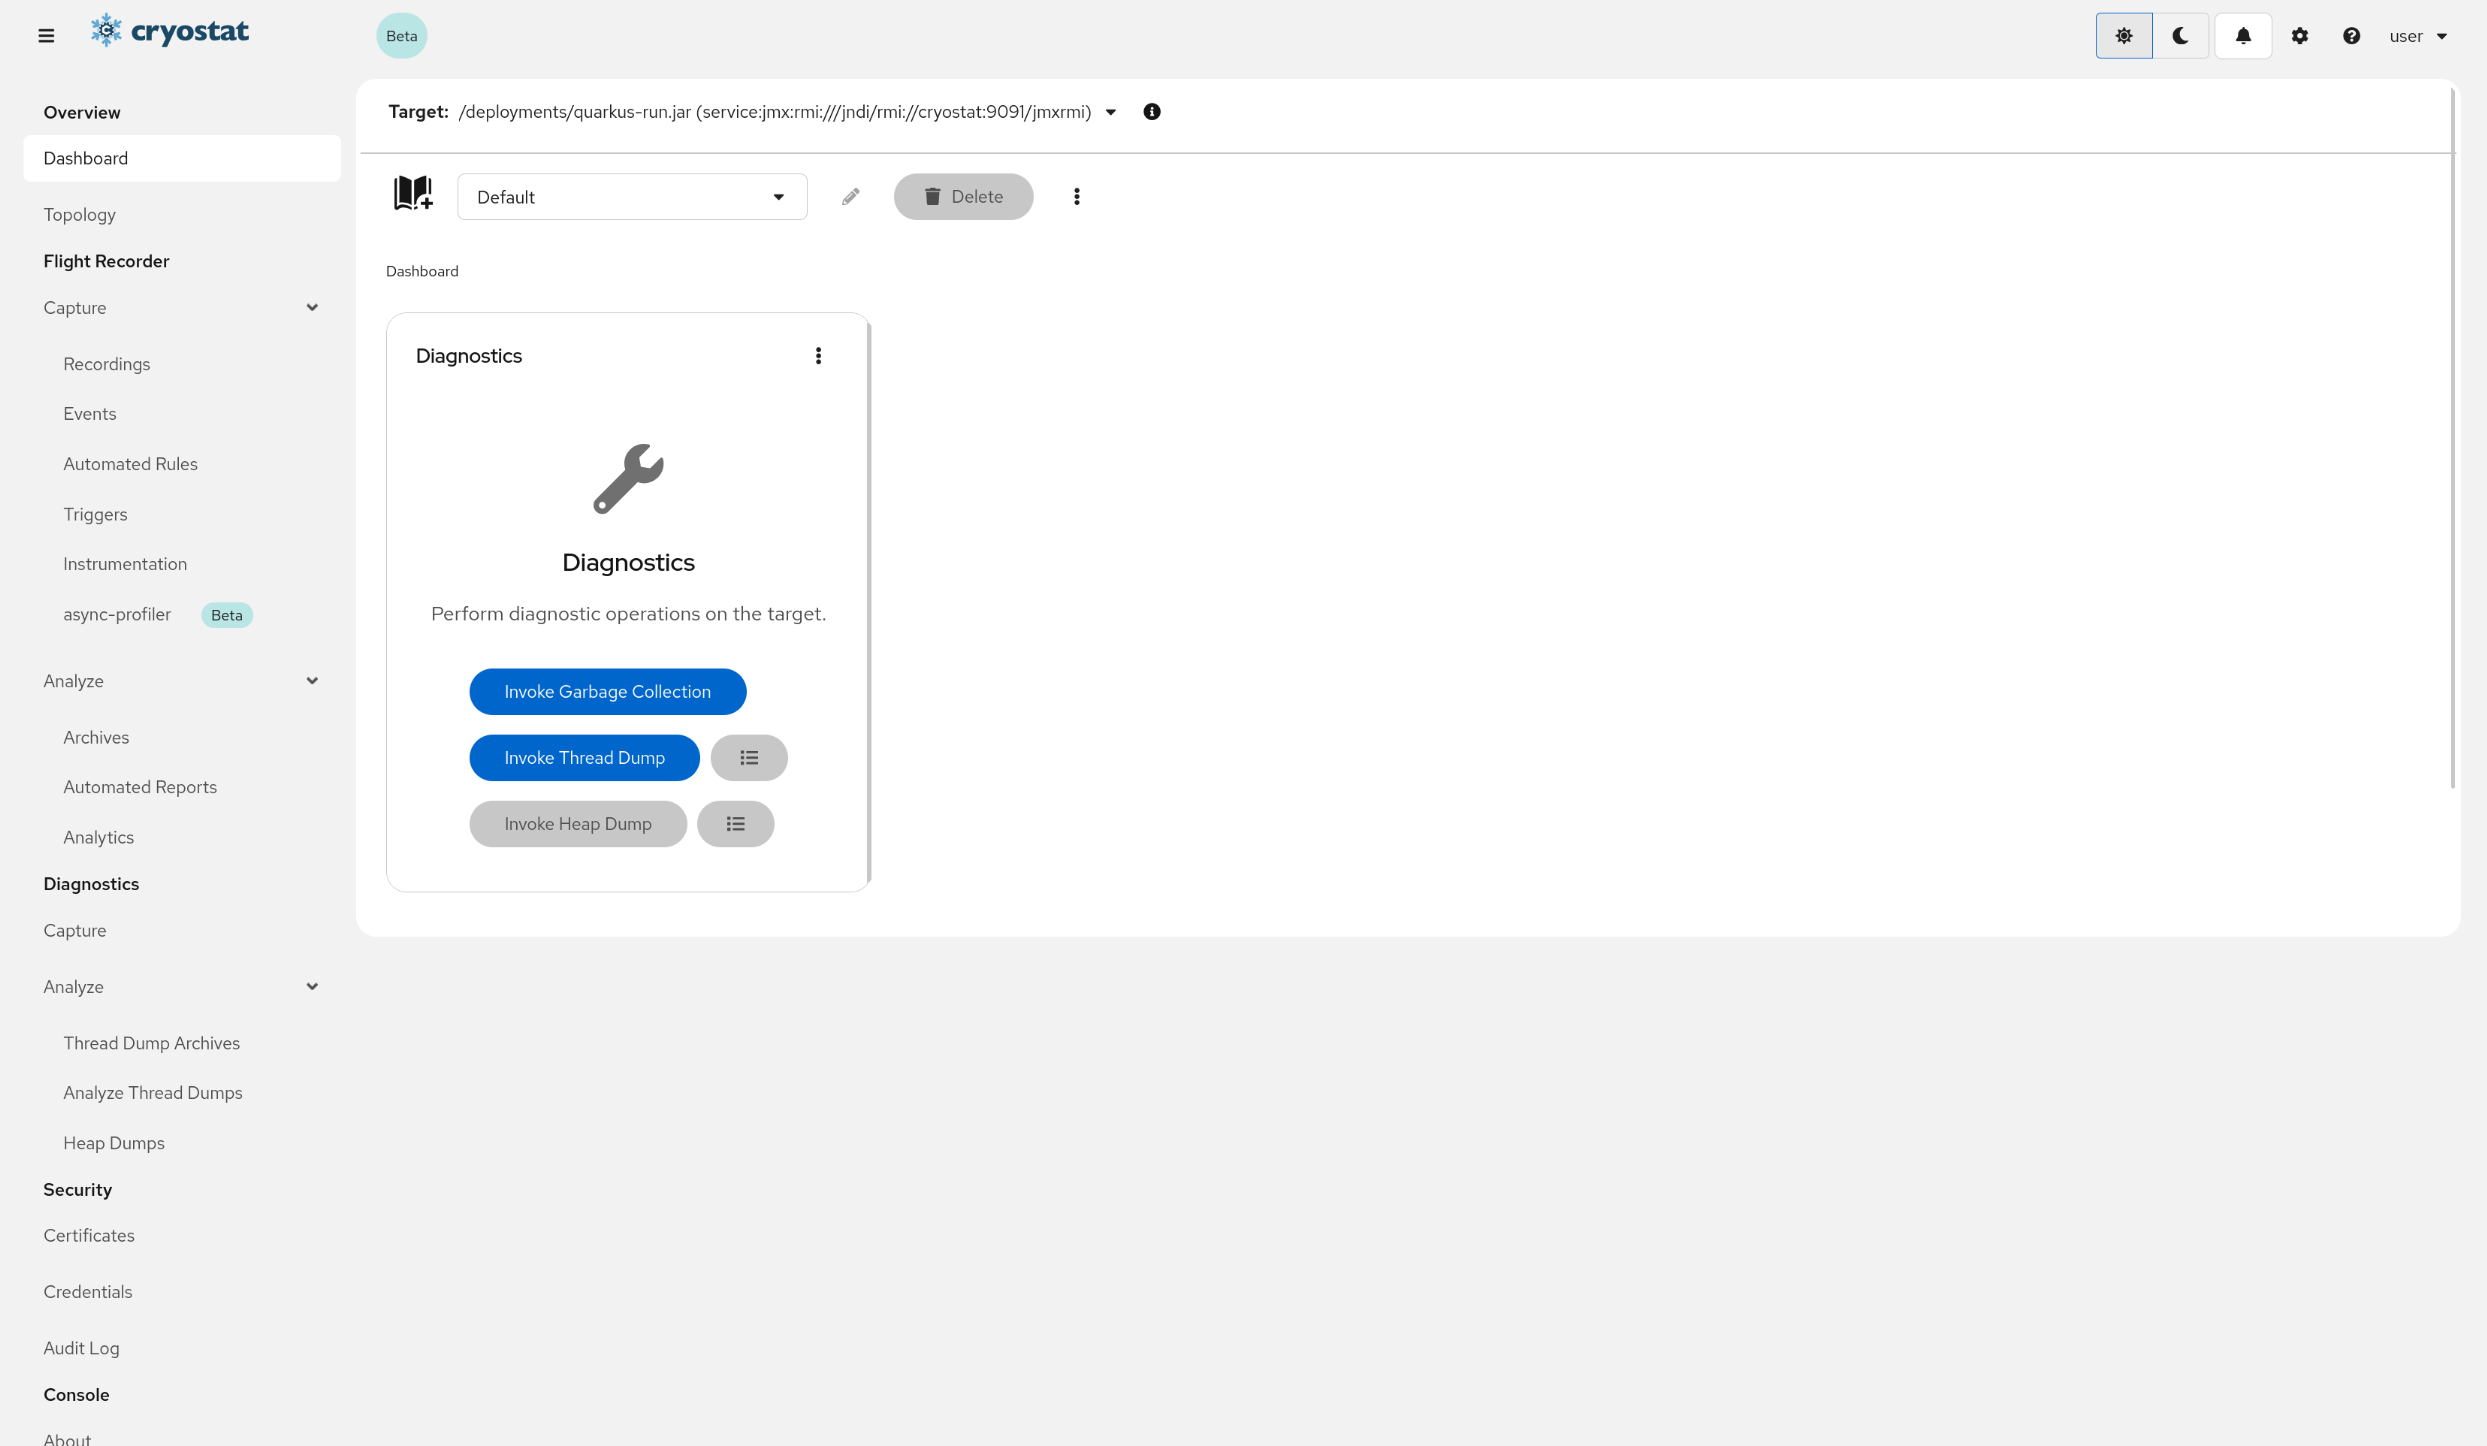
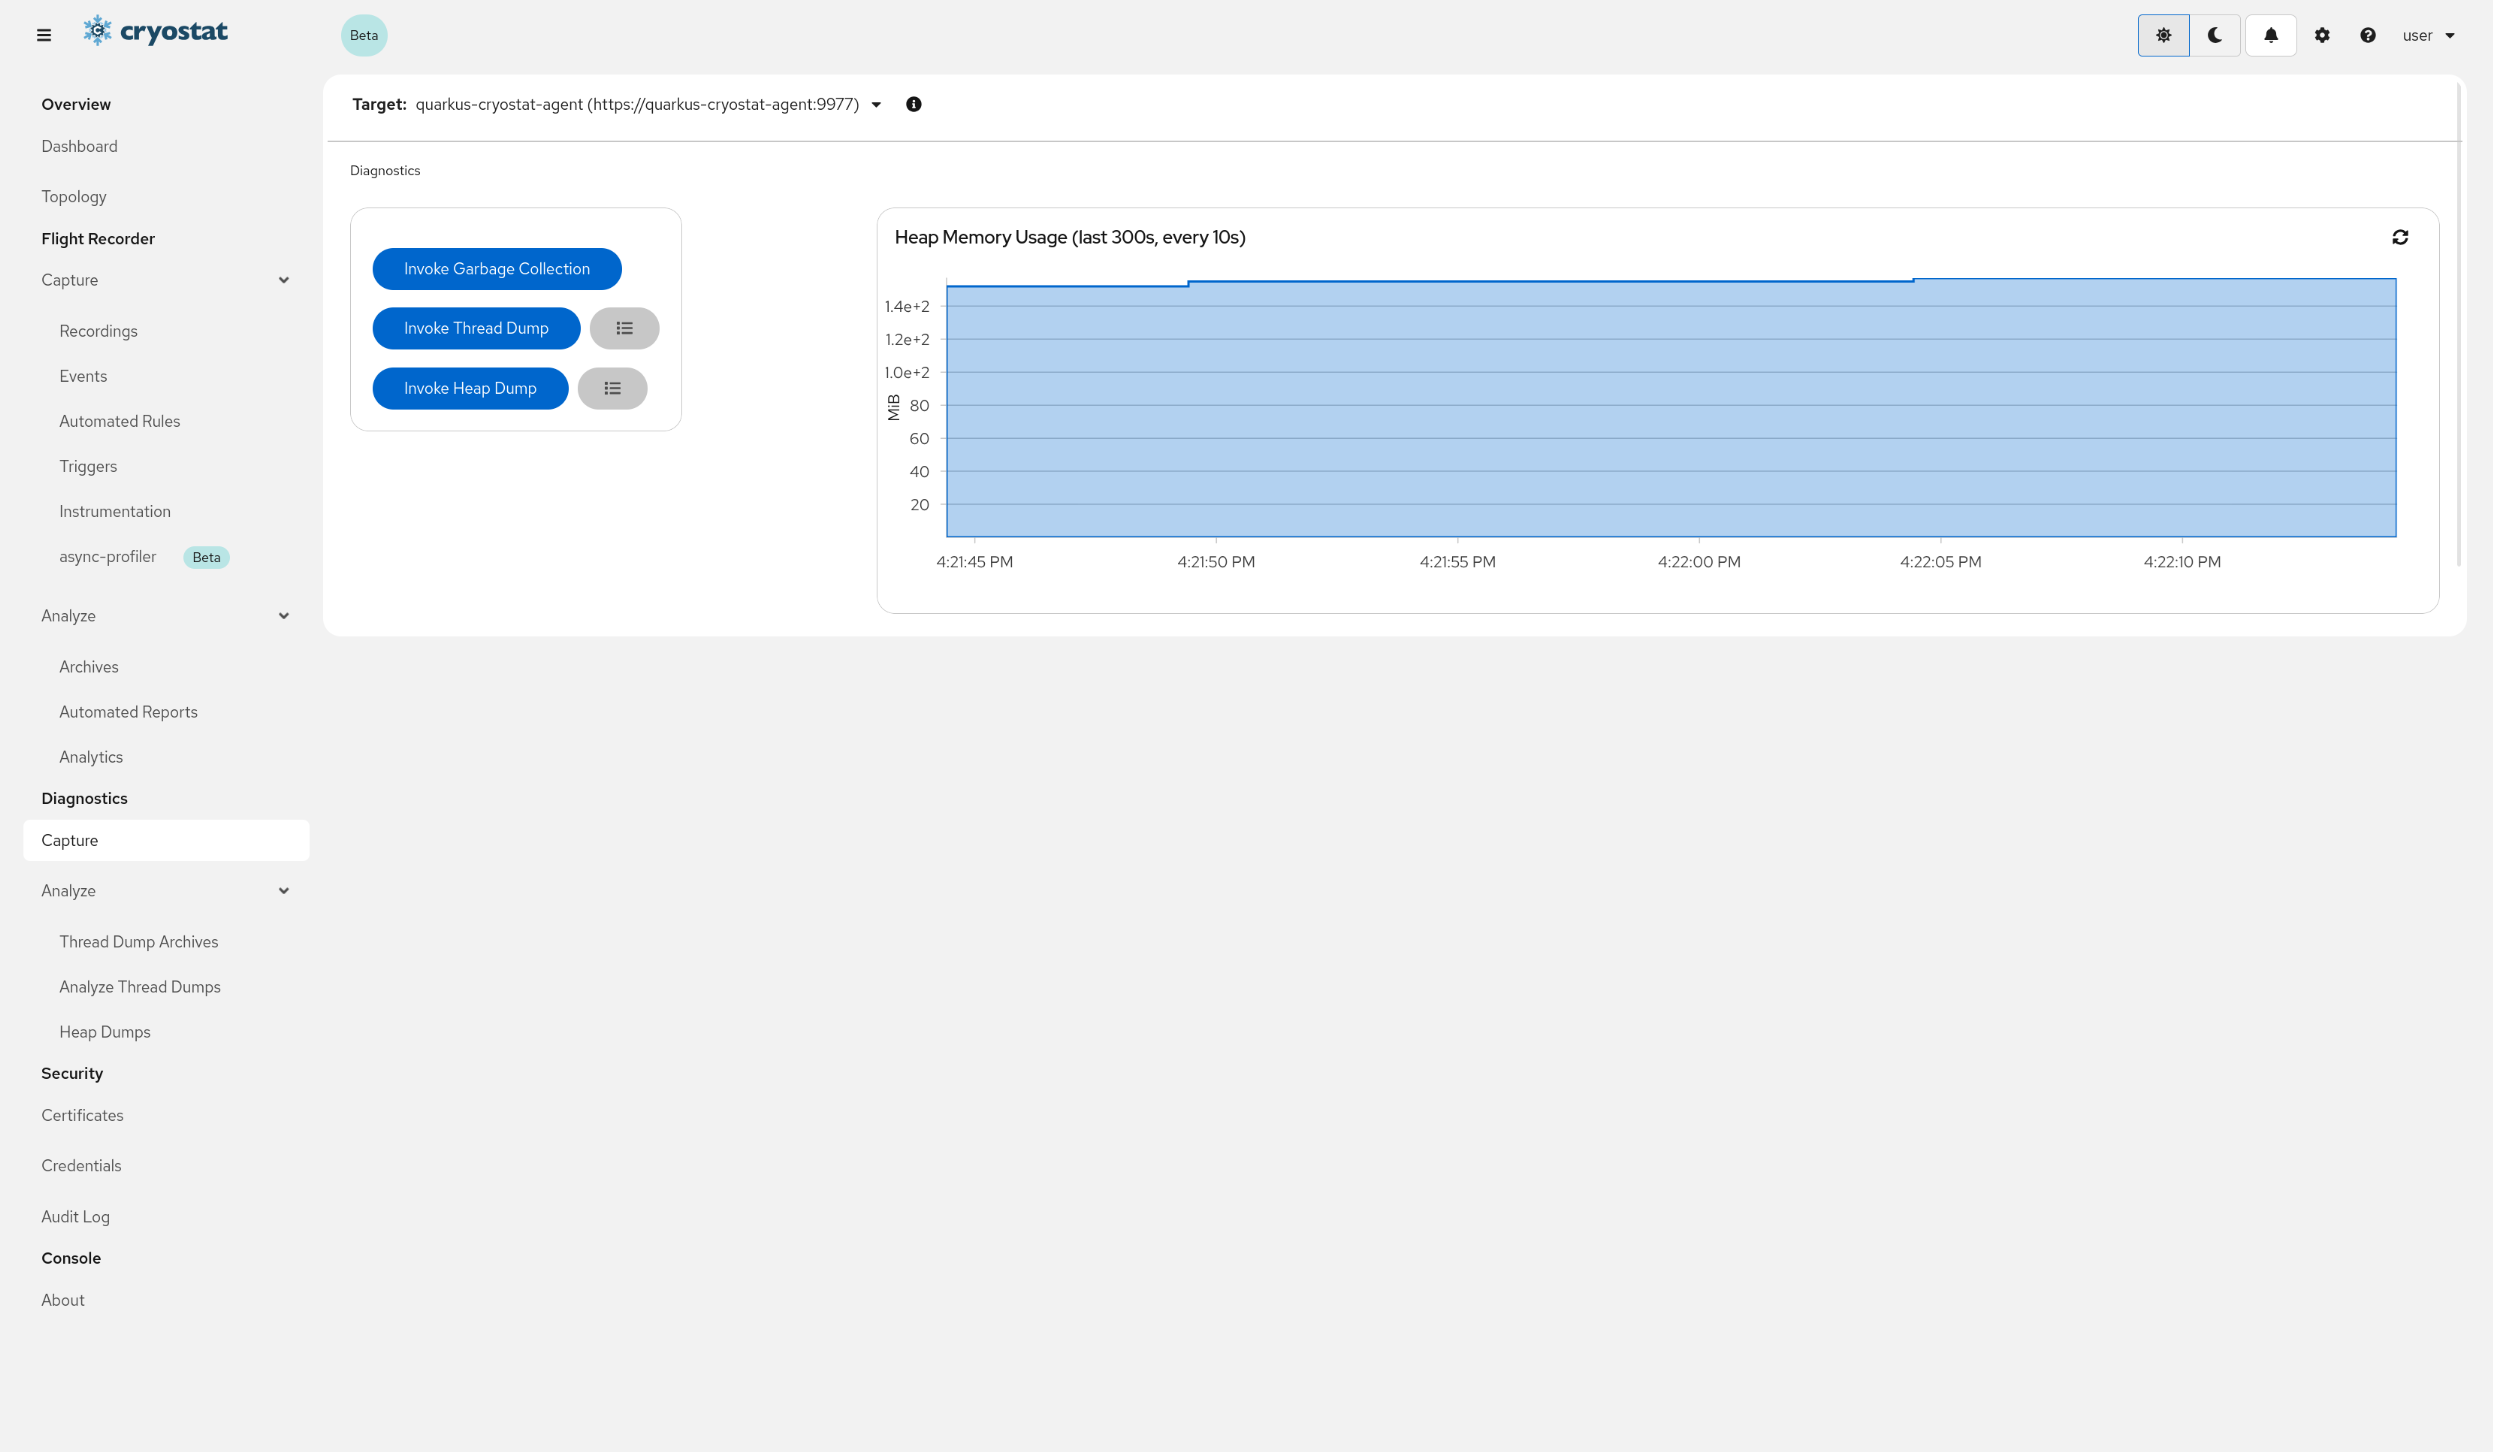
Navigate to the Diagnostics PageClick on Diagnostics/Capture on the sidebar.
The Diagnostics/Capture view allows
you to perform diagnostic operations on a targetJVM through remote access to supported Java MXBeans.
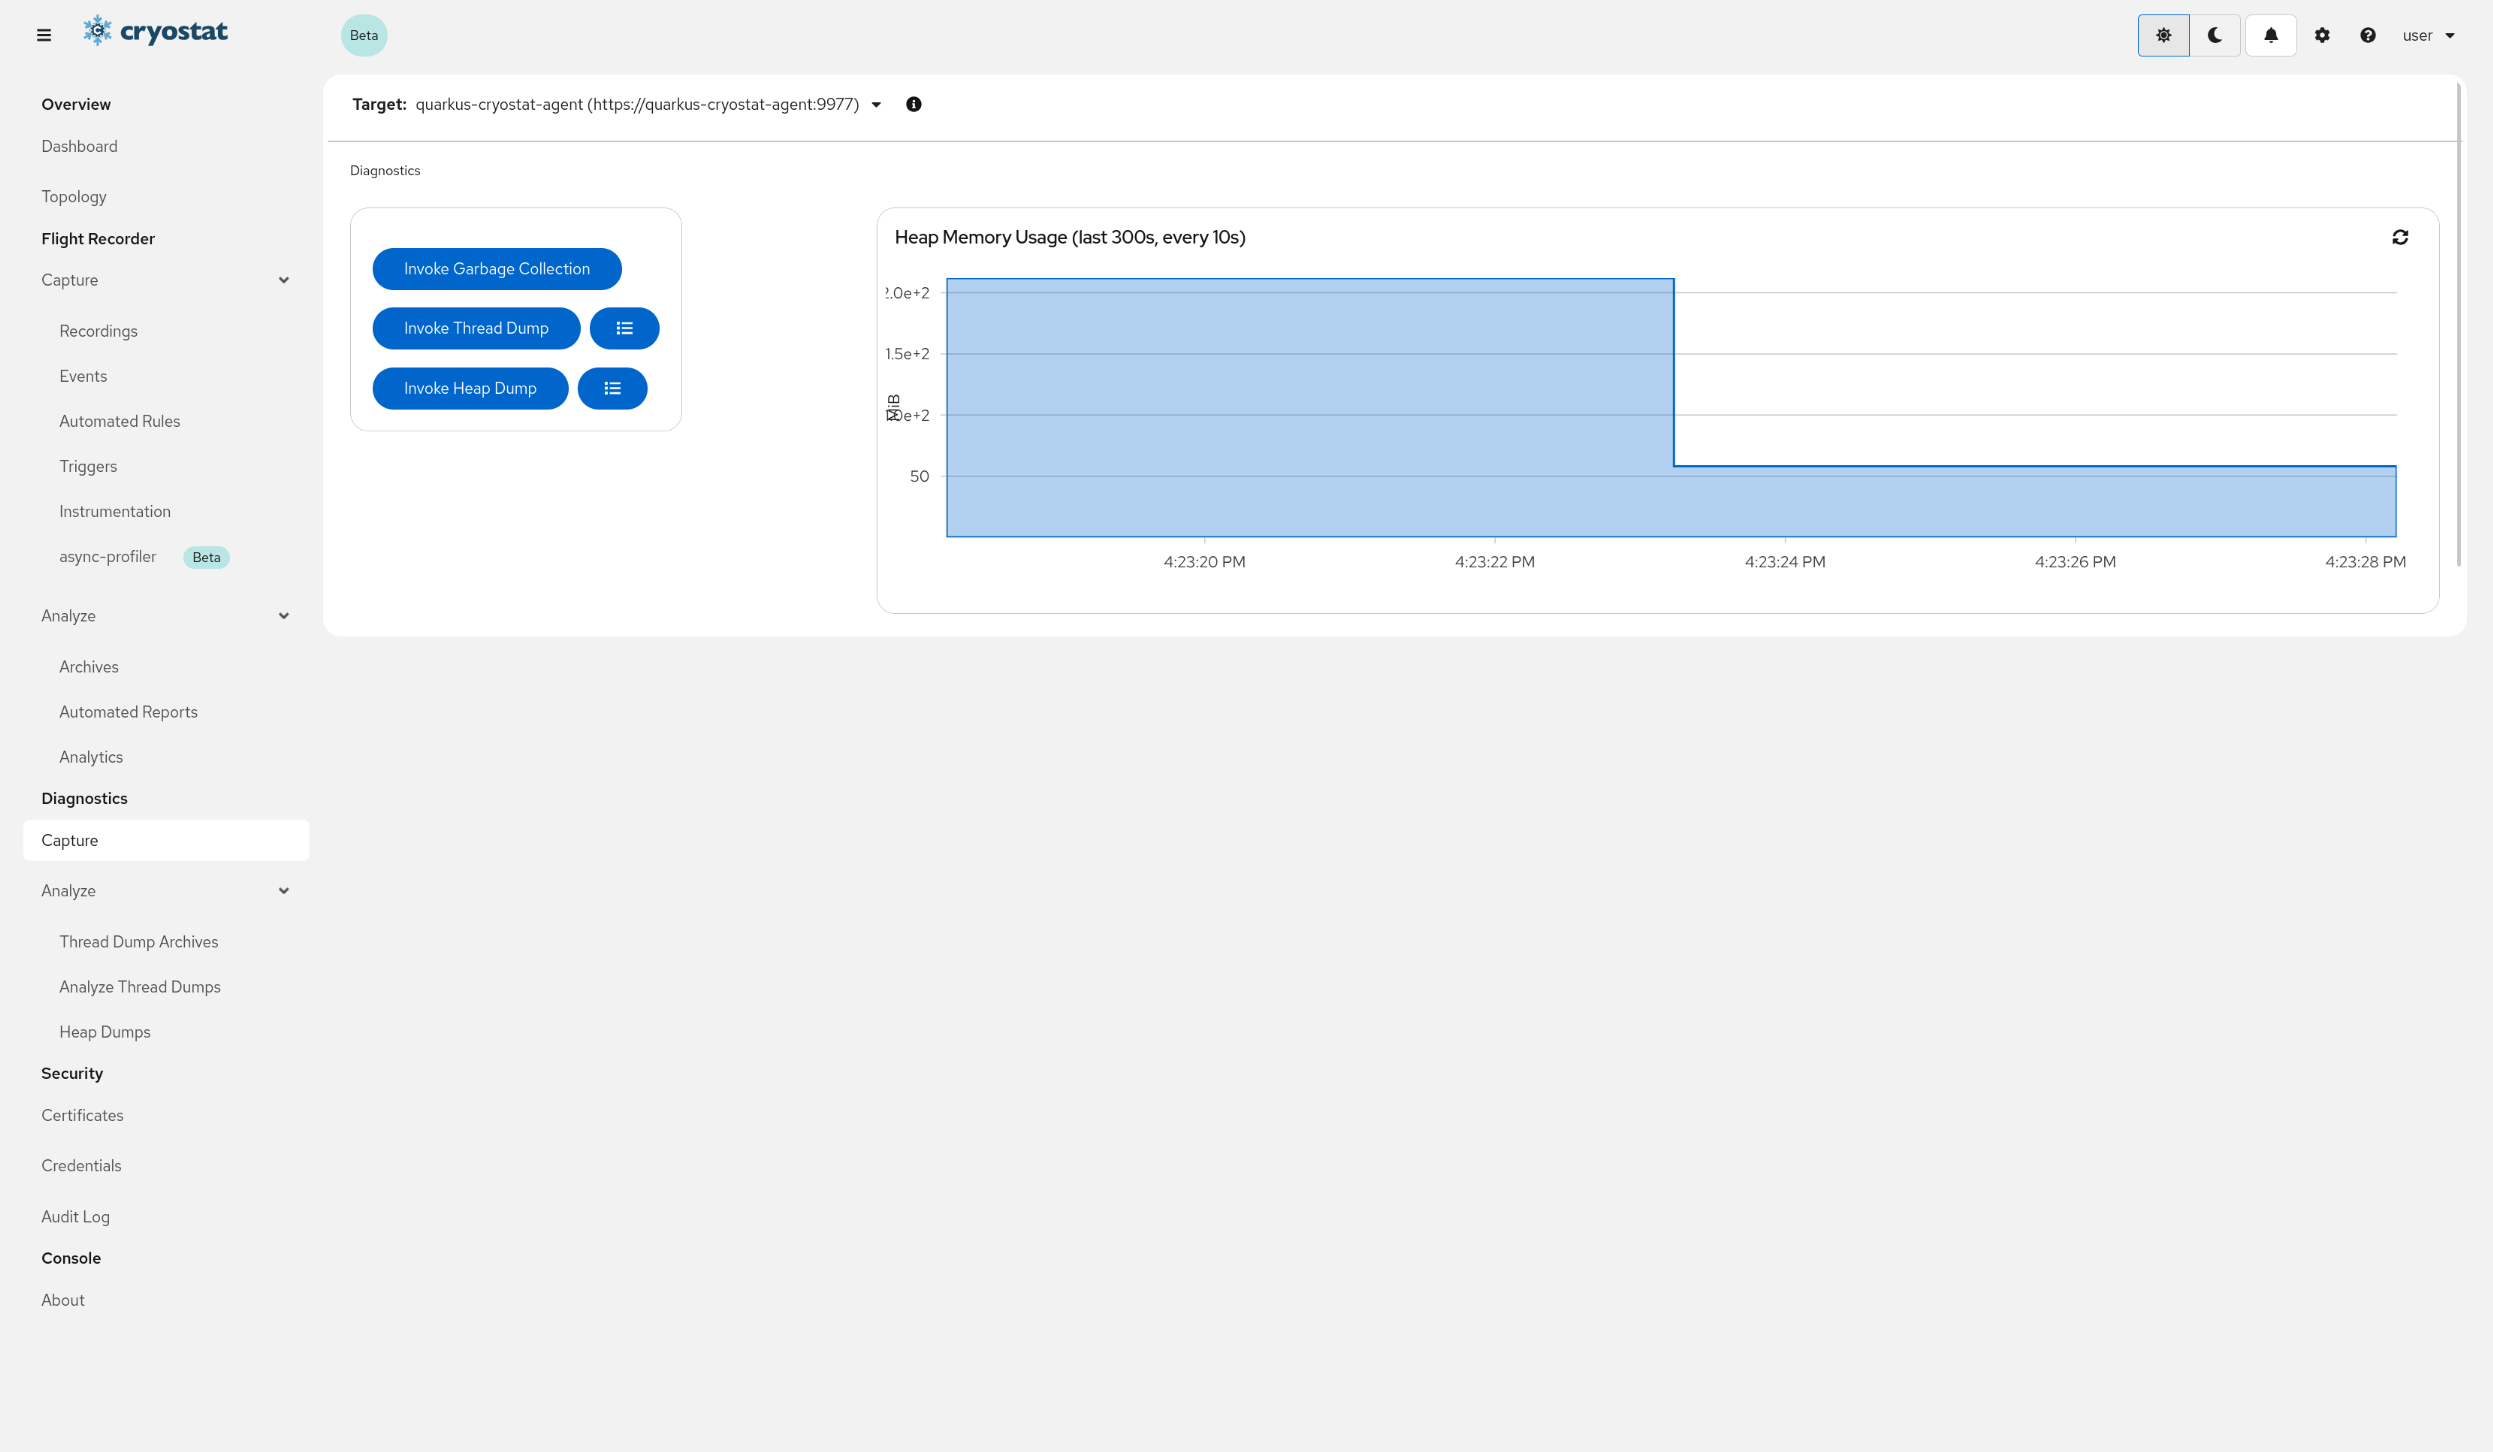
Click the Invoke Garbage Collection button
Clicking the Invoke Garbage Collection button causes Cryostat to send a request to the selected target JVM to perform a Garbage Collection cycle. If the target JVM accepts and performs this cycle, and if it was able to free up heap space during the cycle, then the Heap Memory Usage chart should update and reflect the new heap usage.
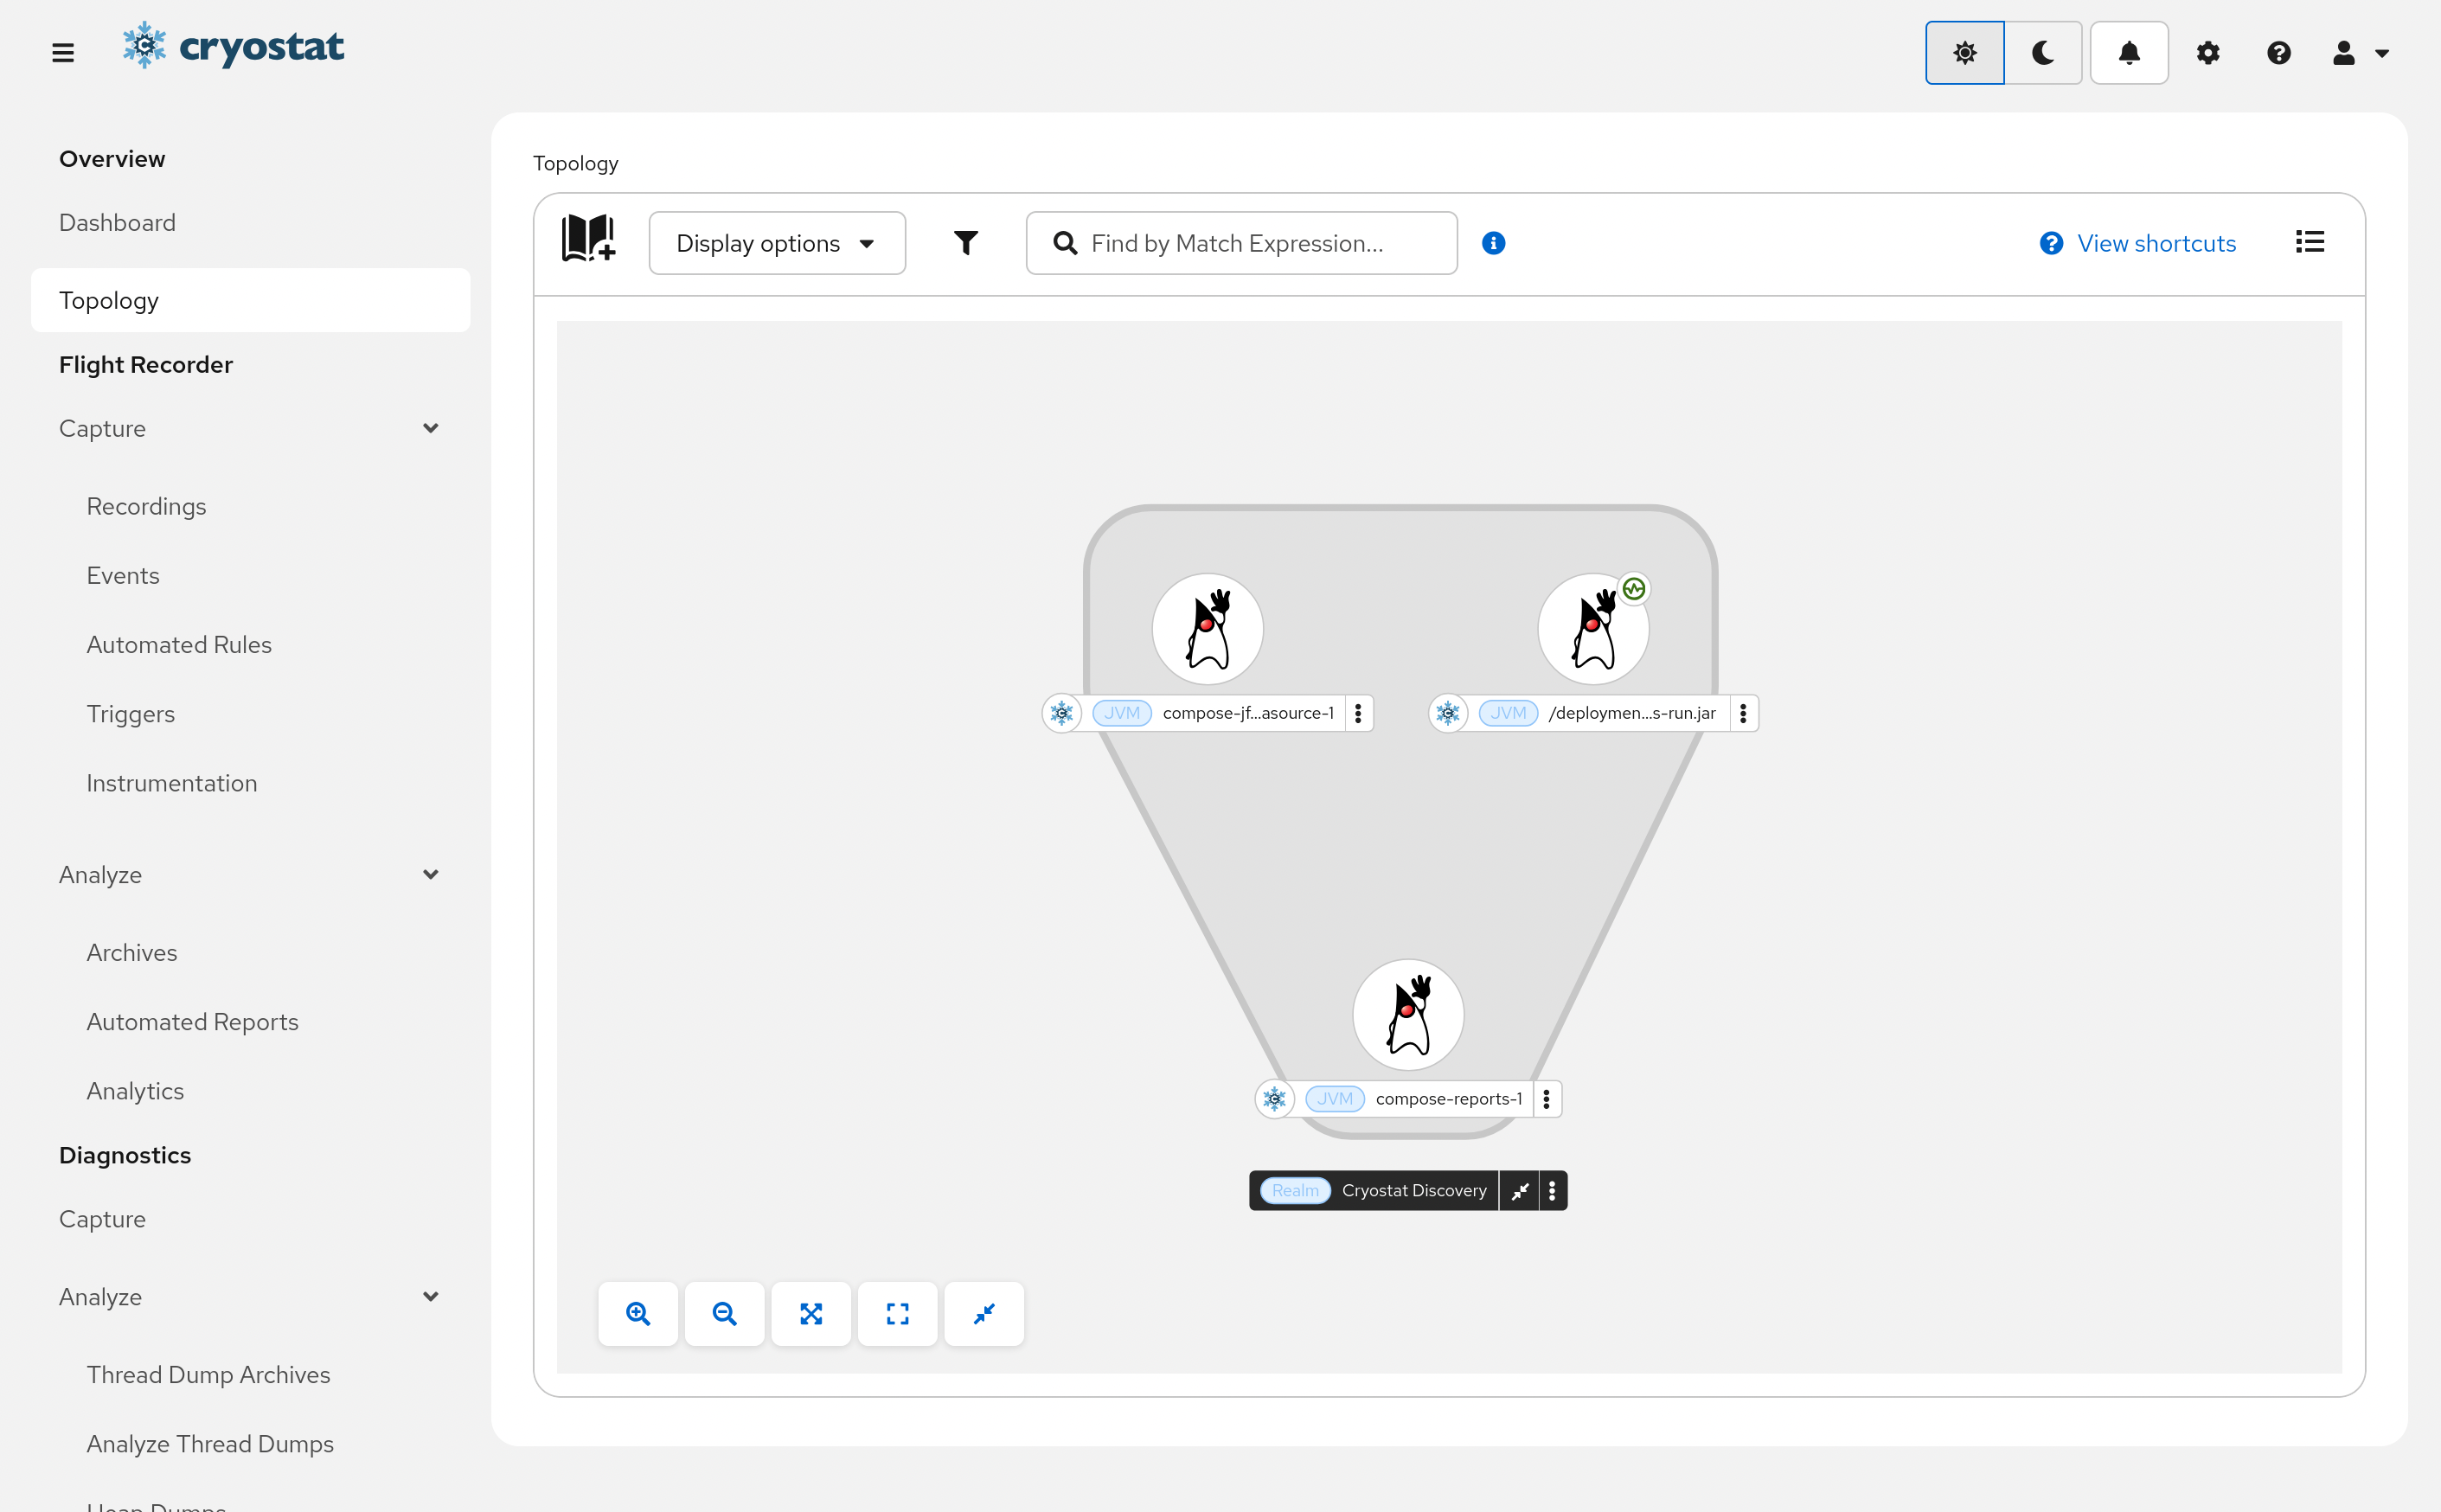
The Topology View provides a visual presentation of all the discovered JVM applications, and all their associated resources. It also allows users to perform actions on one or multiple targets.
Navigate to Overview/TopologyUse the bottom Control Bar to adjust the Graph View as needed.
When you need to view or perform actions on multiple targetJVMs at the same time, Topology View is the way.
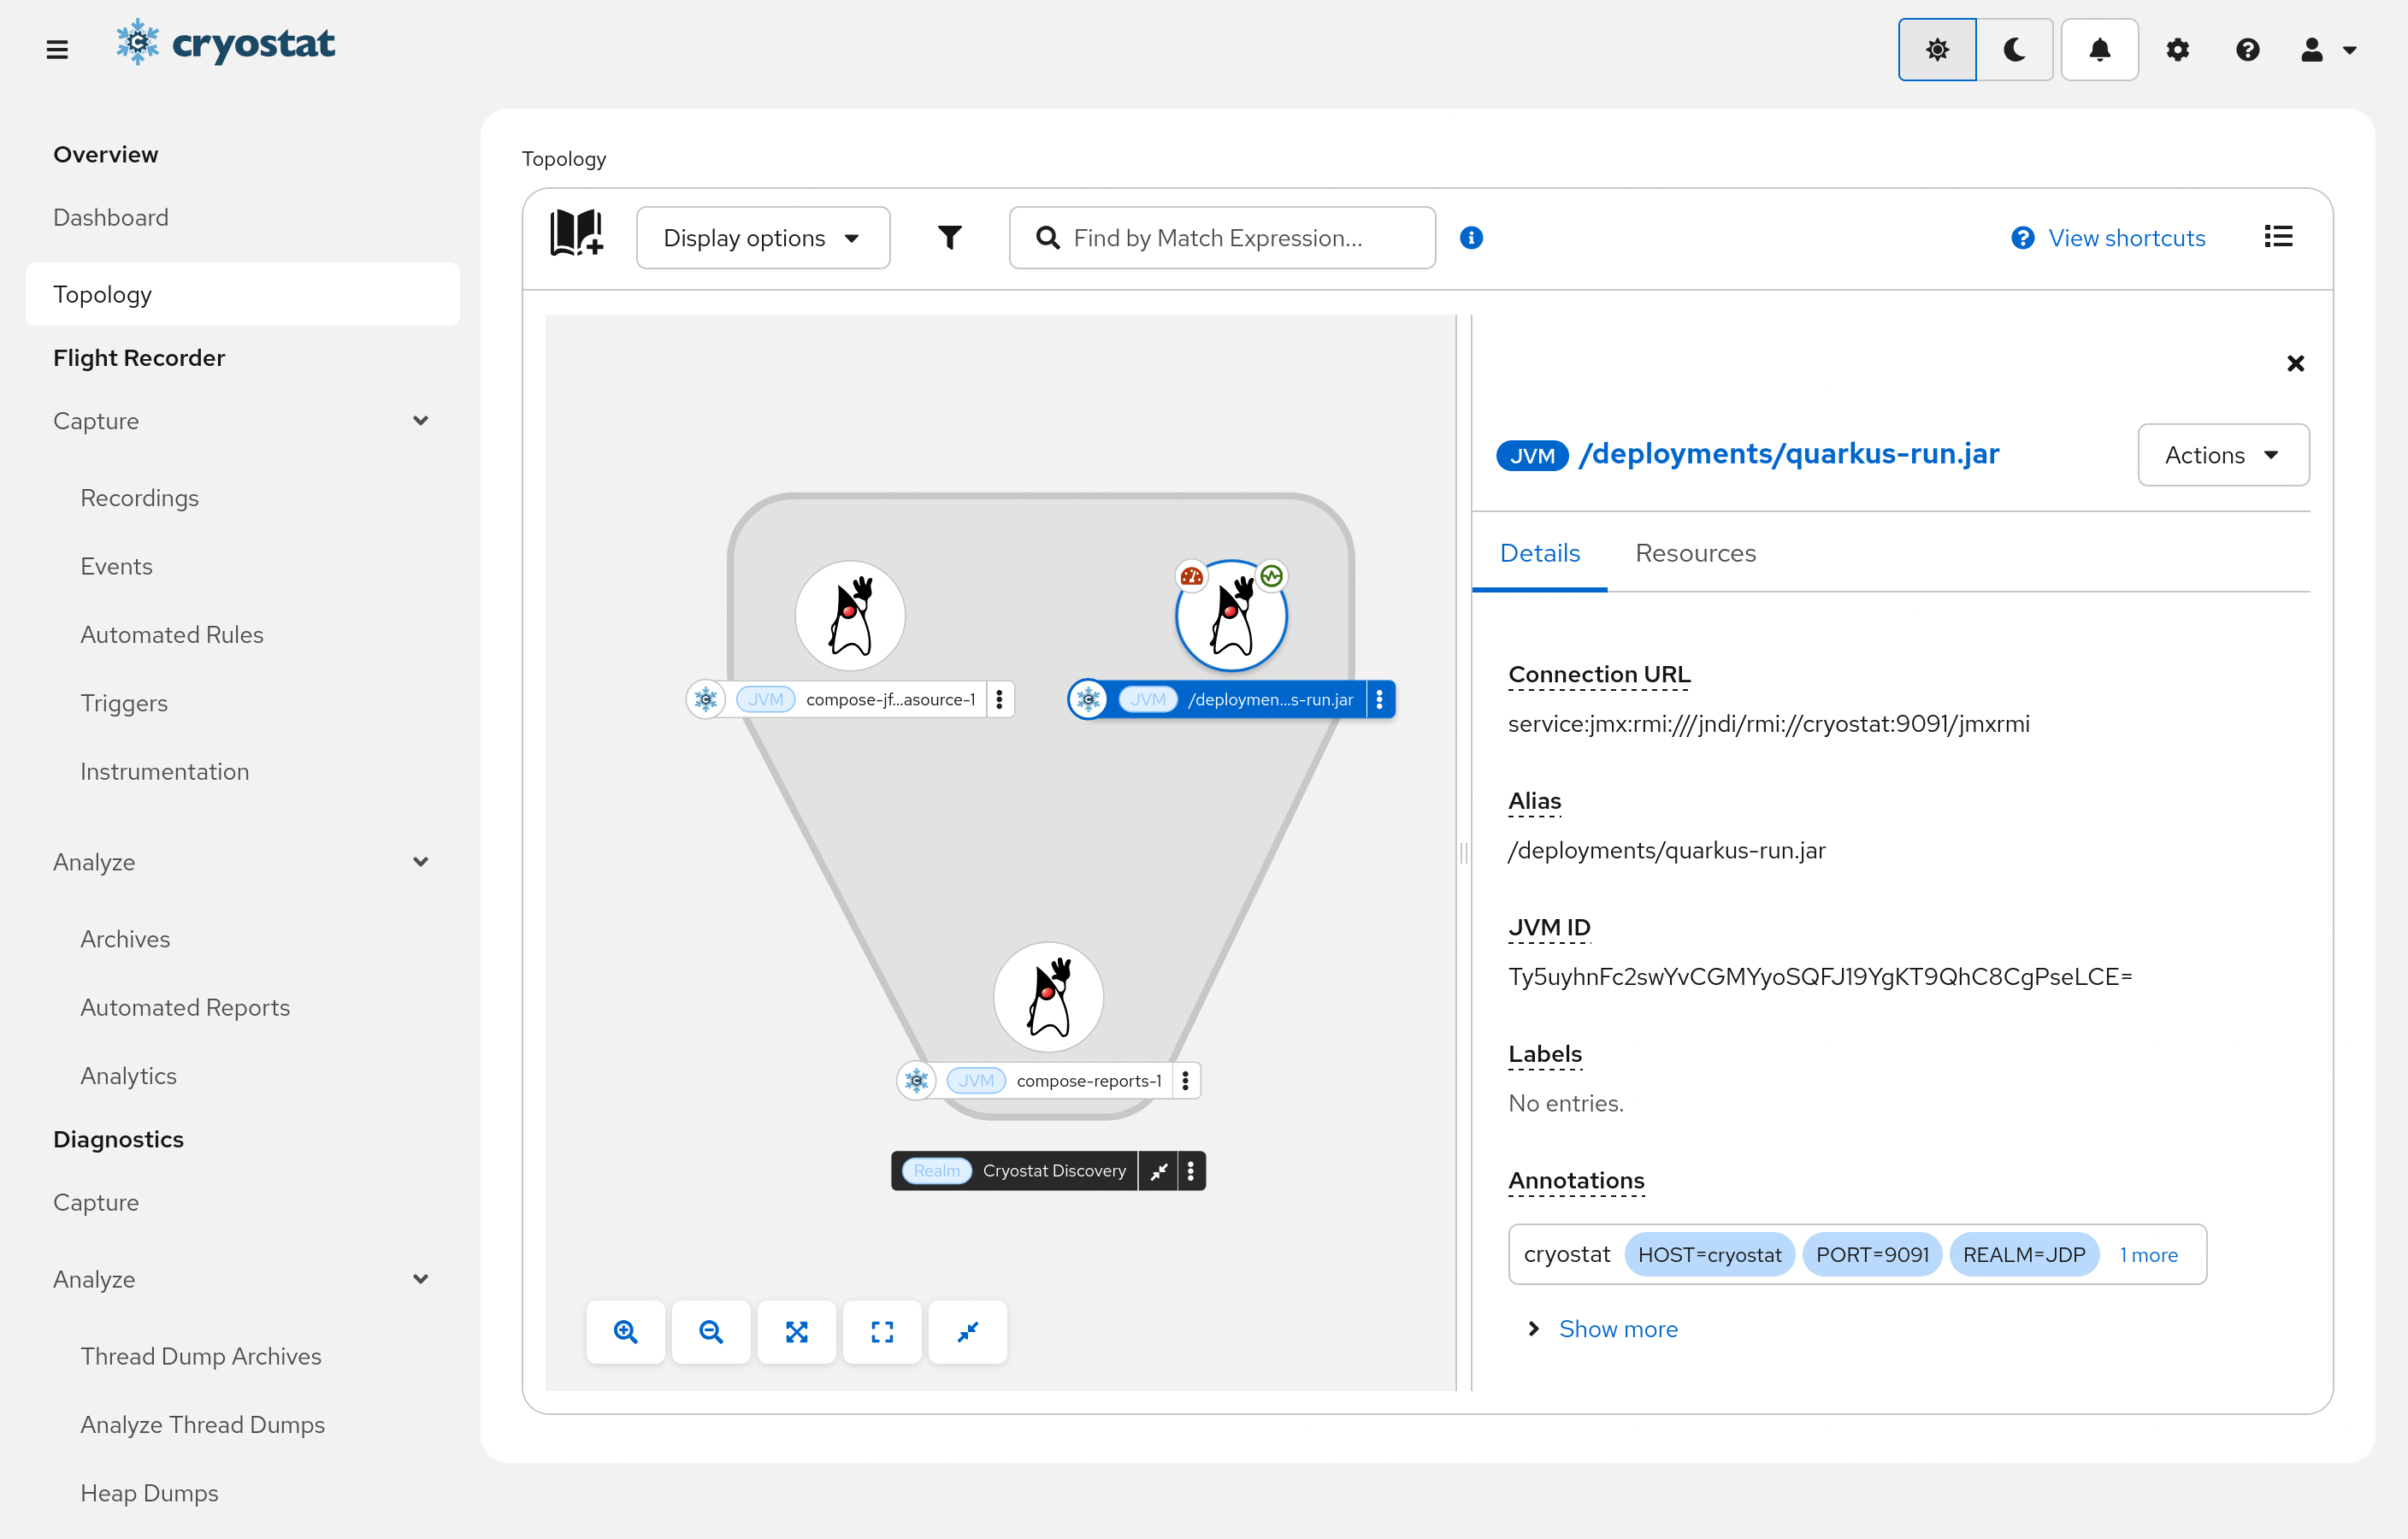
View JVM Applications with Graph ViewView JVM applications with Topology Graph view.
By default, an interactive Graph View of targetJVMs (nodes) are shown nested within their associated groups (surrounding lines), for example, Pods, or Realms (i.e. discovery mechanisms to discover Java Applications, such as Kubernetes API, JDP or Cryostat Agent).
You can drag targetnodes/groups or use the bottom control bar to adjust the graph. For example, zoom out or fit all nodes into view. A toolbar is also available to allow further customization:
Display Options: adjust how the nodes and groups are displayed, for example, whether to show connection URL.
Filters: determine which targets or groups to show.
Search bar: find a target using Match Expression. The matched targets will be highlighted.
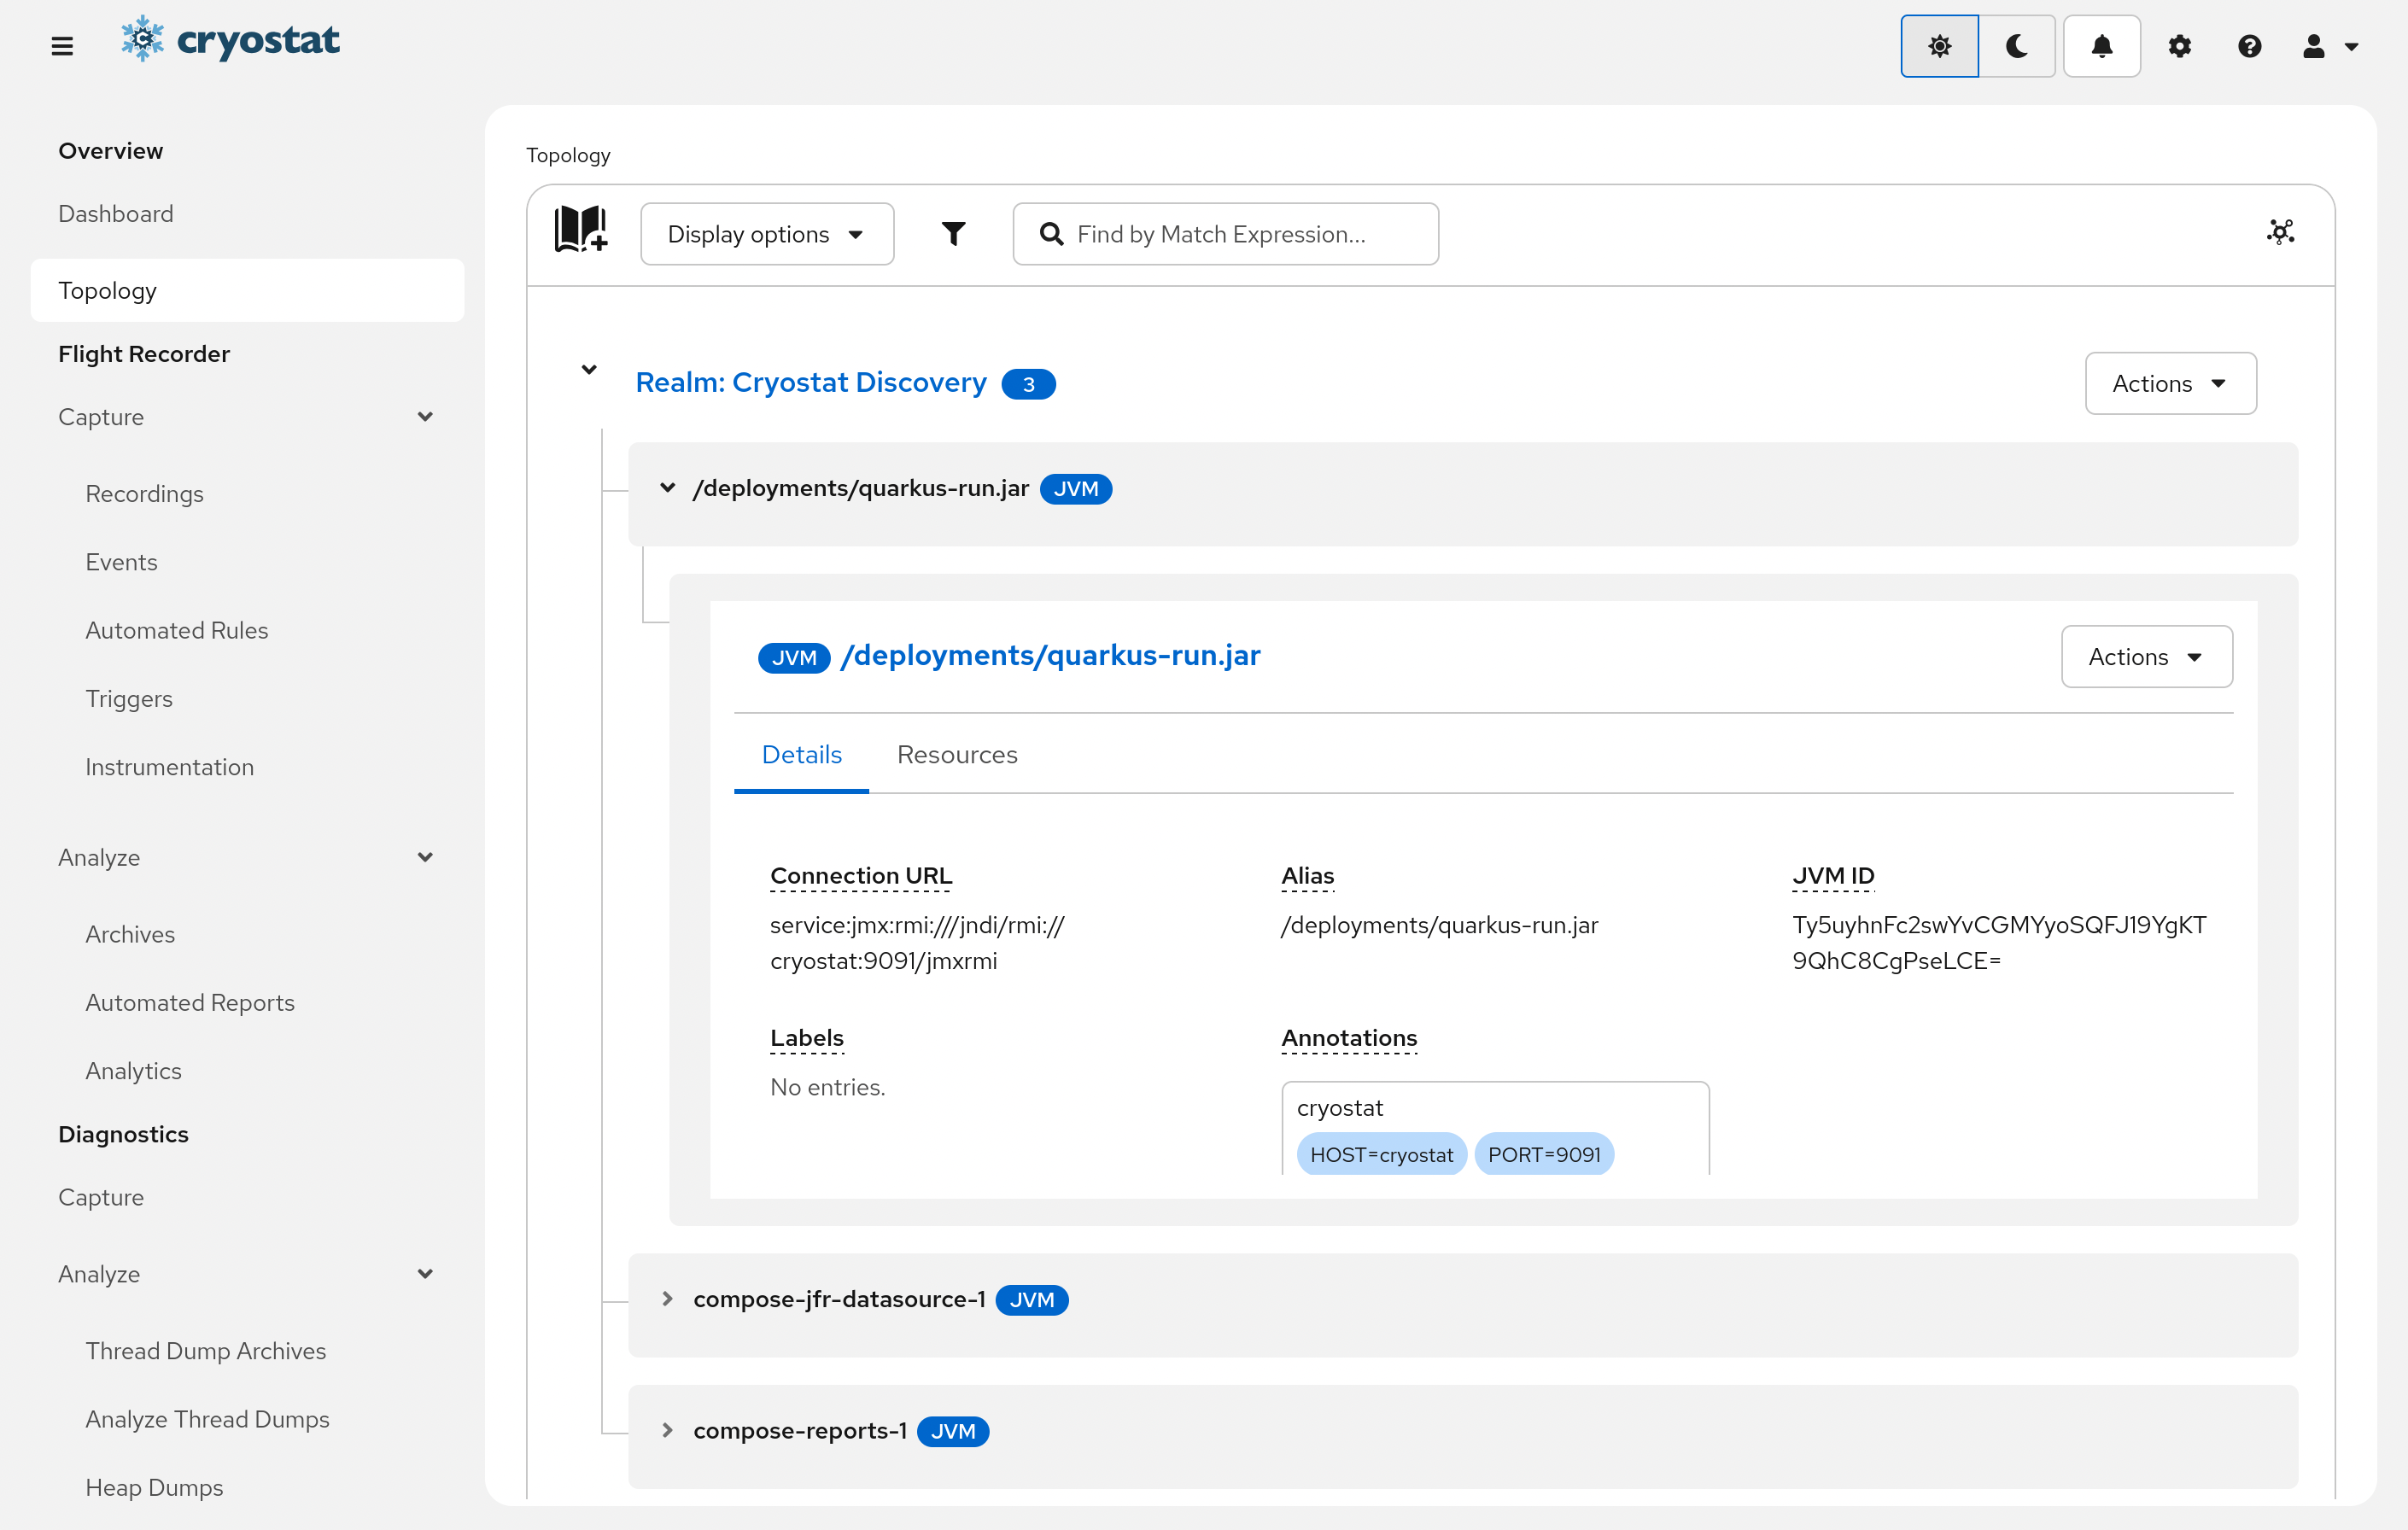
View JVM Applications with List ViewView JVM applications with Topology List view.Topology View also supports List View mode, where your JVMtargets and their groups are shown as expandable rows.
Click the List icon on the toolbar to switch to List View. Expand each row to see nested groups or targets. All the above features of the toolbar can also be used to customize your view.
View JVM DetailsView targetJVM’s details with drawer panel.
In Graph View, select a targetJVMnode to open the drawer panel that shows its details, for example, Connection URL, Labels and Annotations.
In List View, expand each row to open nested groups until you find the target. Expand the target to see its details and associated resources.
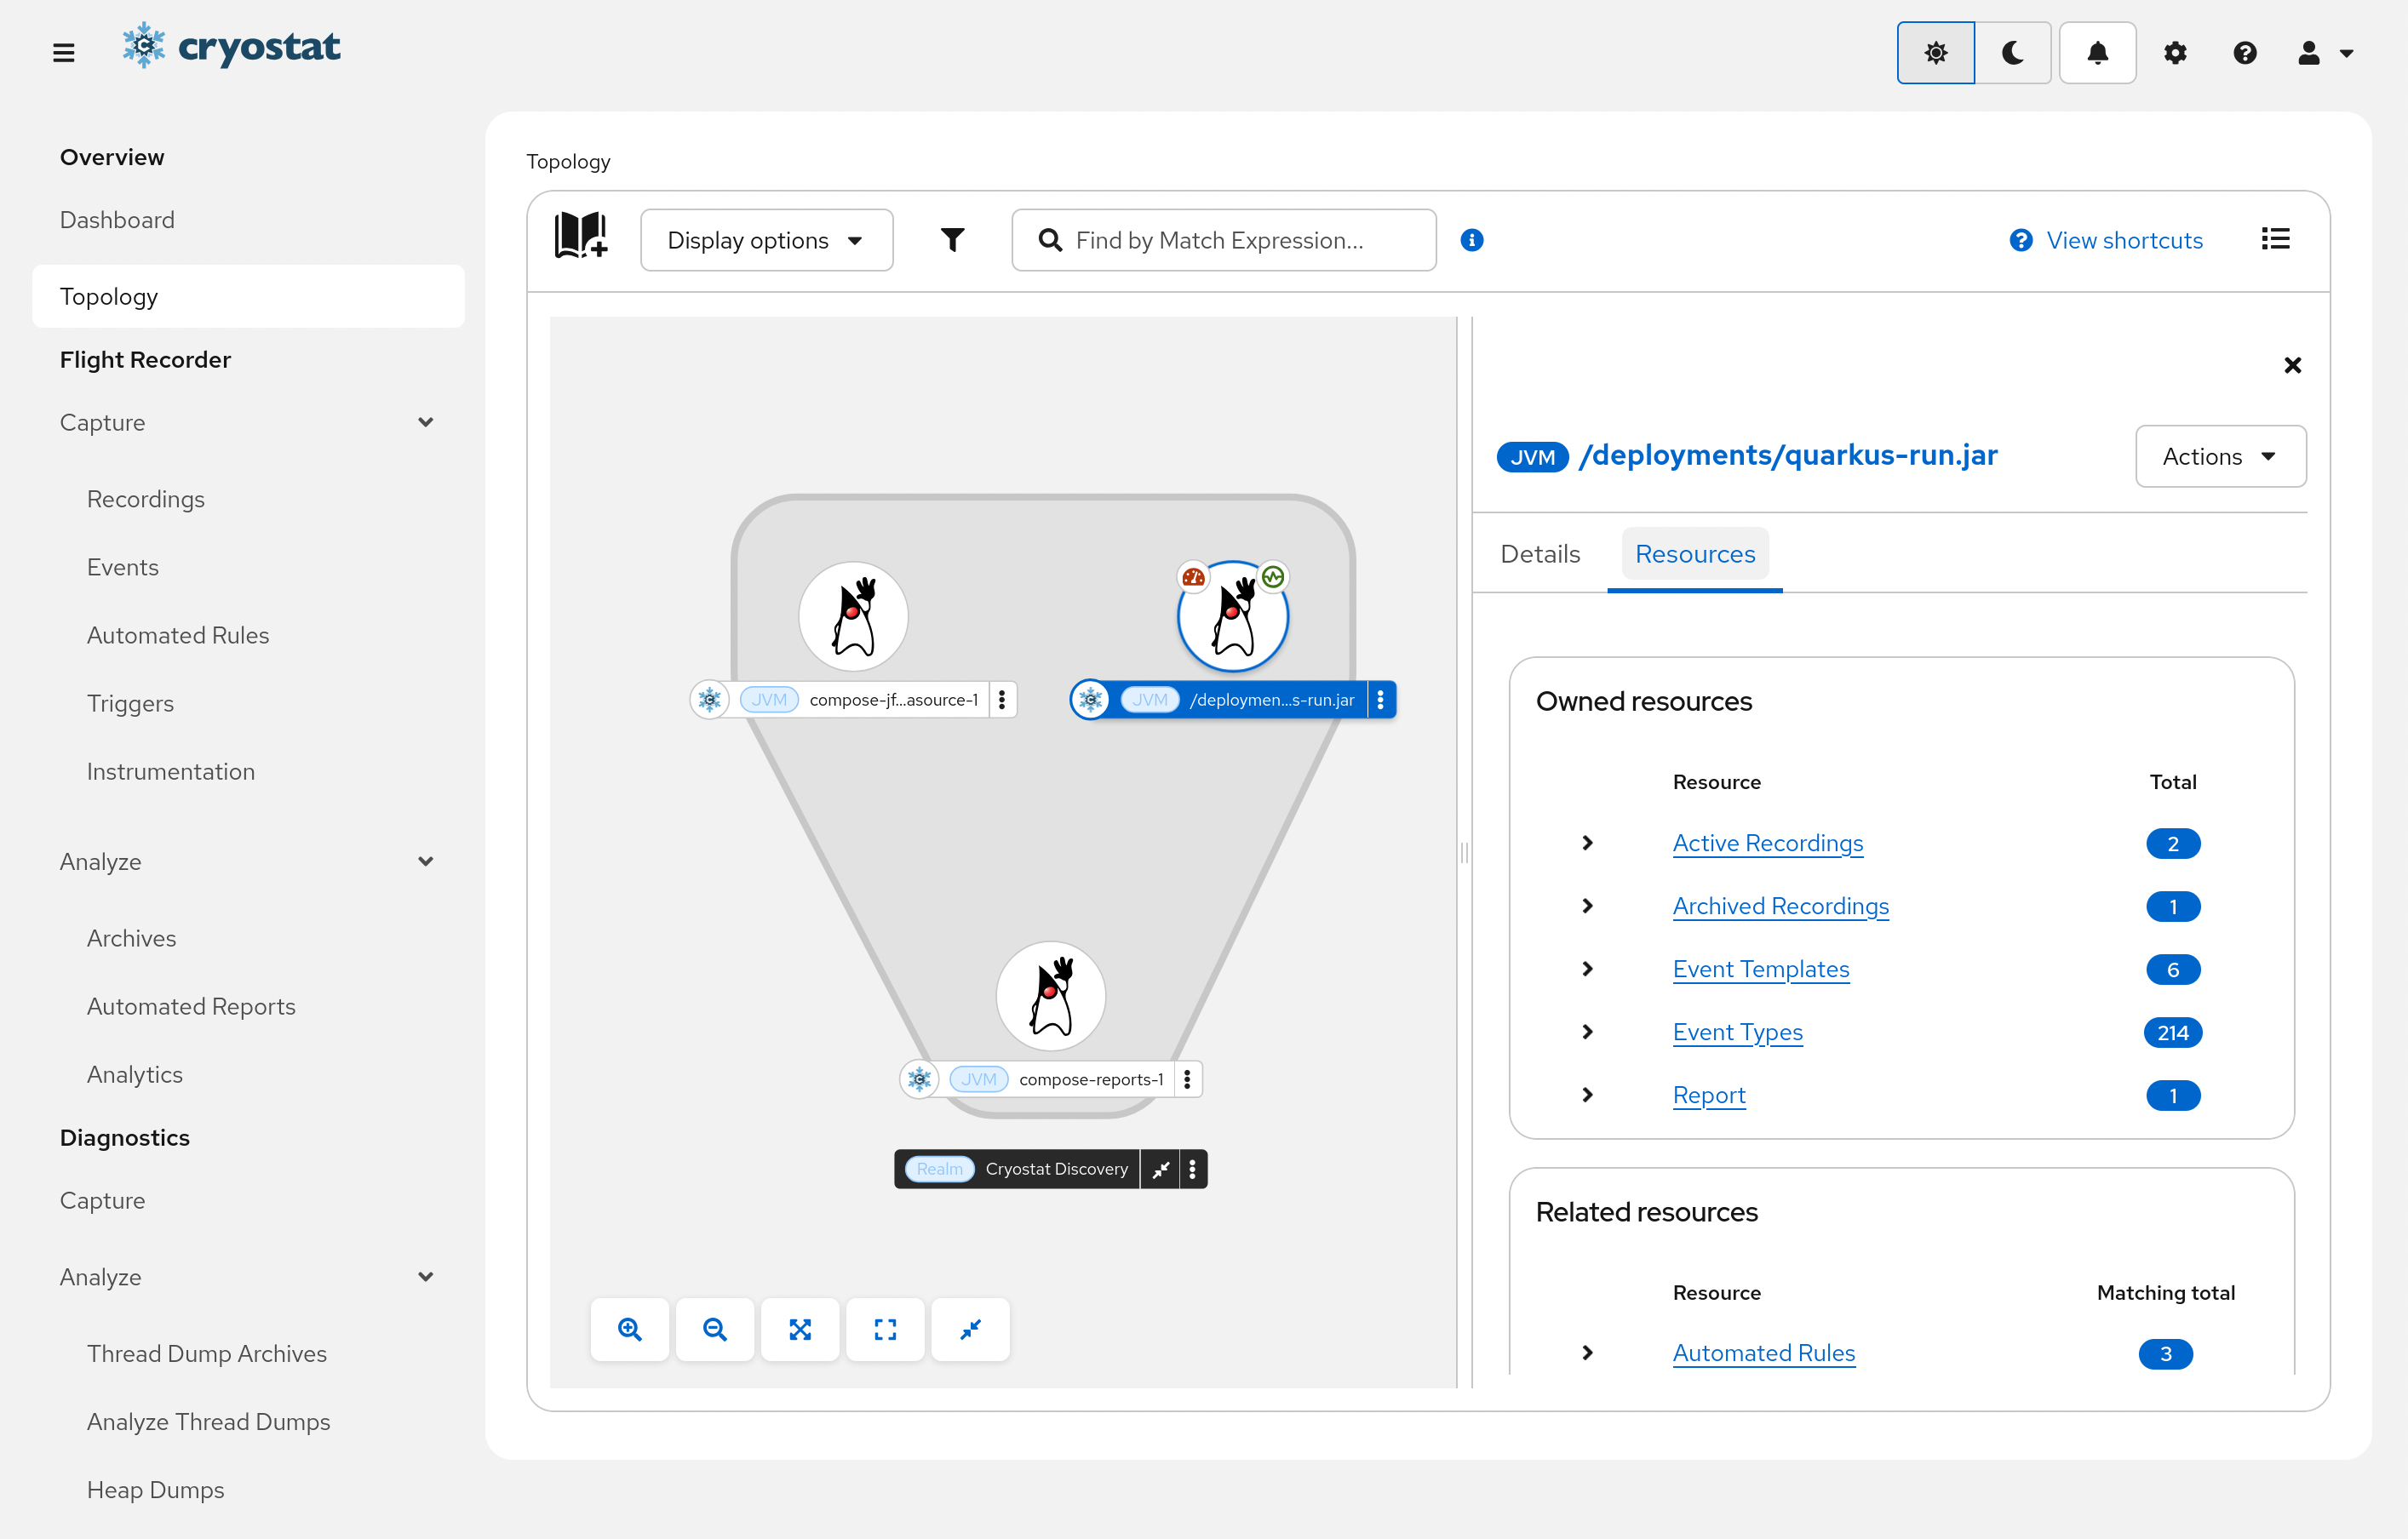
View JVM's Associated ResourcesView JVM's associated resources with drawer panel.
Navigate to the Resources tab to see the target’s associated resources. There are 2 tables:
Related Resources: Resources that are tied to the JVM by Match Expression (i.e. Automated Rules and Credentials).
In the Graph View, each target node also has an indicator that tells whether the target has any running Active Recordings. The same information can be seen within the Owned Resources table by expanding the Active Recordings row.
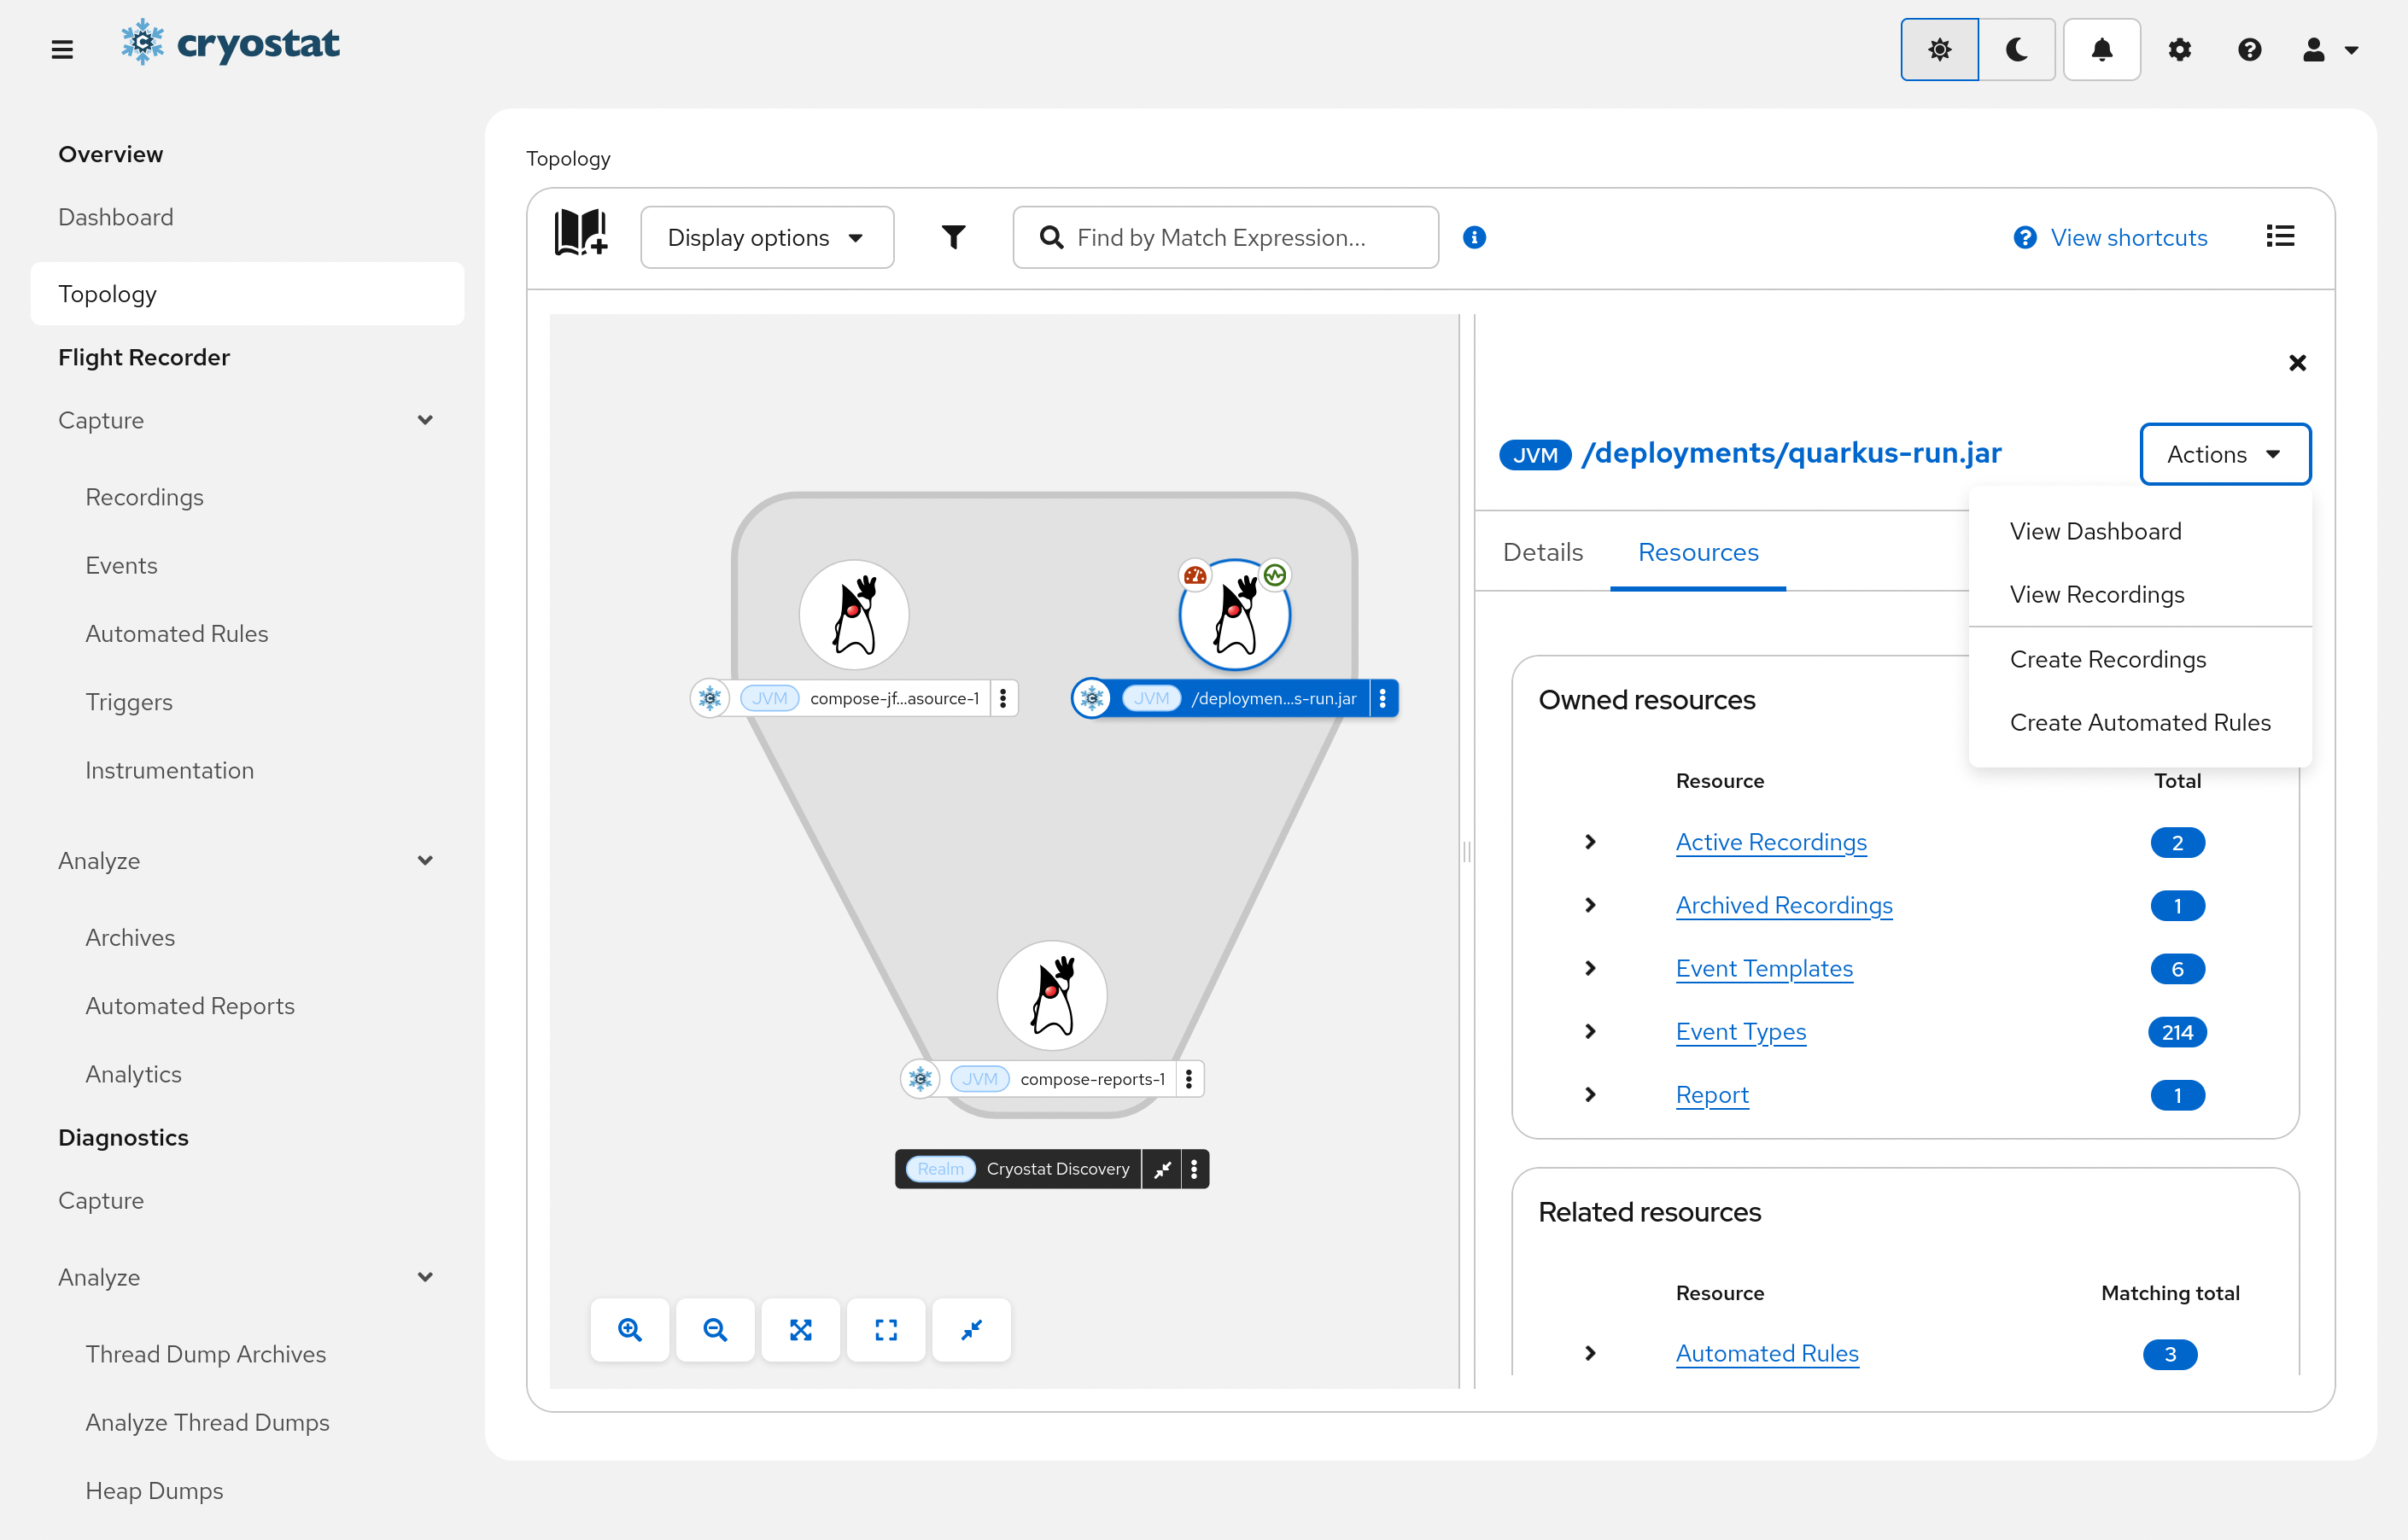
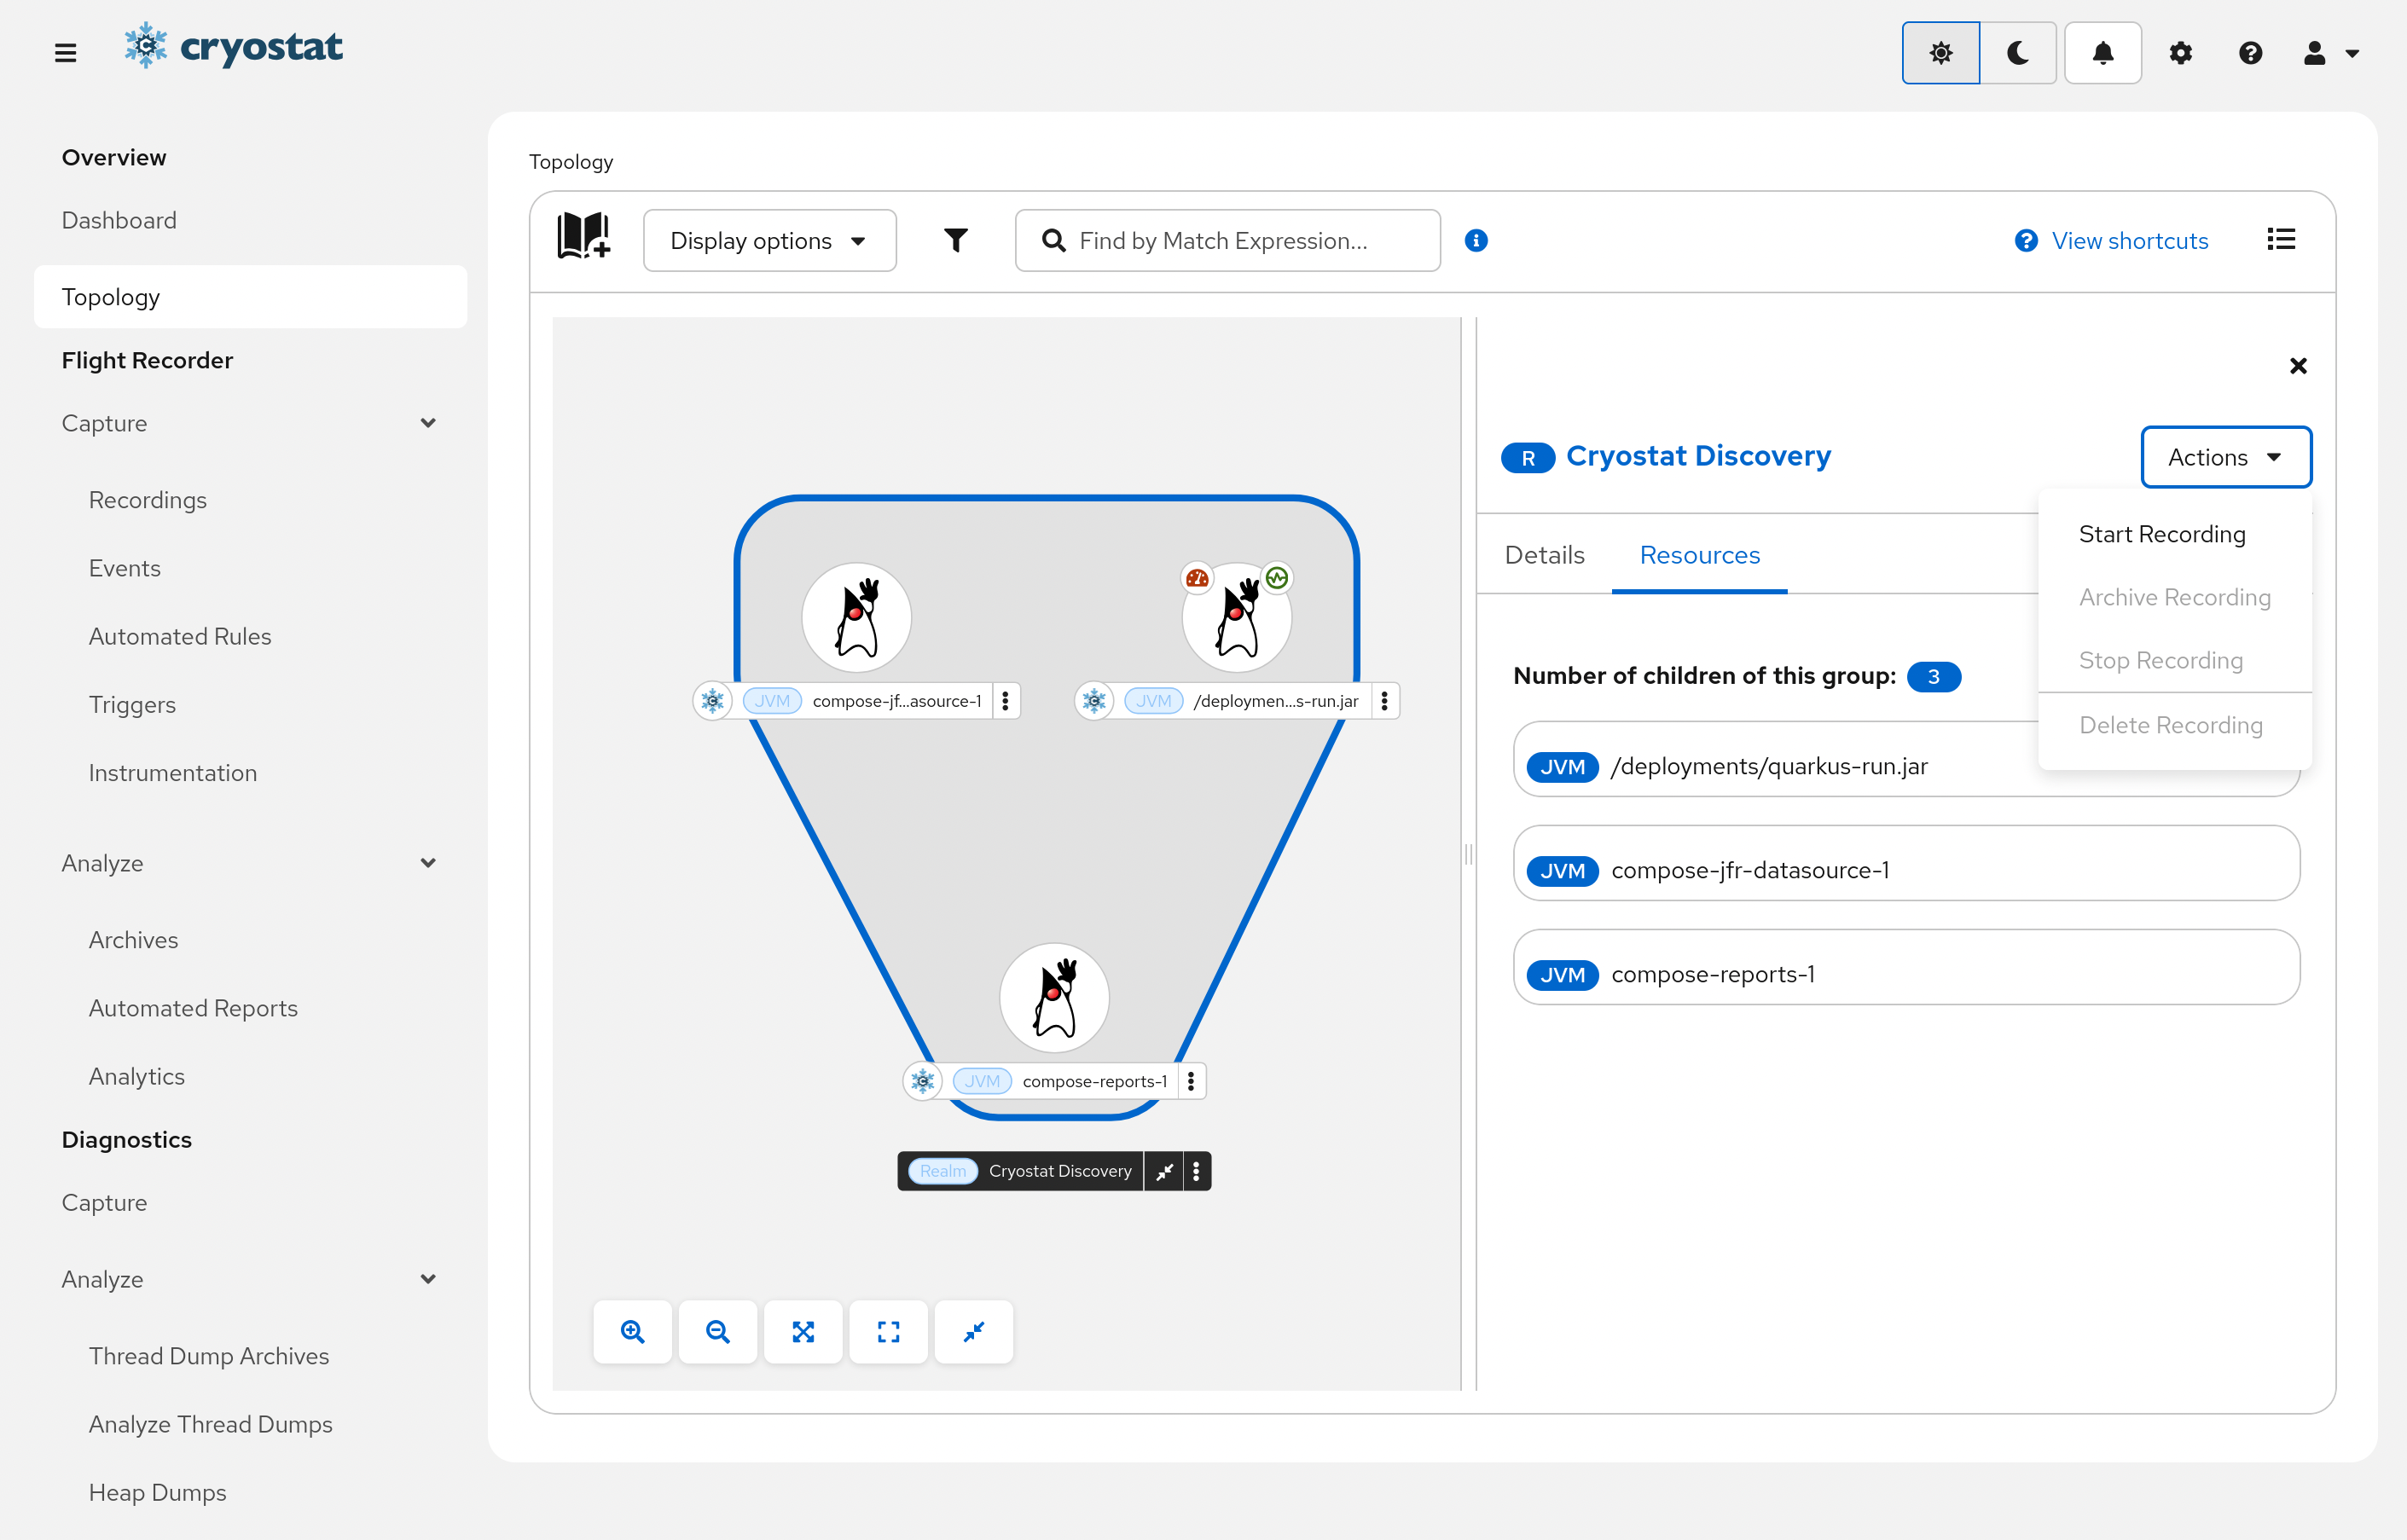
Perform Actions for a Single JVMPerform actions on an individual JVM.
The details panel for each targetJVM supports performing simple actions on the JVM. Click the Actions menu to show available options.
For example, select View Recordings to be redirected to the Recordings View for the targetJVM, where you can view and manage Active Recordings.
Perform Actions for a Group of JVMsPerform actions on a group of JVMs.
The Details panel also supports performing actions on multiple targetJVMs. Select a group of targets, for example, a Pod. A drawer panel will appear to show the group details. Select Actions menu to show available options.
For example, select Start recording to start a Recording on all targetsJVMs under this group. If this action fails (for example, due to intermittent network issues) then it is safe to repeat this action again: the action will only start new Recordings or replace STOPPEDRecordings on targets under this group, it will not affect RUNNINGRecordings.
Cryostat automatically discovers targetJVMs using various mechanisms
(e.g. Kubernetes API, JDP, Cryostat Agent plugin).
However, in some cases it may not be feasible or desirable to configure your
application to suit Cryostat’s discovery requirements. In these scenarios
you can tell Cryostat about them by filling out the Custom Target form to
specify Custom Targets. This can also be used to have Cryostat register
itself as a discovered target by using the special value localhost:0, which
informs Cryostat’s JVM to use a special JMX connection to itself
without going through the network stack.
Navigate to Overview/TopologyUse the bottom Control Bar to adjust the Graph View as needed.
When you need to view or perform actions on multiple targetJVMs at the same time, Topology View is the way.
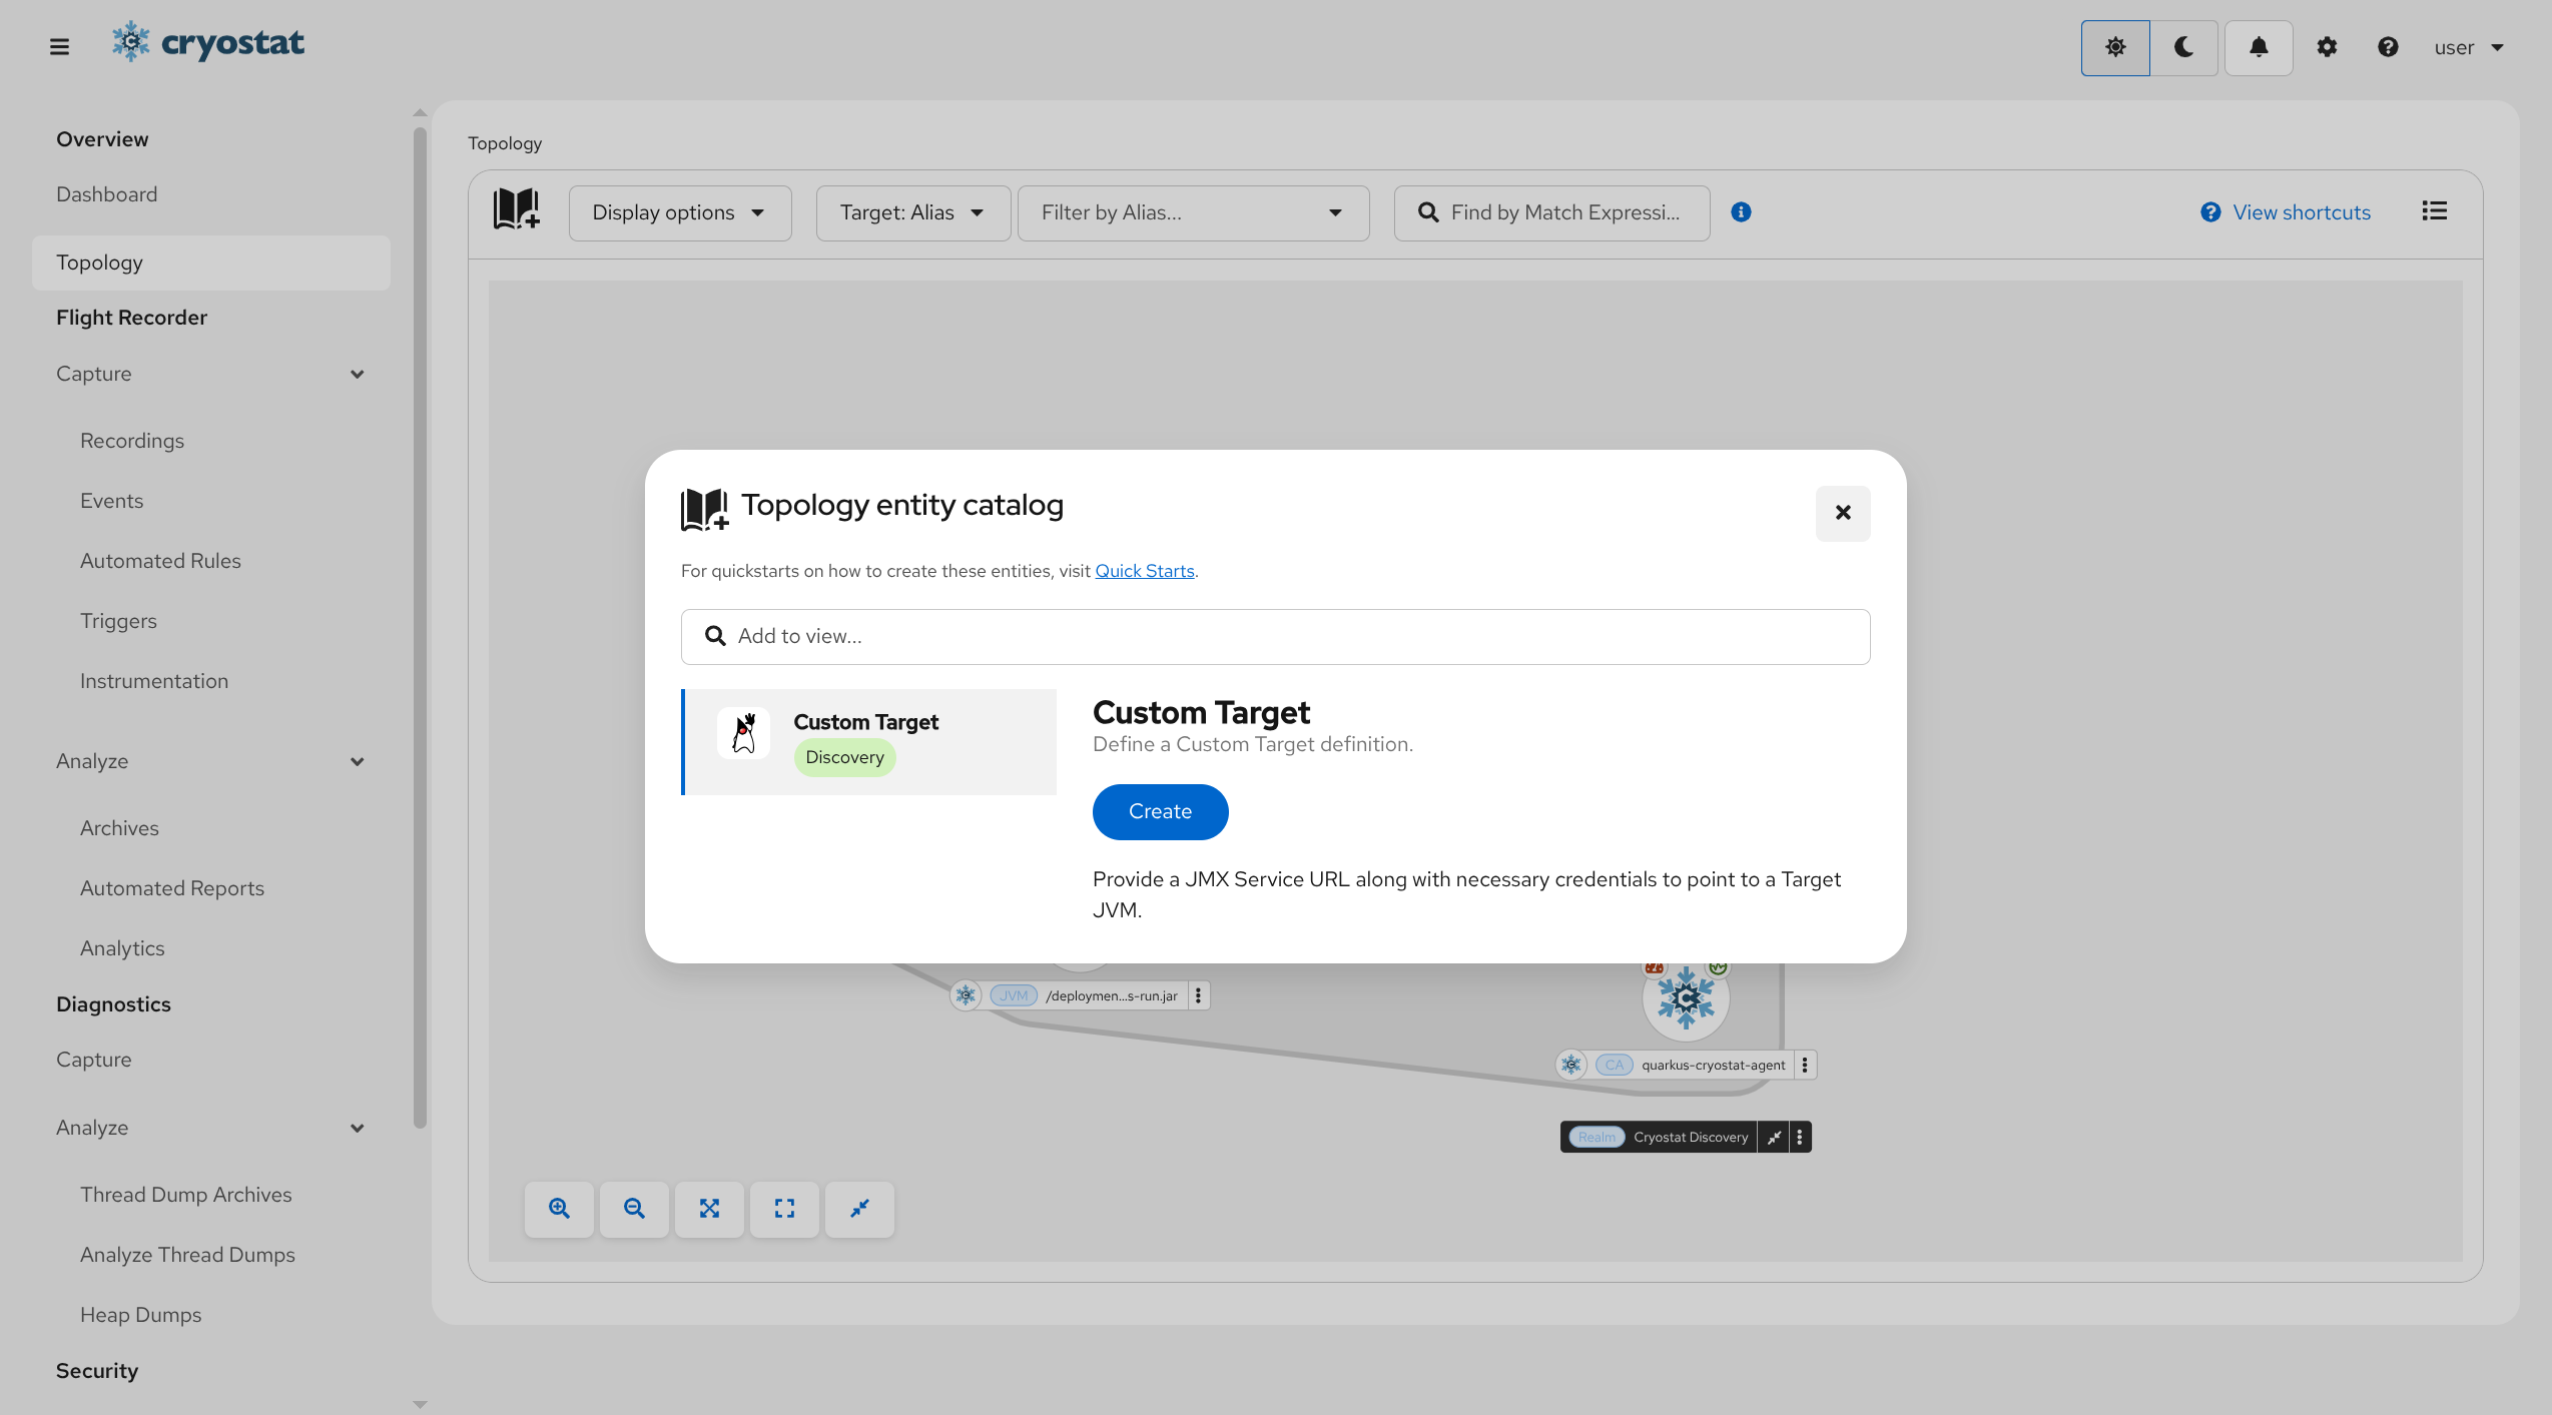
Open the Custom Target FormClick on Catalog Icon to open the Topology Entity Catalog.
Search for Custom Target tab and click Create to open the
Custom Target form.
Use the Custom Target form to tell Cryostat about JVM
applications that are not automatically discovered.
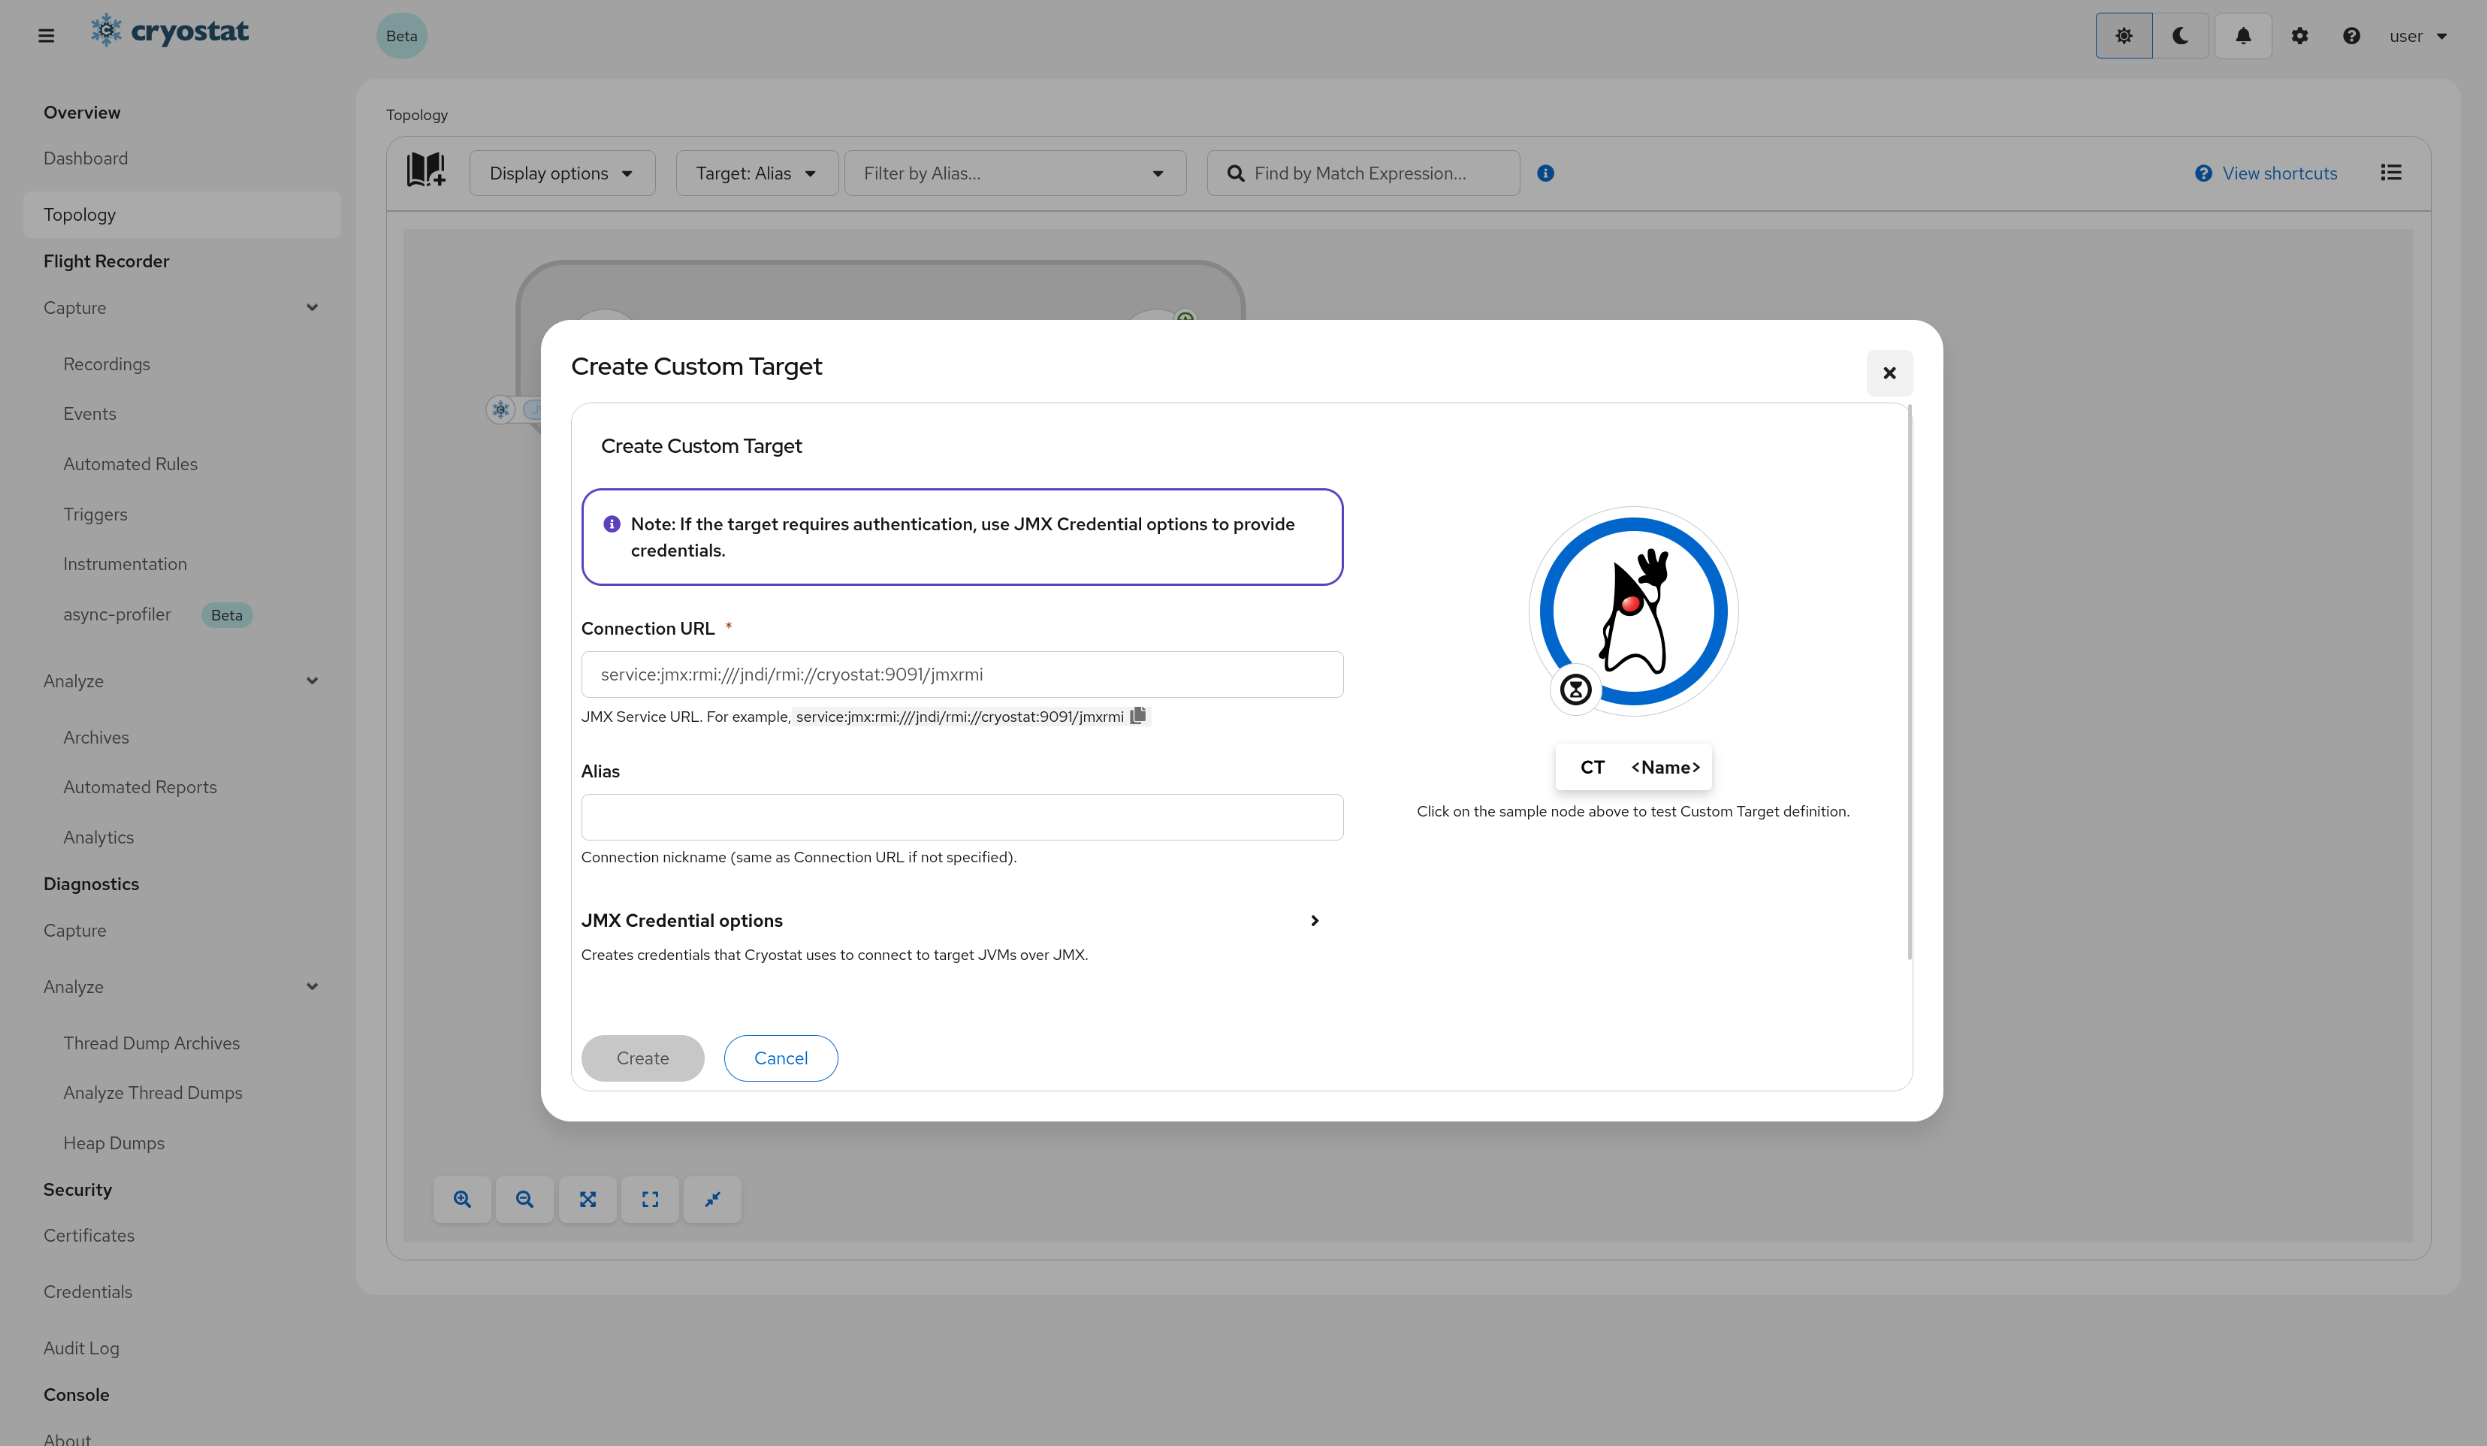
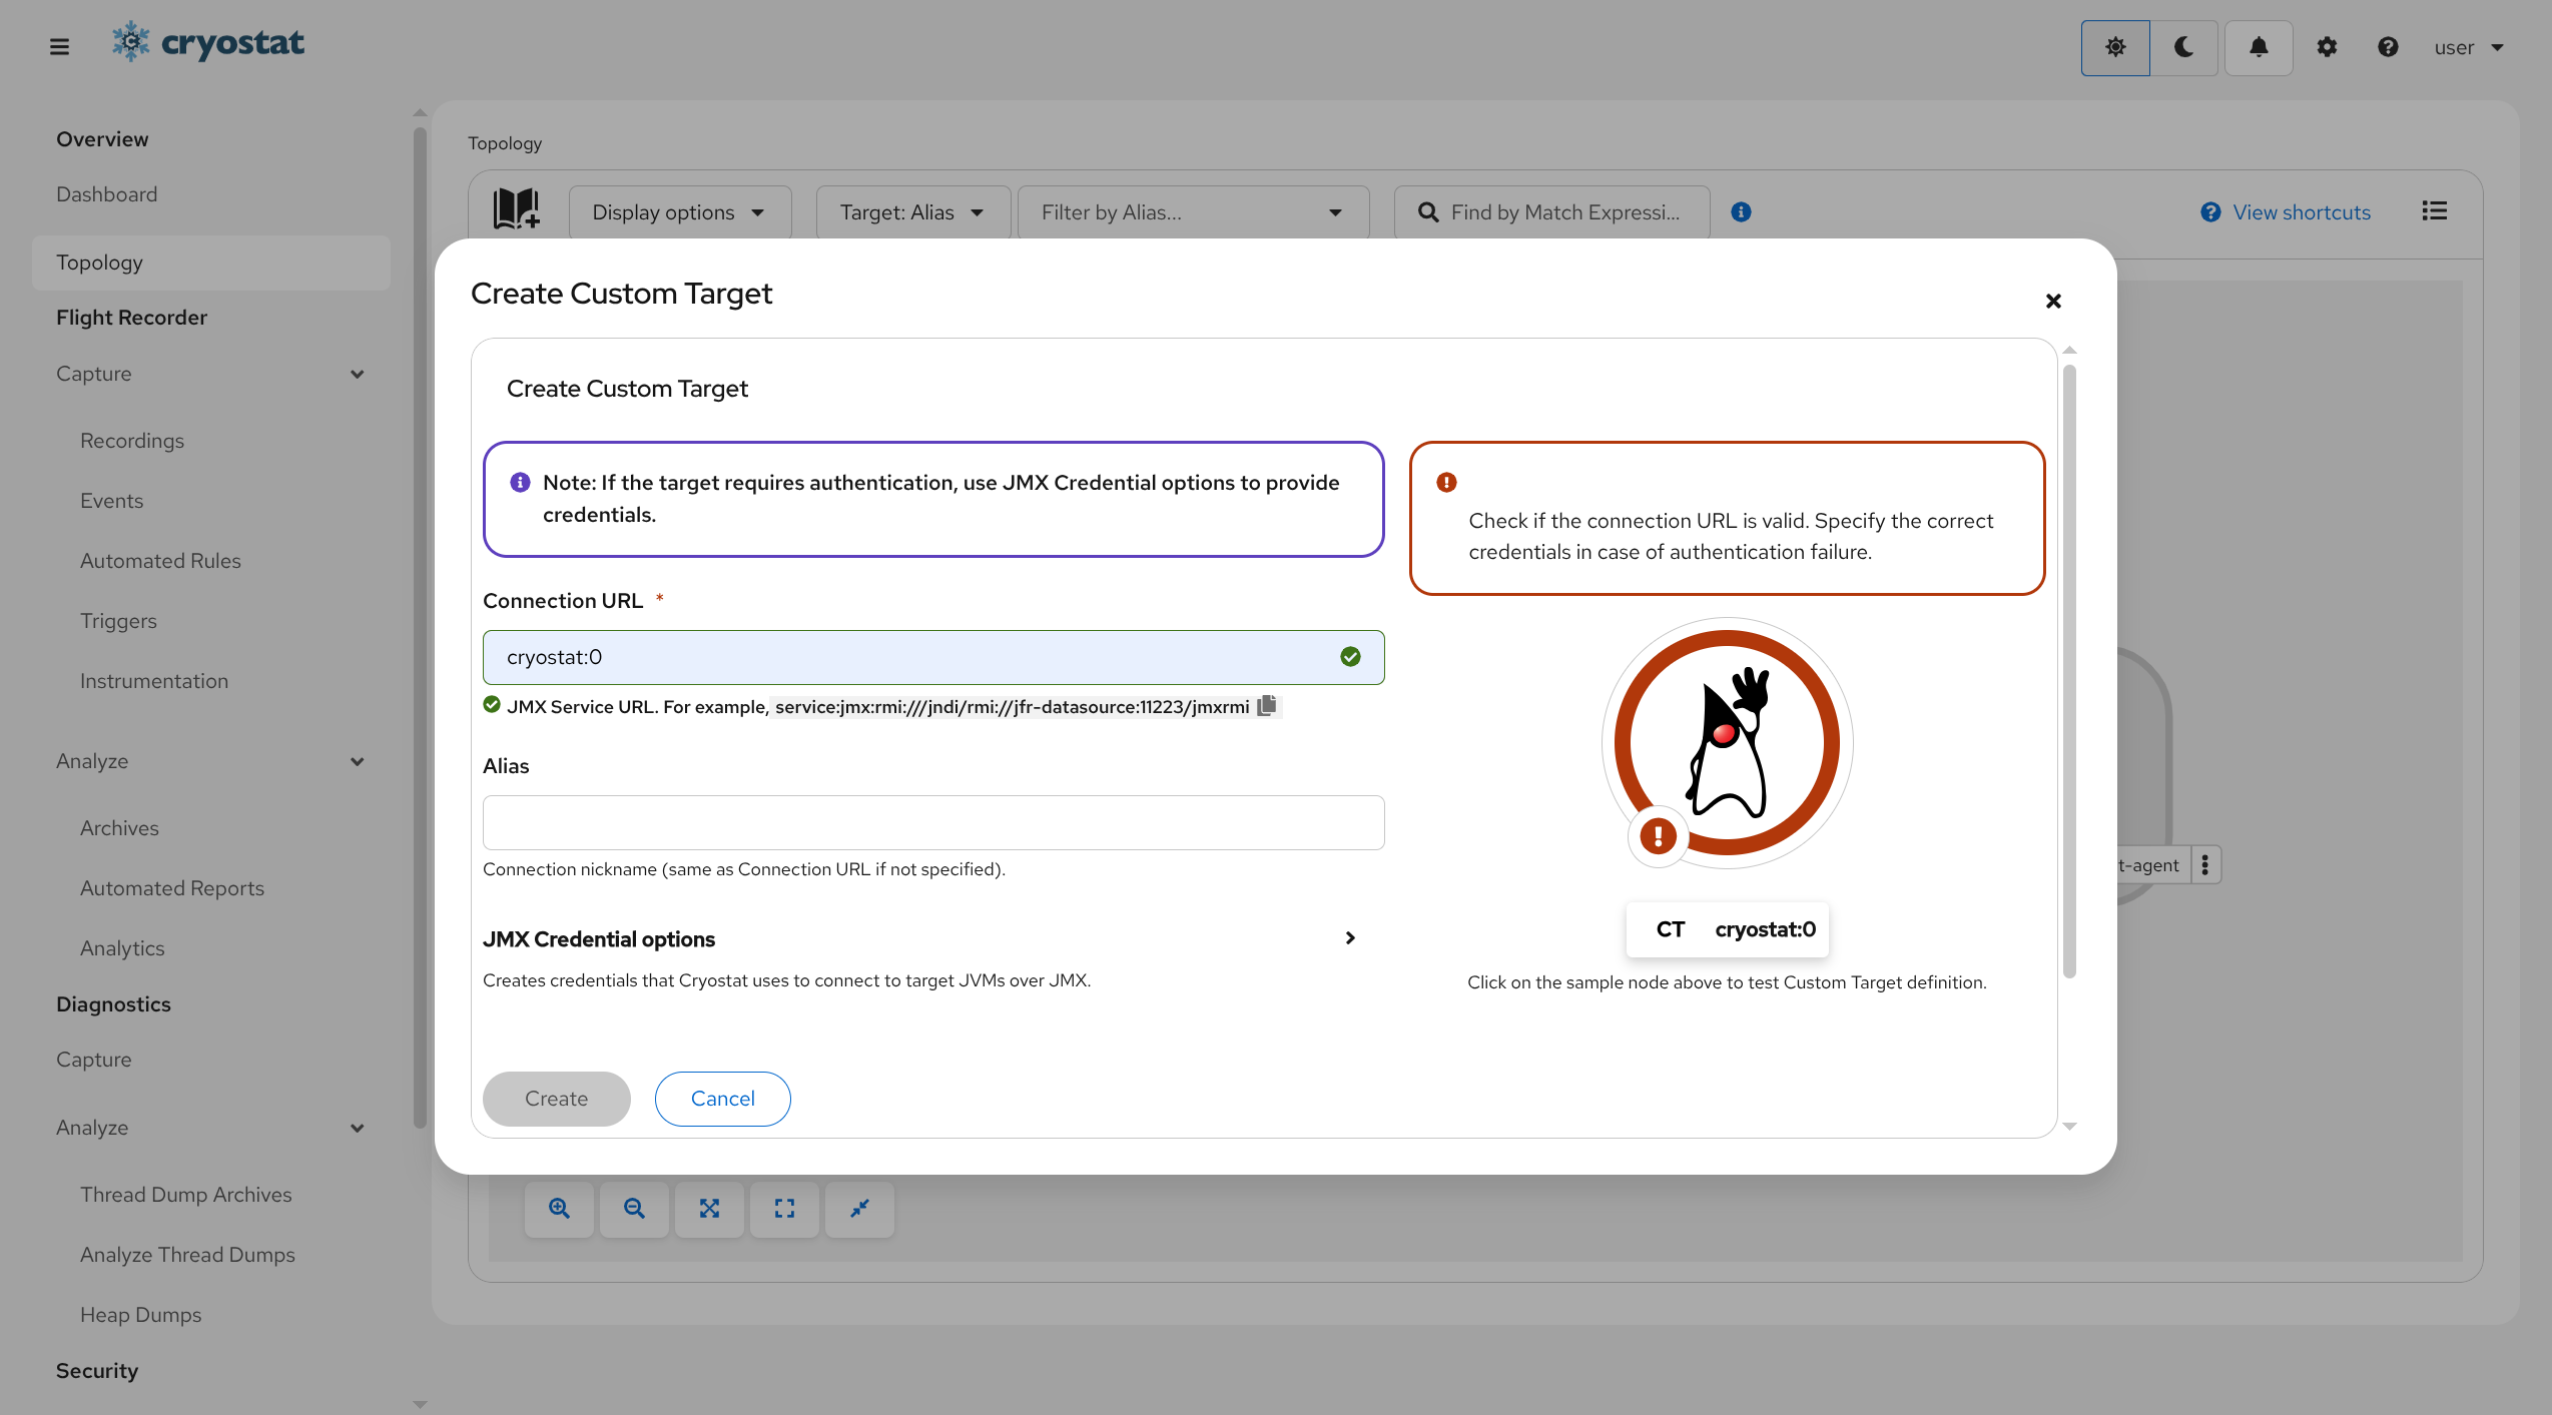
Enter Custom Target DefinitionUse the form to enter the Custom Target definition.
The Connection URL is required for Cryostat to attempt to
find the target. You can optionally provide an Alias or
JMX credentials if the target has JMX authentication enabled.
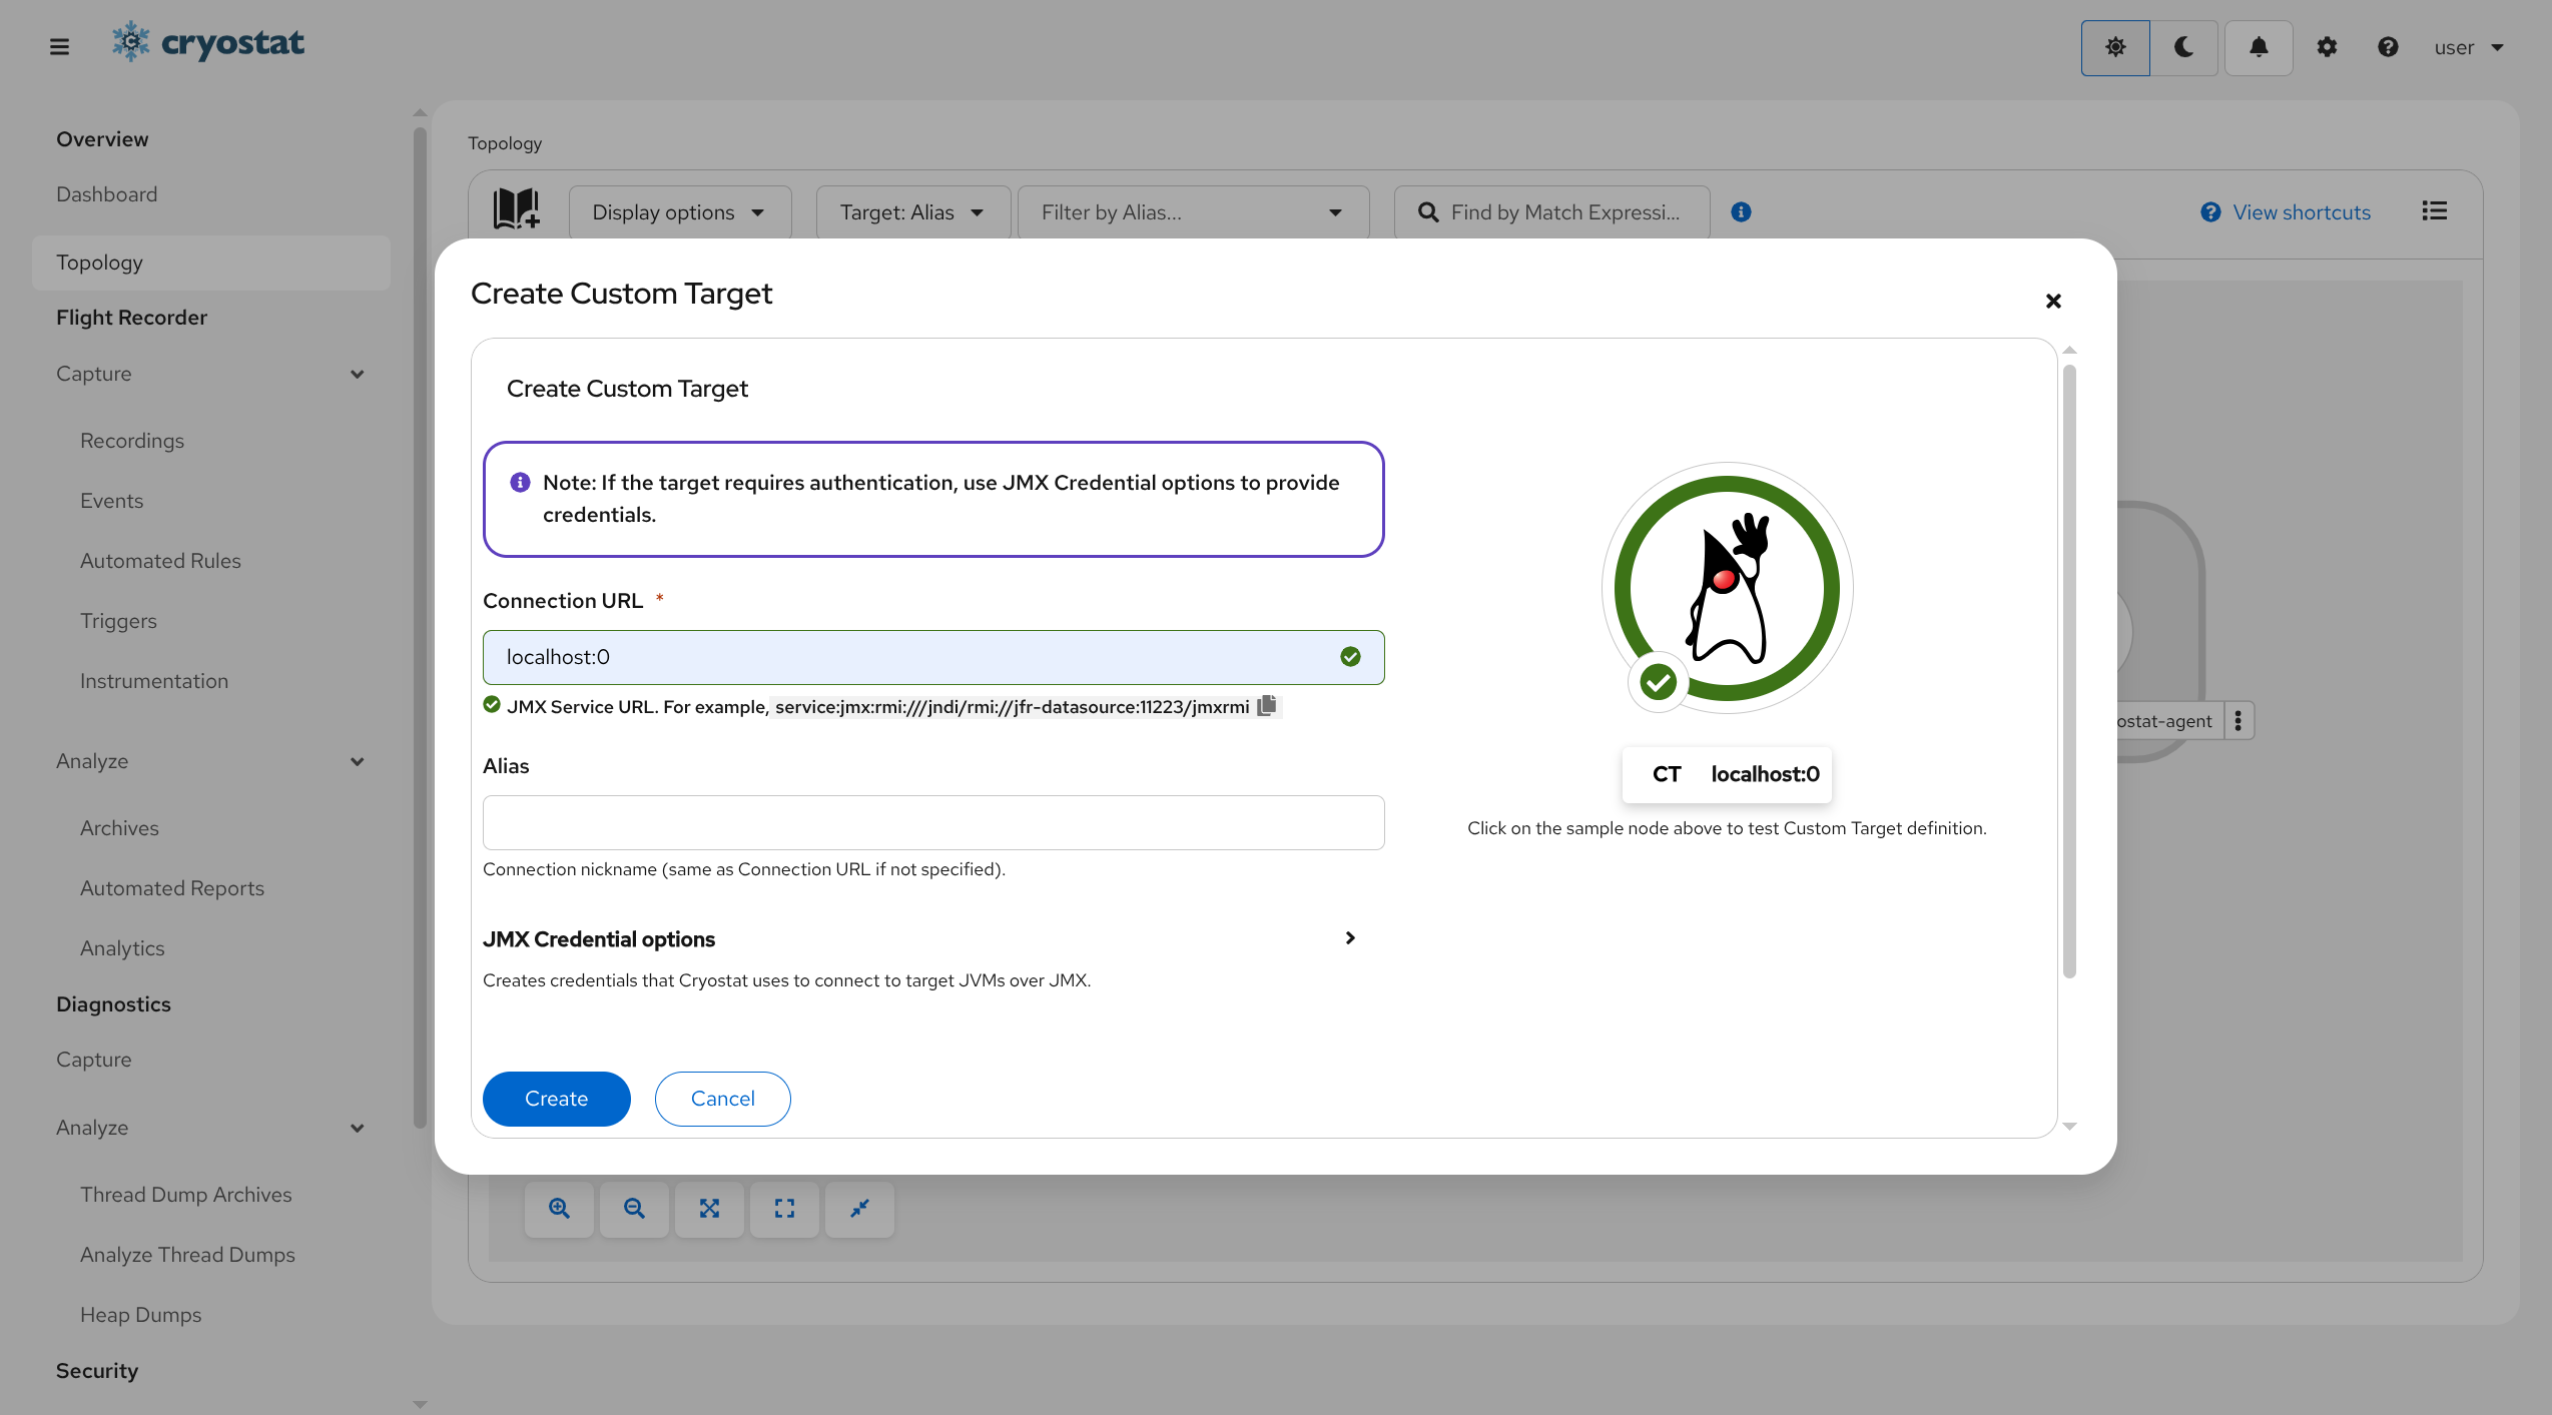
Test the Custom Target DefinitionA ✅ checkmark will show if Cryostat can connect to the sample app.
Once you enter a valid Connection URL, click on the sample node to test
the target connection.
An exclamation mark and an alert banner will show if an error
occurs while connecting to the target. This may
occur if the URL is incorrect due to incorrect hostname or
port number, or if the port is blocked by a firewall or network
policy, or if the JVM listening on the specified port requires
JMX credentials that Cryostat does not have in its keyring, or
if the JVM listening on the specified port presents an SSL/TLS
certificate which Cryostat does not trust. Cryostat will also
refuse to add new Custom Target definitions for targets that it
has already discovered by other means.
Click Create Button to Generate a New Custom Target
definition once the test is successful.
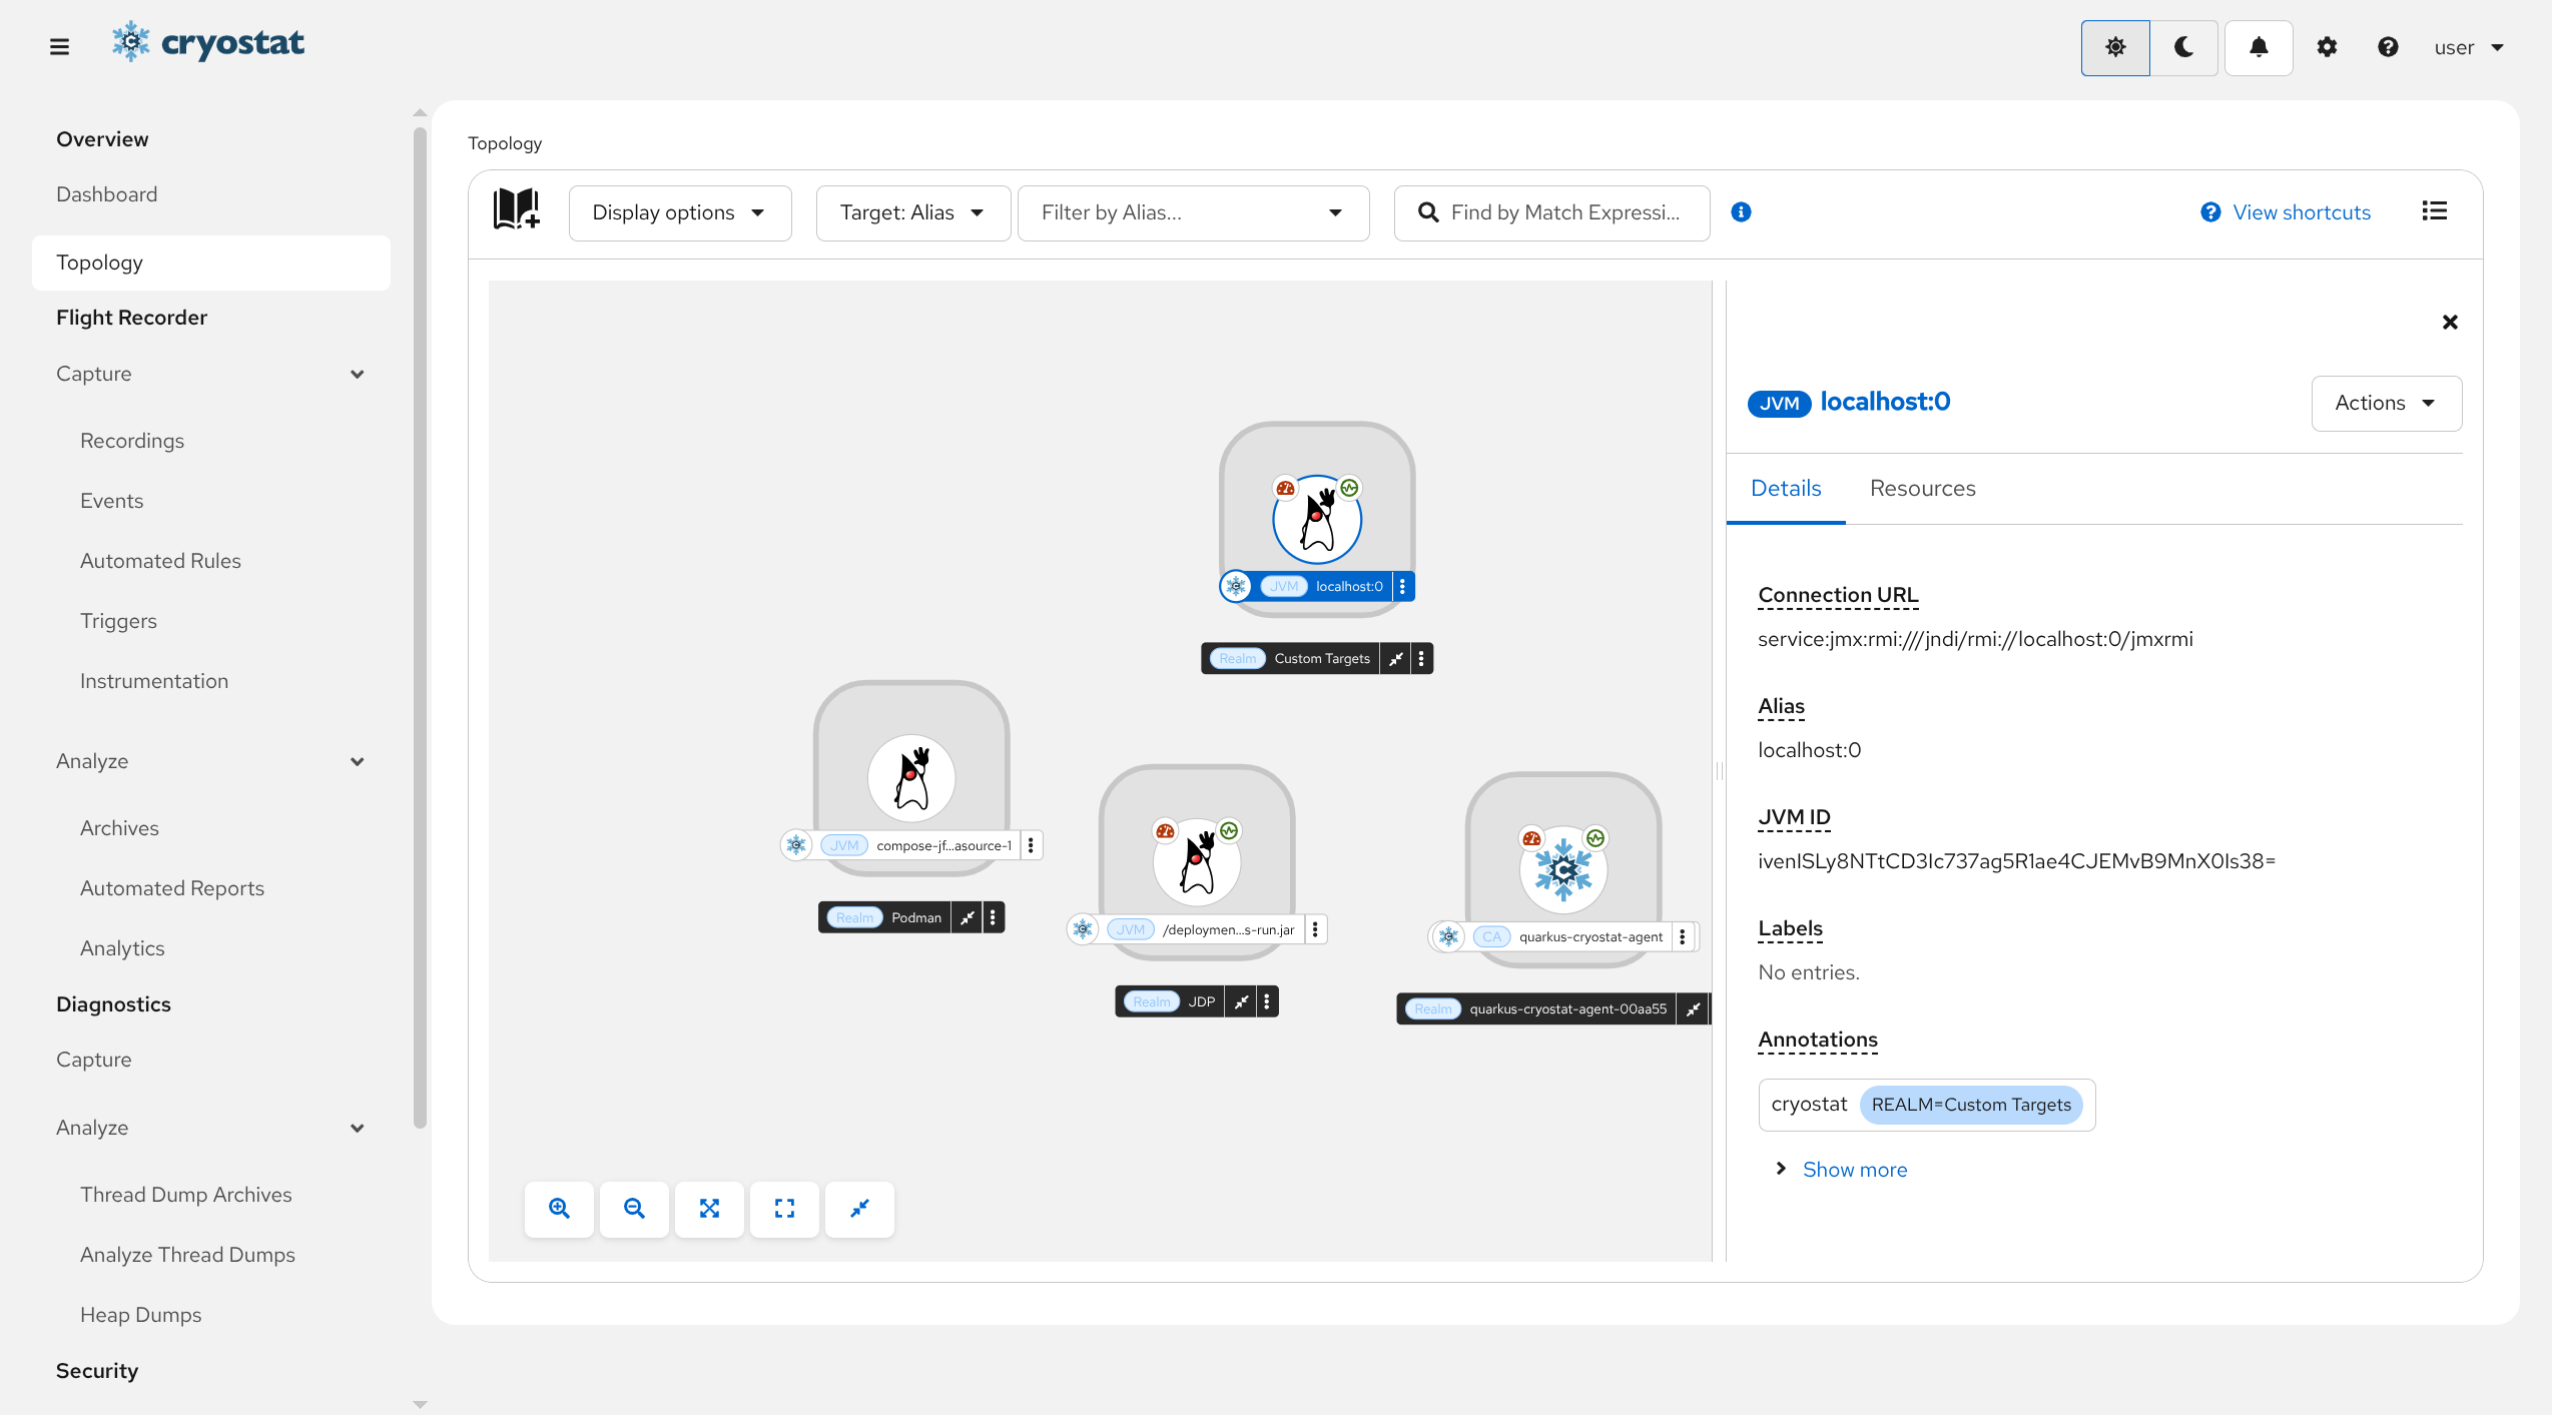
View the Custom TargetsThe Custom Target will be available under Custom Targets realm.
Once the Custom Target form is successfully submitted, you
will be redirected to the Topology View. Here, you can view your
target under Custom Targets realm.
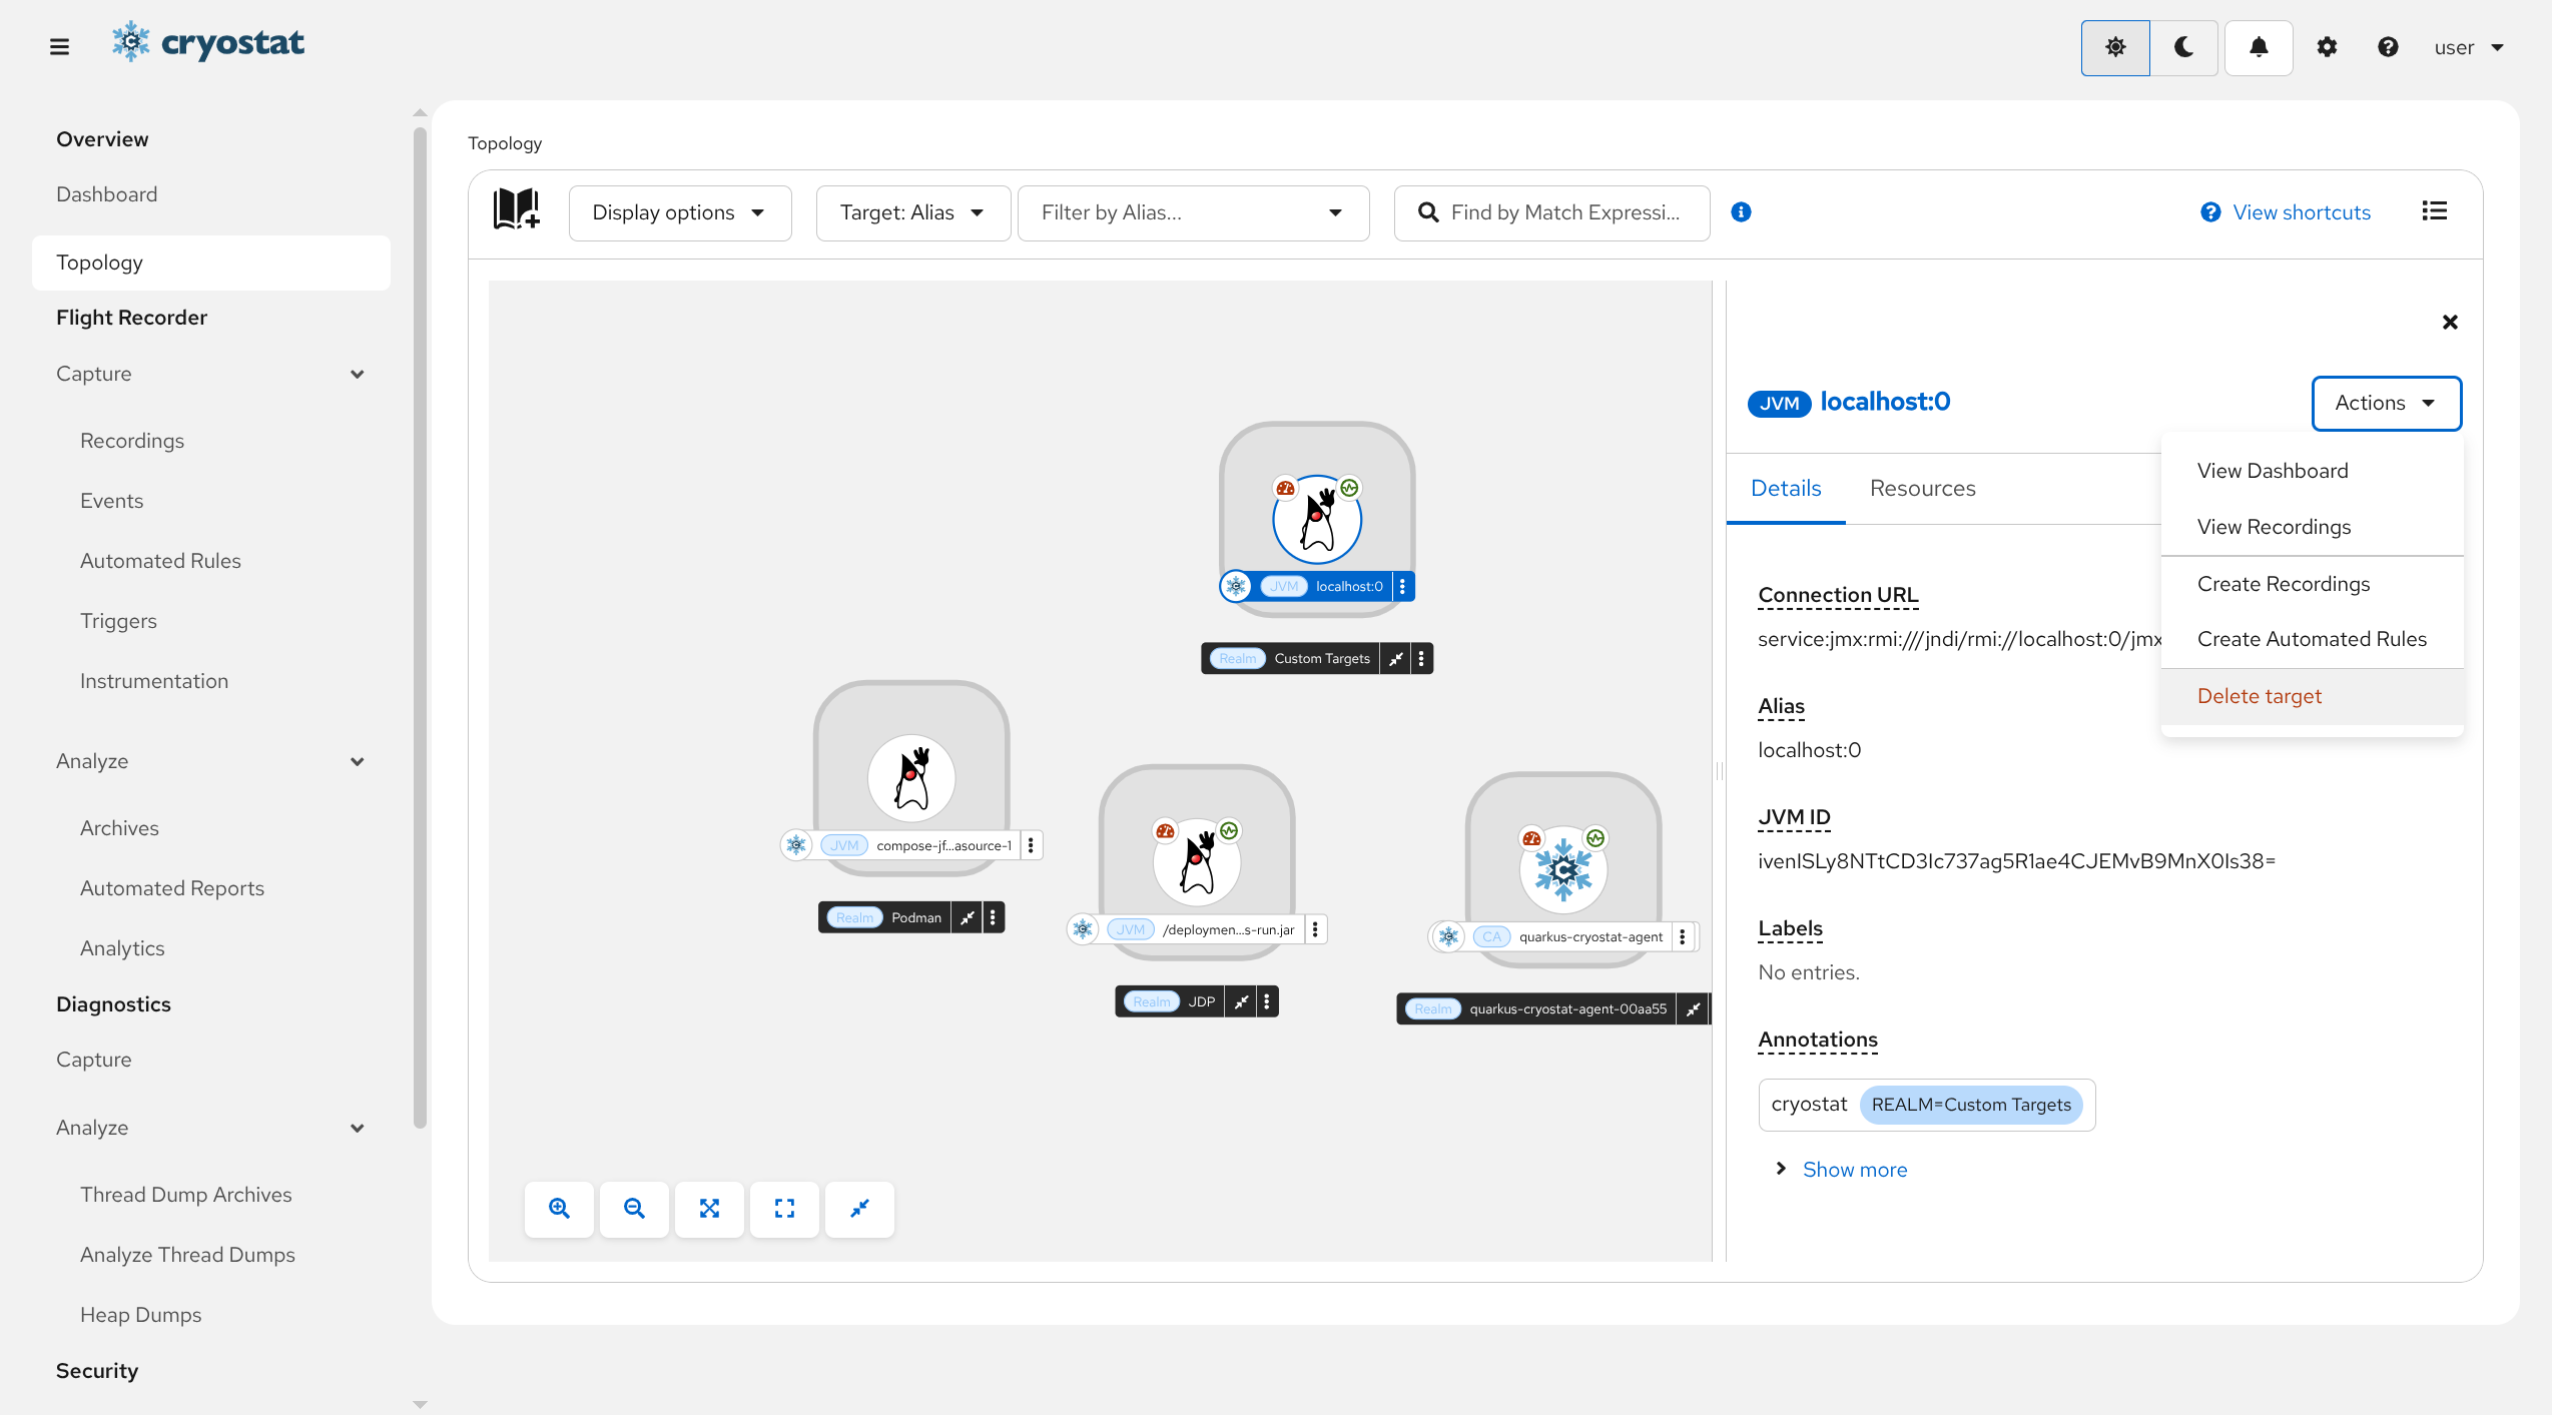
(Optional) Delete Custom TargetsCustom Targets can be cleaned up with Actions menu.
If the Custom Targets is no longer needed, in the target detail
panel, click the Actions menu and select Delete Target.
Cryostat Agent supports custom triggers that are based on MBean metric values. You can configure Cryostat Agent to start JFRRecordings dynamically when these custom trigger conditions are met.
You can set up a custom trigger condition in Cryostat to initiate Java Flight Recorder (JFR)Recordings dynamically. This trigger condition is based on MBean counters, covering various runtime, memory, thread, and OS metrics. The condition includes MBean counter types and allows specifying a duration for the trigger to activate only if the specified values persist for that duration. Cryostat’s Agent supports smart triggers, which continuously monitor MBean counter values. When the current values match the configured conditions for the specified duration, the trigger initiates a JFRRecording dynamically through the Cryostat Agent.
Note: A JFRRecording will not start dynamically if the custom trigger condition associated with this Recording is not met.
When you configure your target application to load the Cryostat Agent, you can define one or more custom triggers that are then passed as arguments to the Agent.
For more information, learn how to use the Cryostat Agent.
The preceding example trigger instructs the Agent to start a JFRRecording if the ProcessCpuLoad metric has a value greater than 0.2 for a duration of more than 30 seconds: This example also instructs the Agent to use the Profile event template for the JFRRecording.
Using a JVM System Property Flag
The following example shows how to specify a simple custom trigger by using a JVM system property flag:
This example uses the same custom trigger criteria as the preceding examples.
Using a Configuration File
Smart Triggers may also be defined using a text file, then passing an environment variable or configuration property to the cryostat agent specifying the path to the file with the smart trigger definitions:
This example uses the same custom trigger definition as the previous examples, written to a file called trigger-definitions.txt
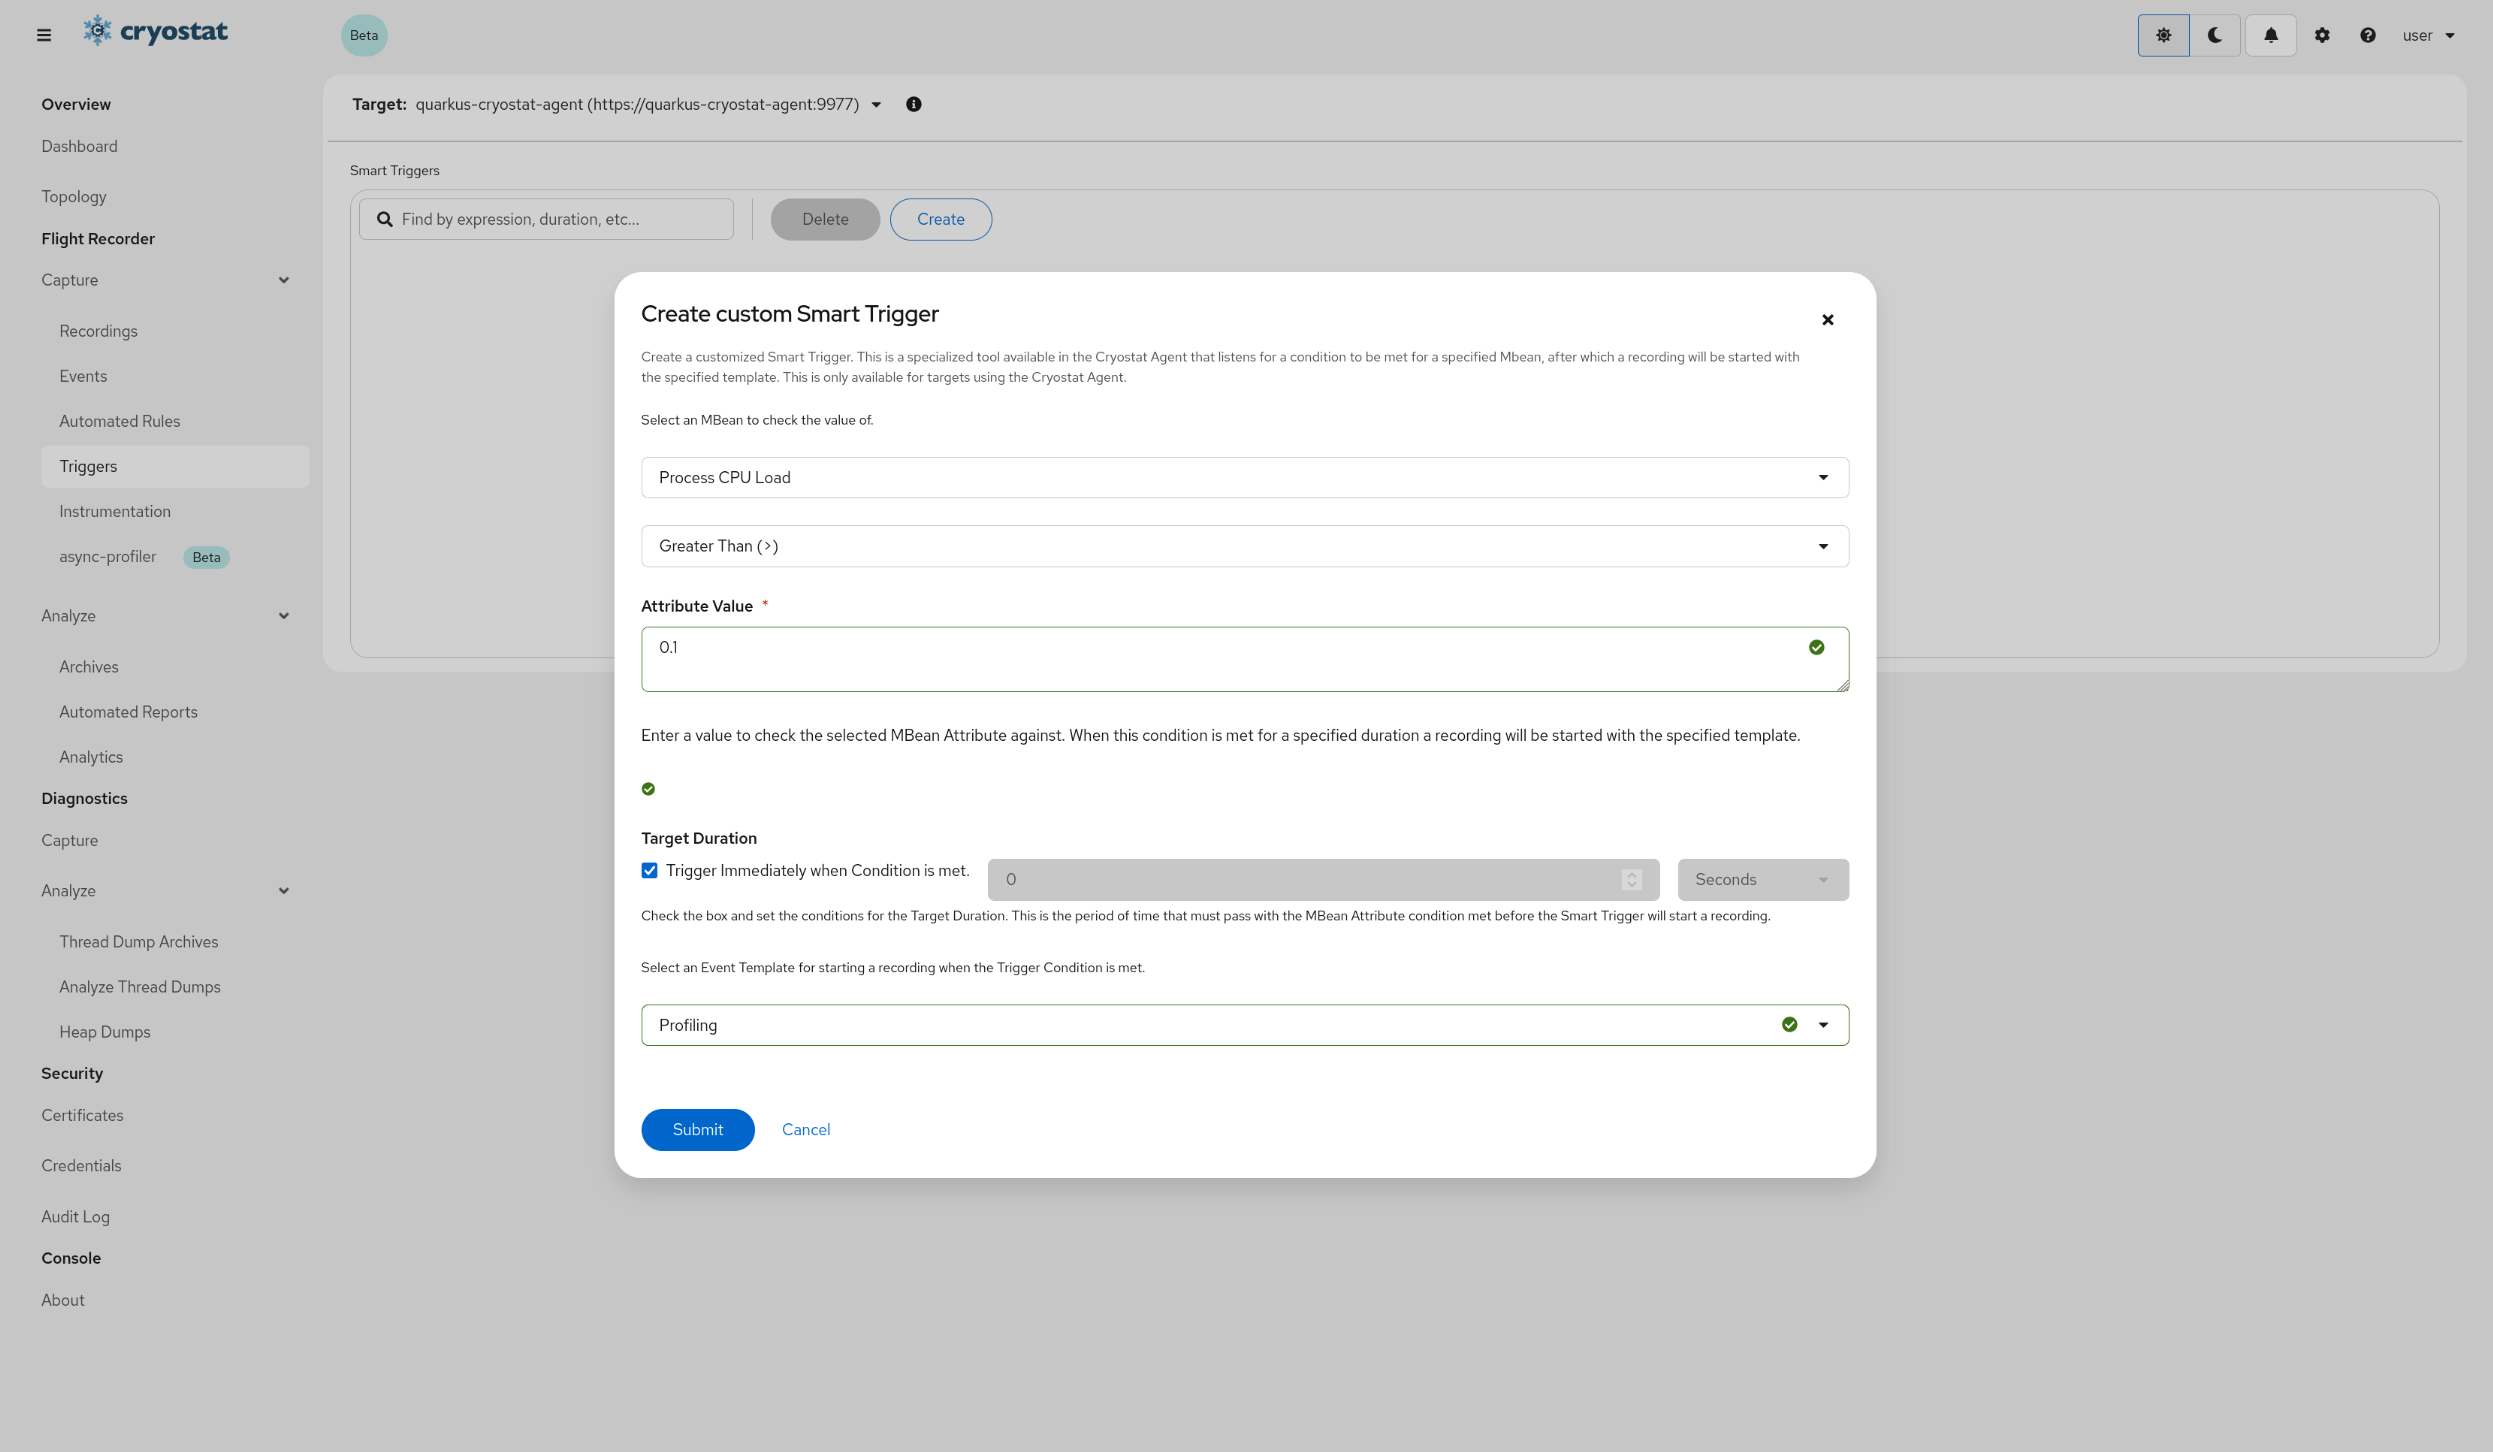
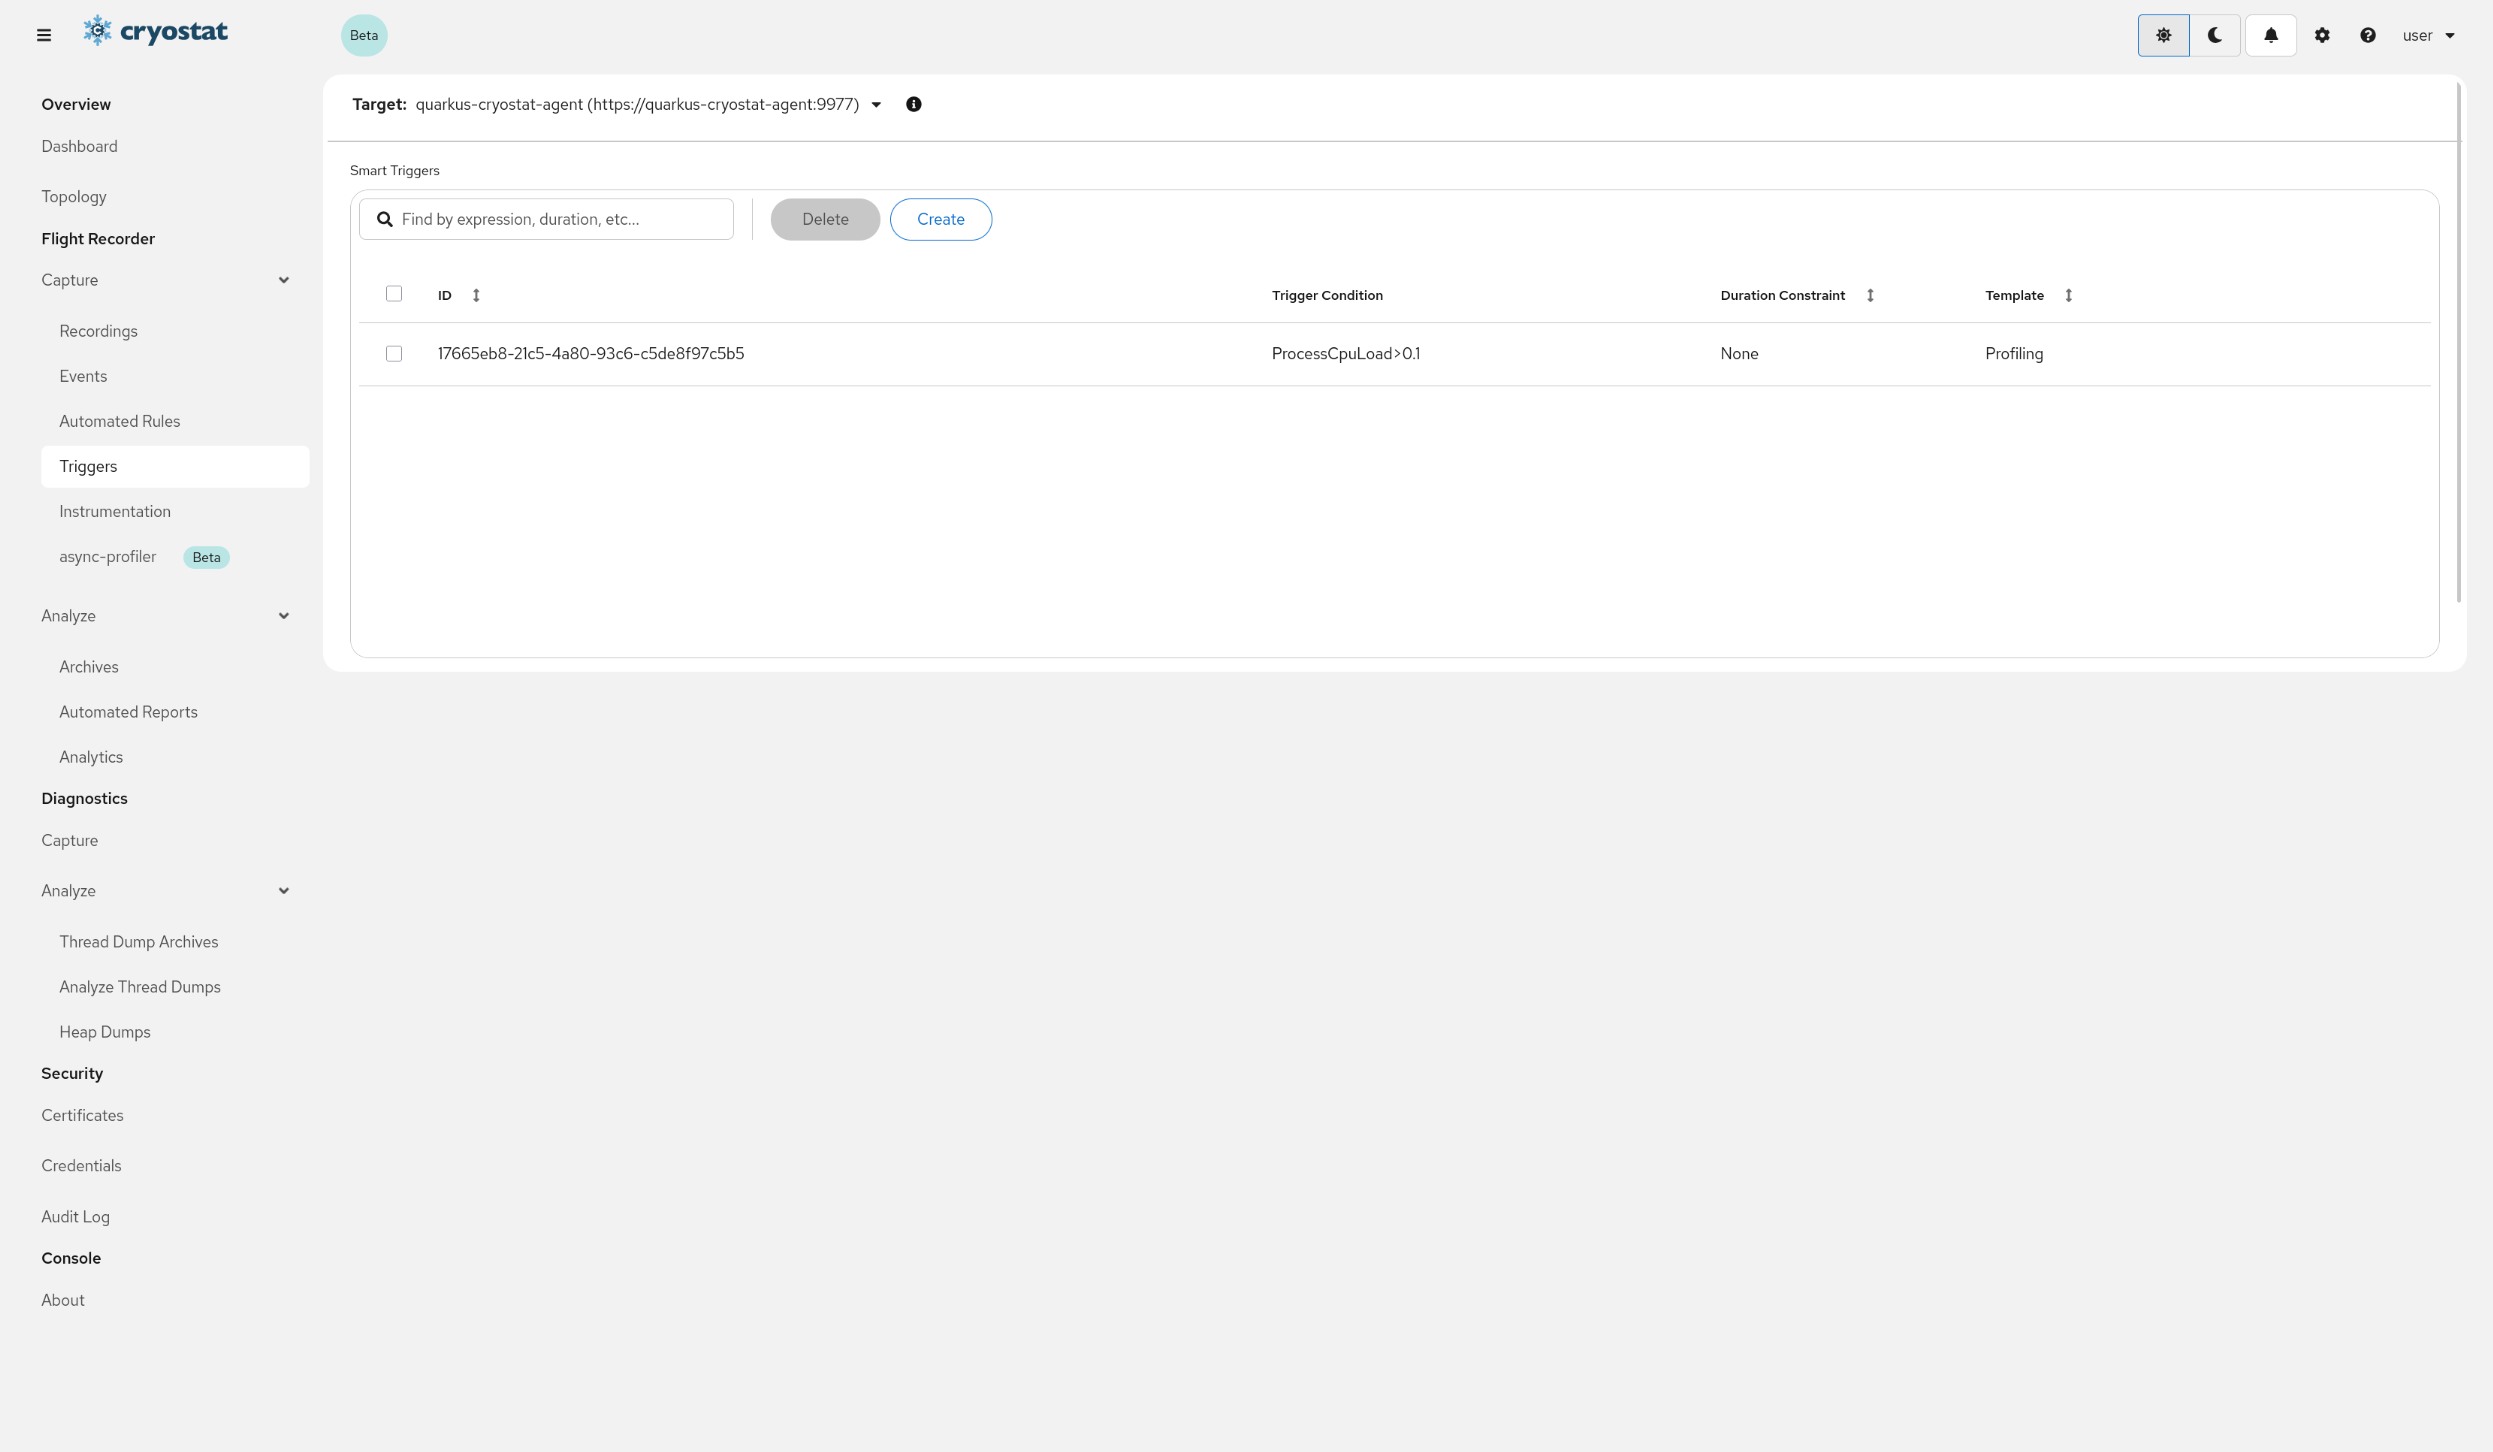
Using the Cryostat UINavigate to the Capture/Triggers view
After navigating to the Capture/Triggers page and clicking the Create button, a form will be displayed allowing for the creation of smart triggers. Simply select the MBean Attribute for the trigger and set the condition, then select a target duration if desired and select an event template to be used. Custom event templates may be used as well as the built in templates. For more information on the available MBean Attributes, see Supported MBean Attributes.
View active Smart Triggers
Once the Smart Trigger has been created it will be displayed in the table, showing the conditions that must be met as well as the Recording Template used for starting a Recording once conditions are met. From this table, the user can filter by any of the displayed attributes (ID, duration, condition, template), for instance entering Profiling will display any active Smart Triggers using the Profiling template. Triggers may also be deleted, stopping them from activating.
Consider the following syntax guidelines for defining custom triggers:
A custom trigger definition must consist of both an expression that defines the overall trigger condition and the name of an event template that is used for the JFRRecording.
The entire trigger expression must be enclosed in square brackets. For example:
The name of the event template must be defined after the trigger expression and preceded by a tilde (~) character. For example:
~profile
A trigger expression can consist of one or more constraints and a target duration. The set of constraints and target duration must be separated by a semicolon (;) character.
Each constraint must include: the name of an MBean counter; a relational operator such as > (greater than), = (equal to), <(less than), and so on; and a specified value. The type of relational operator and value that you can specify depends on the associated MBean counter type. For example:
ProcessCpuLoad > 0.2
Constraints can be grouped together by using logical operators such as && (AND), || (OR), or ! (NOT) logic. For readability and clarity around the order of operations and operator precedence, grouped constraints may be enclosed in round brackets, but this is not a requirement. For example:
The name of each MBean counter that is specified as part of a custom trigger must follow precise syntax rules in terms of spelling and capitalization.
Only one target duration can be defined for a custom trigger. The target duration is applied to the entire trigger expression that is enclosed within the square brackets
A target duration can be expressed in terms of seconds, minutes, or hours. For example, 30s means 30 seconds, 5m means five minutes, 2h means two hours, and so on.
A target duration is optional. If a target duration is not specified, triggering will occur immediately once the trigger conditions are met.
Multiple custom trigger definitions can be specified together, each of which relates to a separate JFRRecording. Different custom trigger definitions must be separated by a comma (,) character. For example:
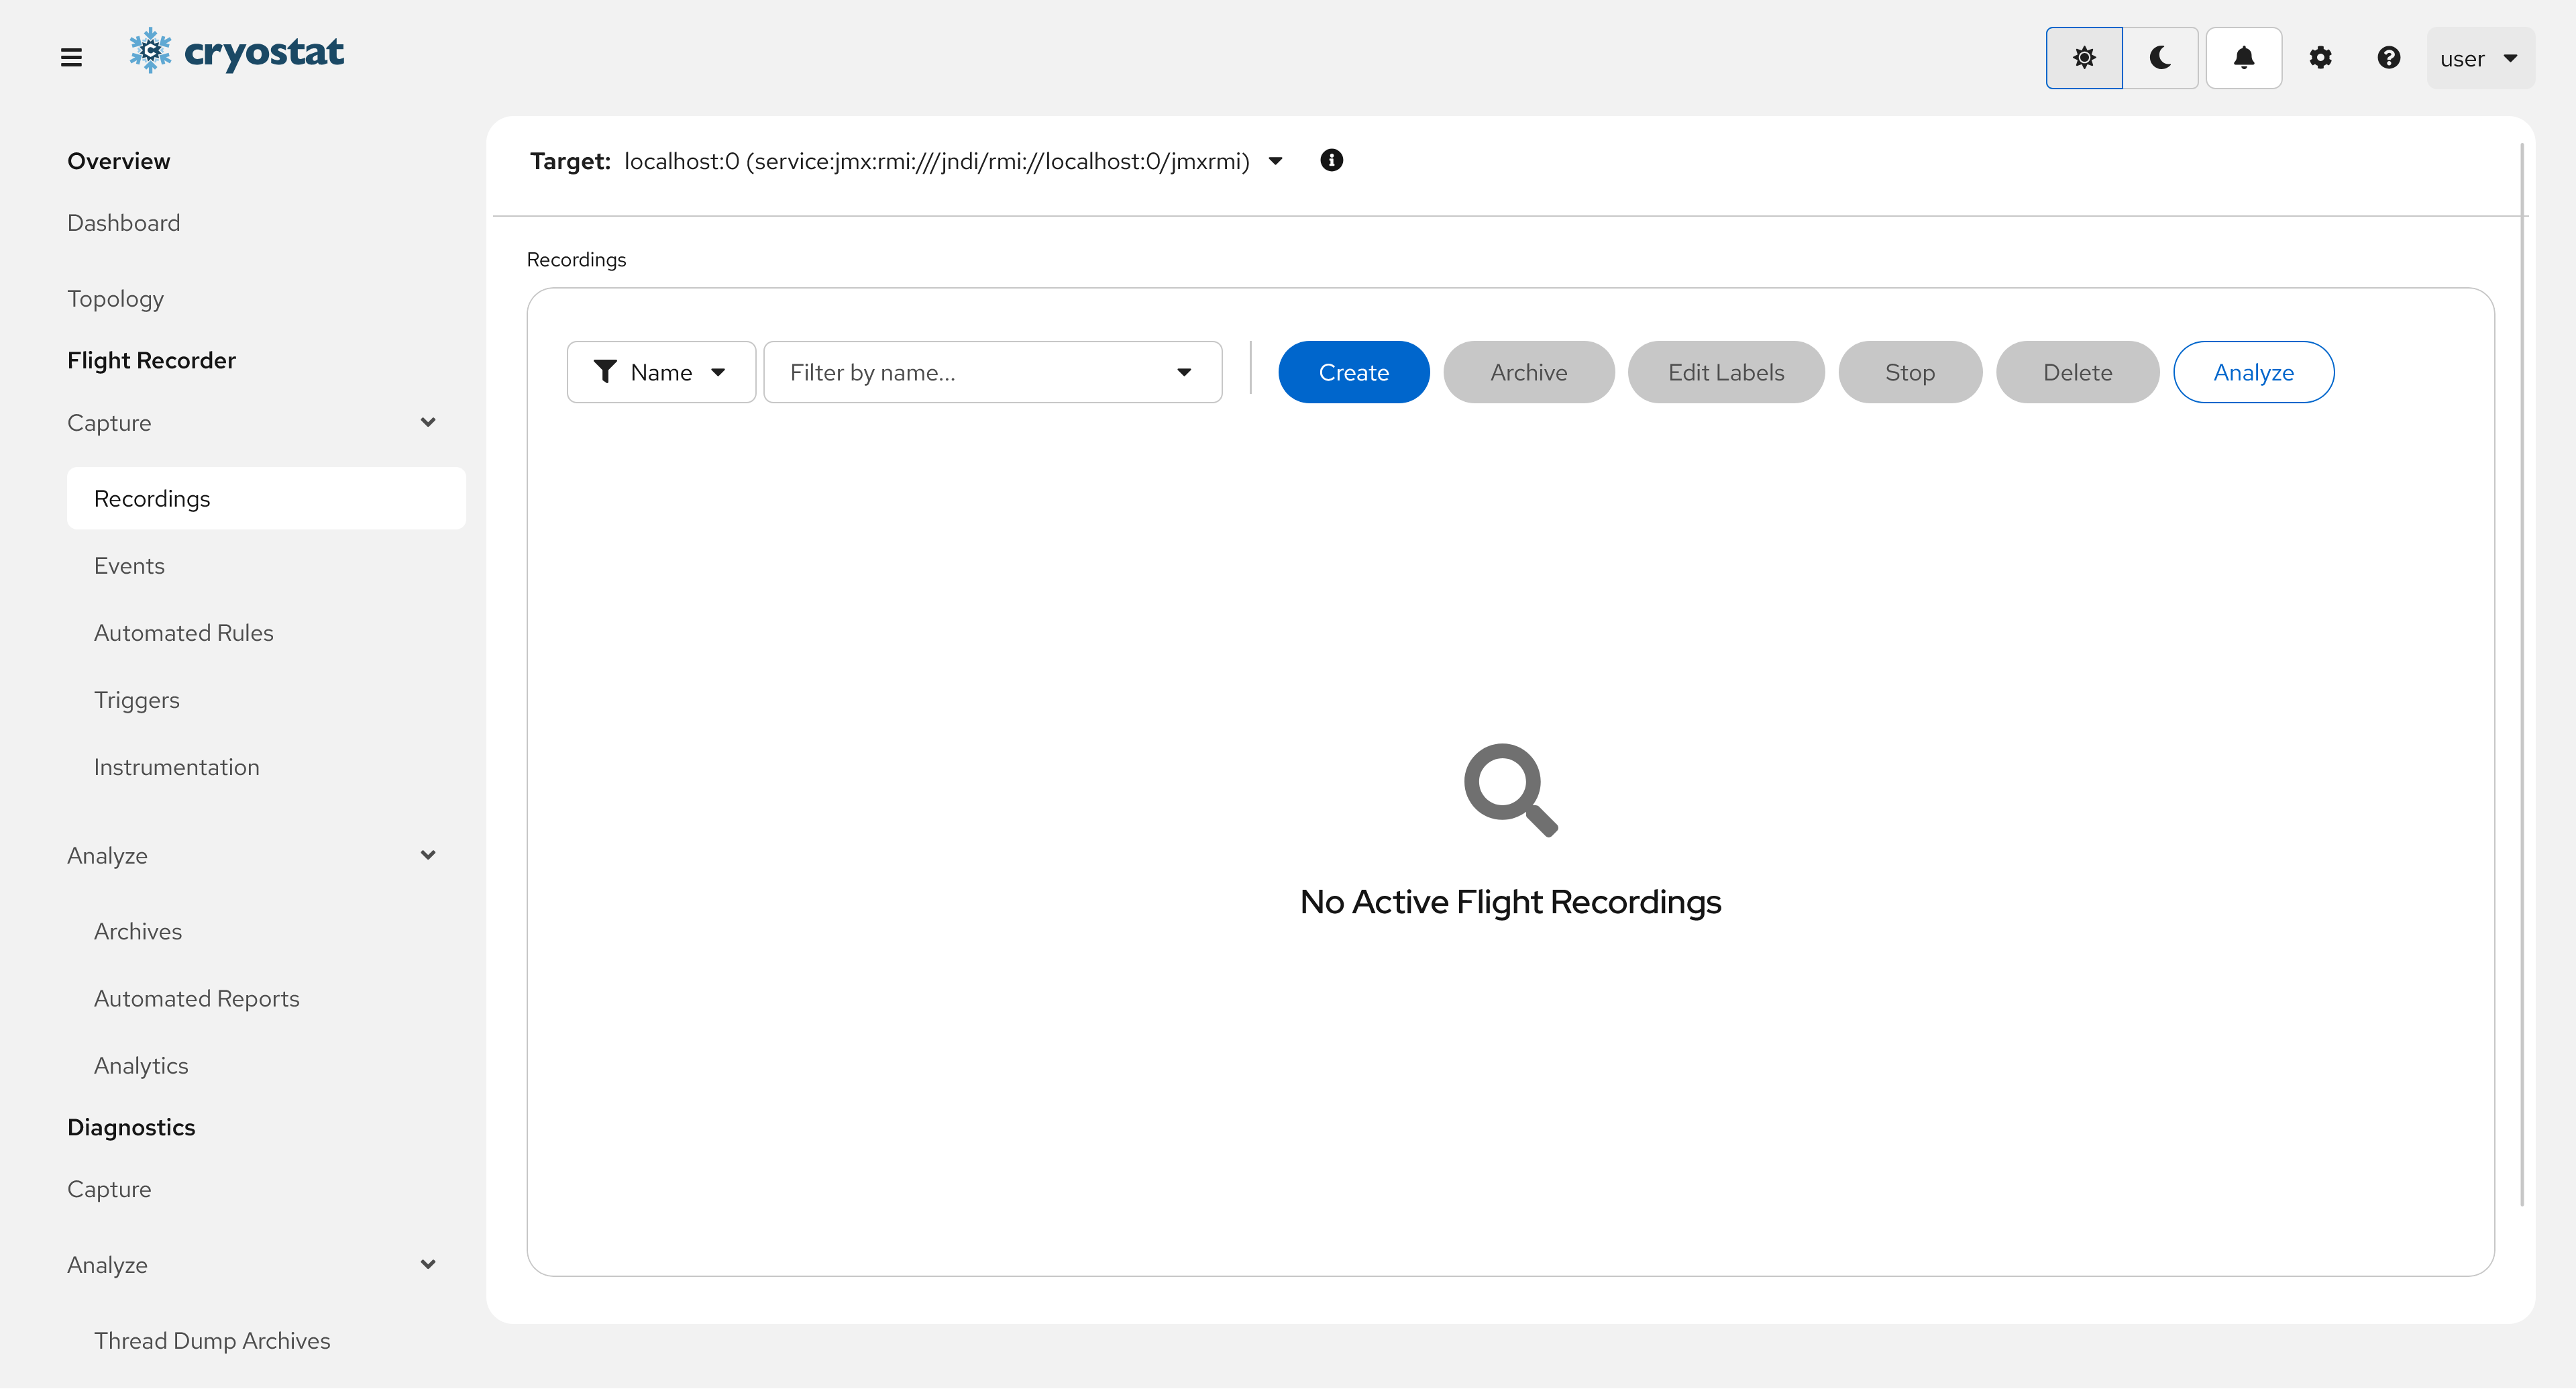
The first and most basic Flight Recorder workflow is to start a Flight Recording in a targetJVM.
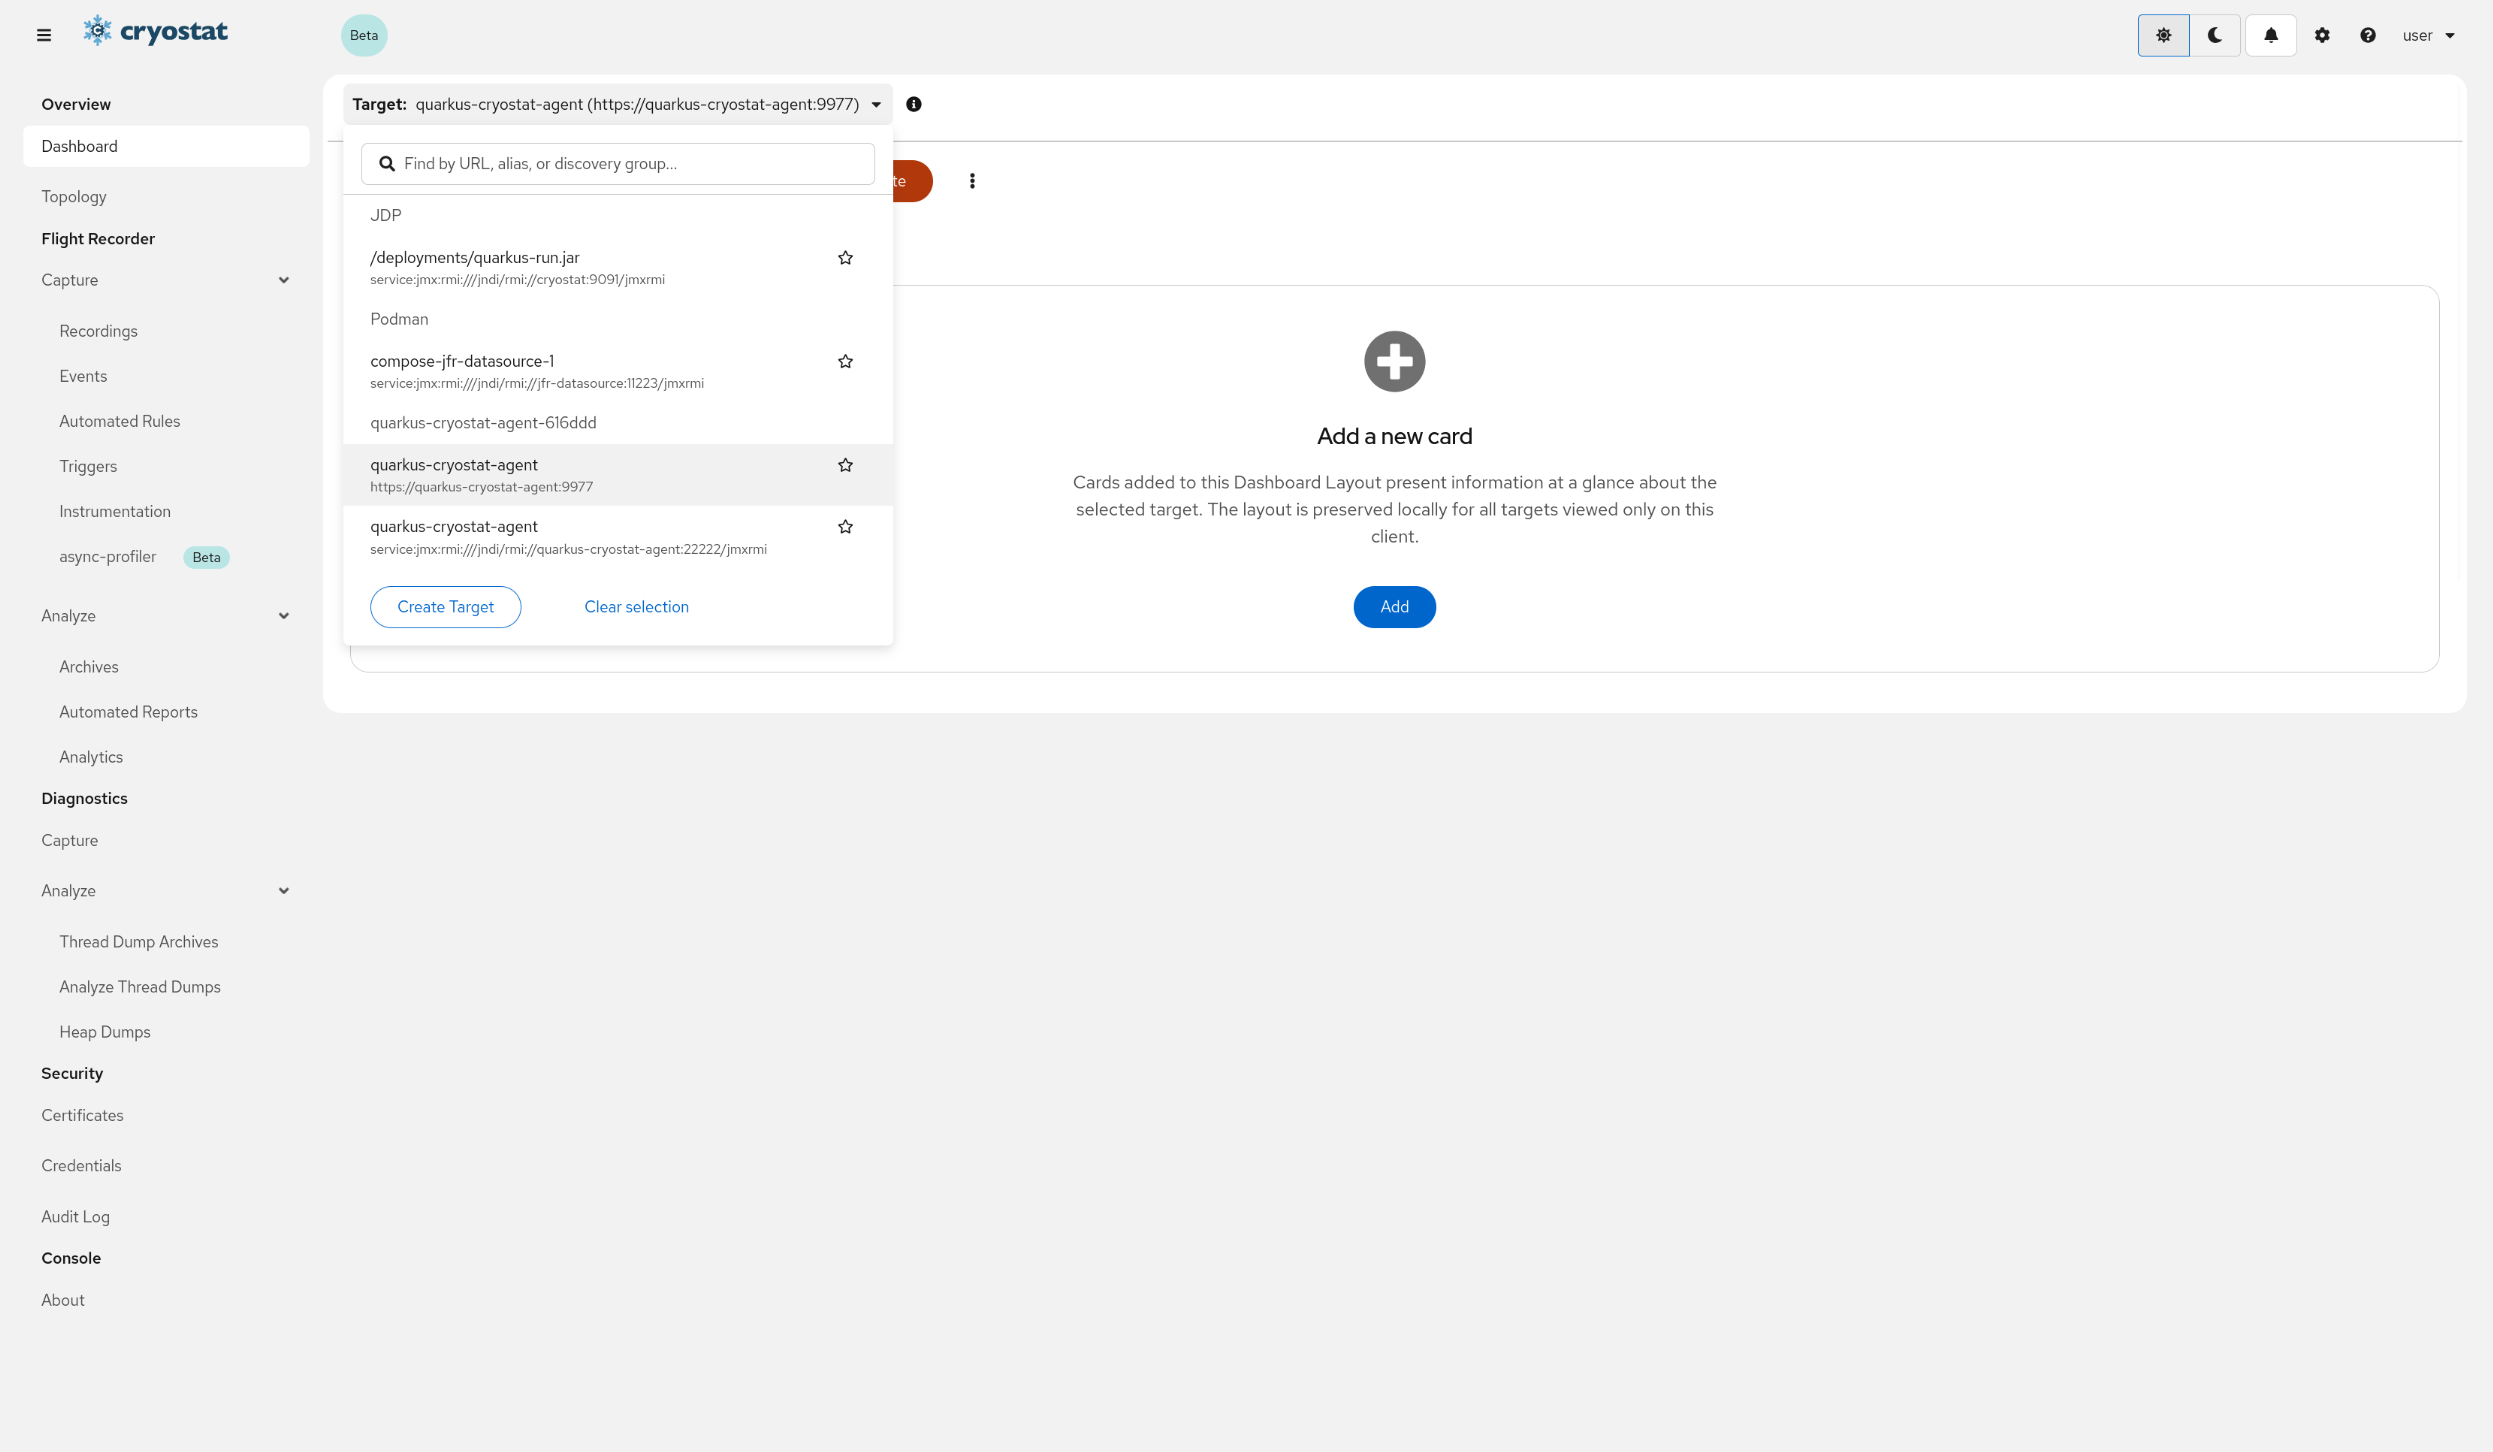
Select the Target ApplicationClik the Dropdown arrow on the right side of Target prompt to select or create a target.
If you wish to create a Custom Target from here, click Create Target displayed at the bottom. Go to Create a Custom Target and proceed from step 3.
Also, see Using the Cryostat Agent section to help discover other targets.
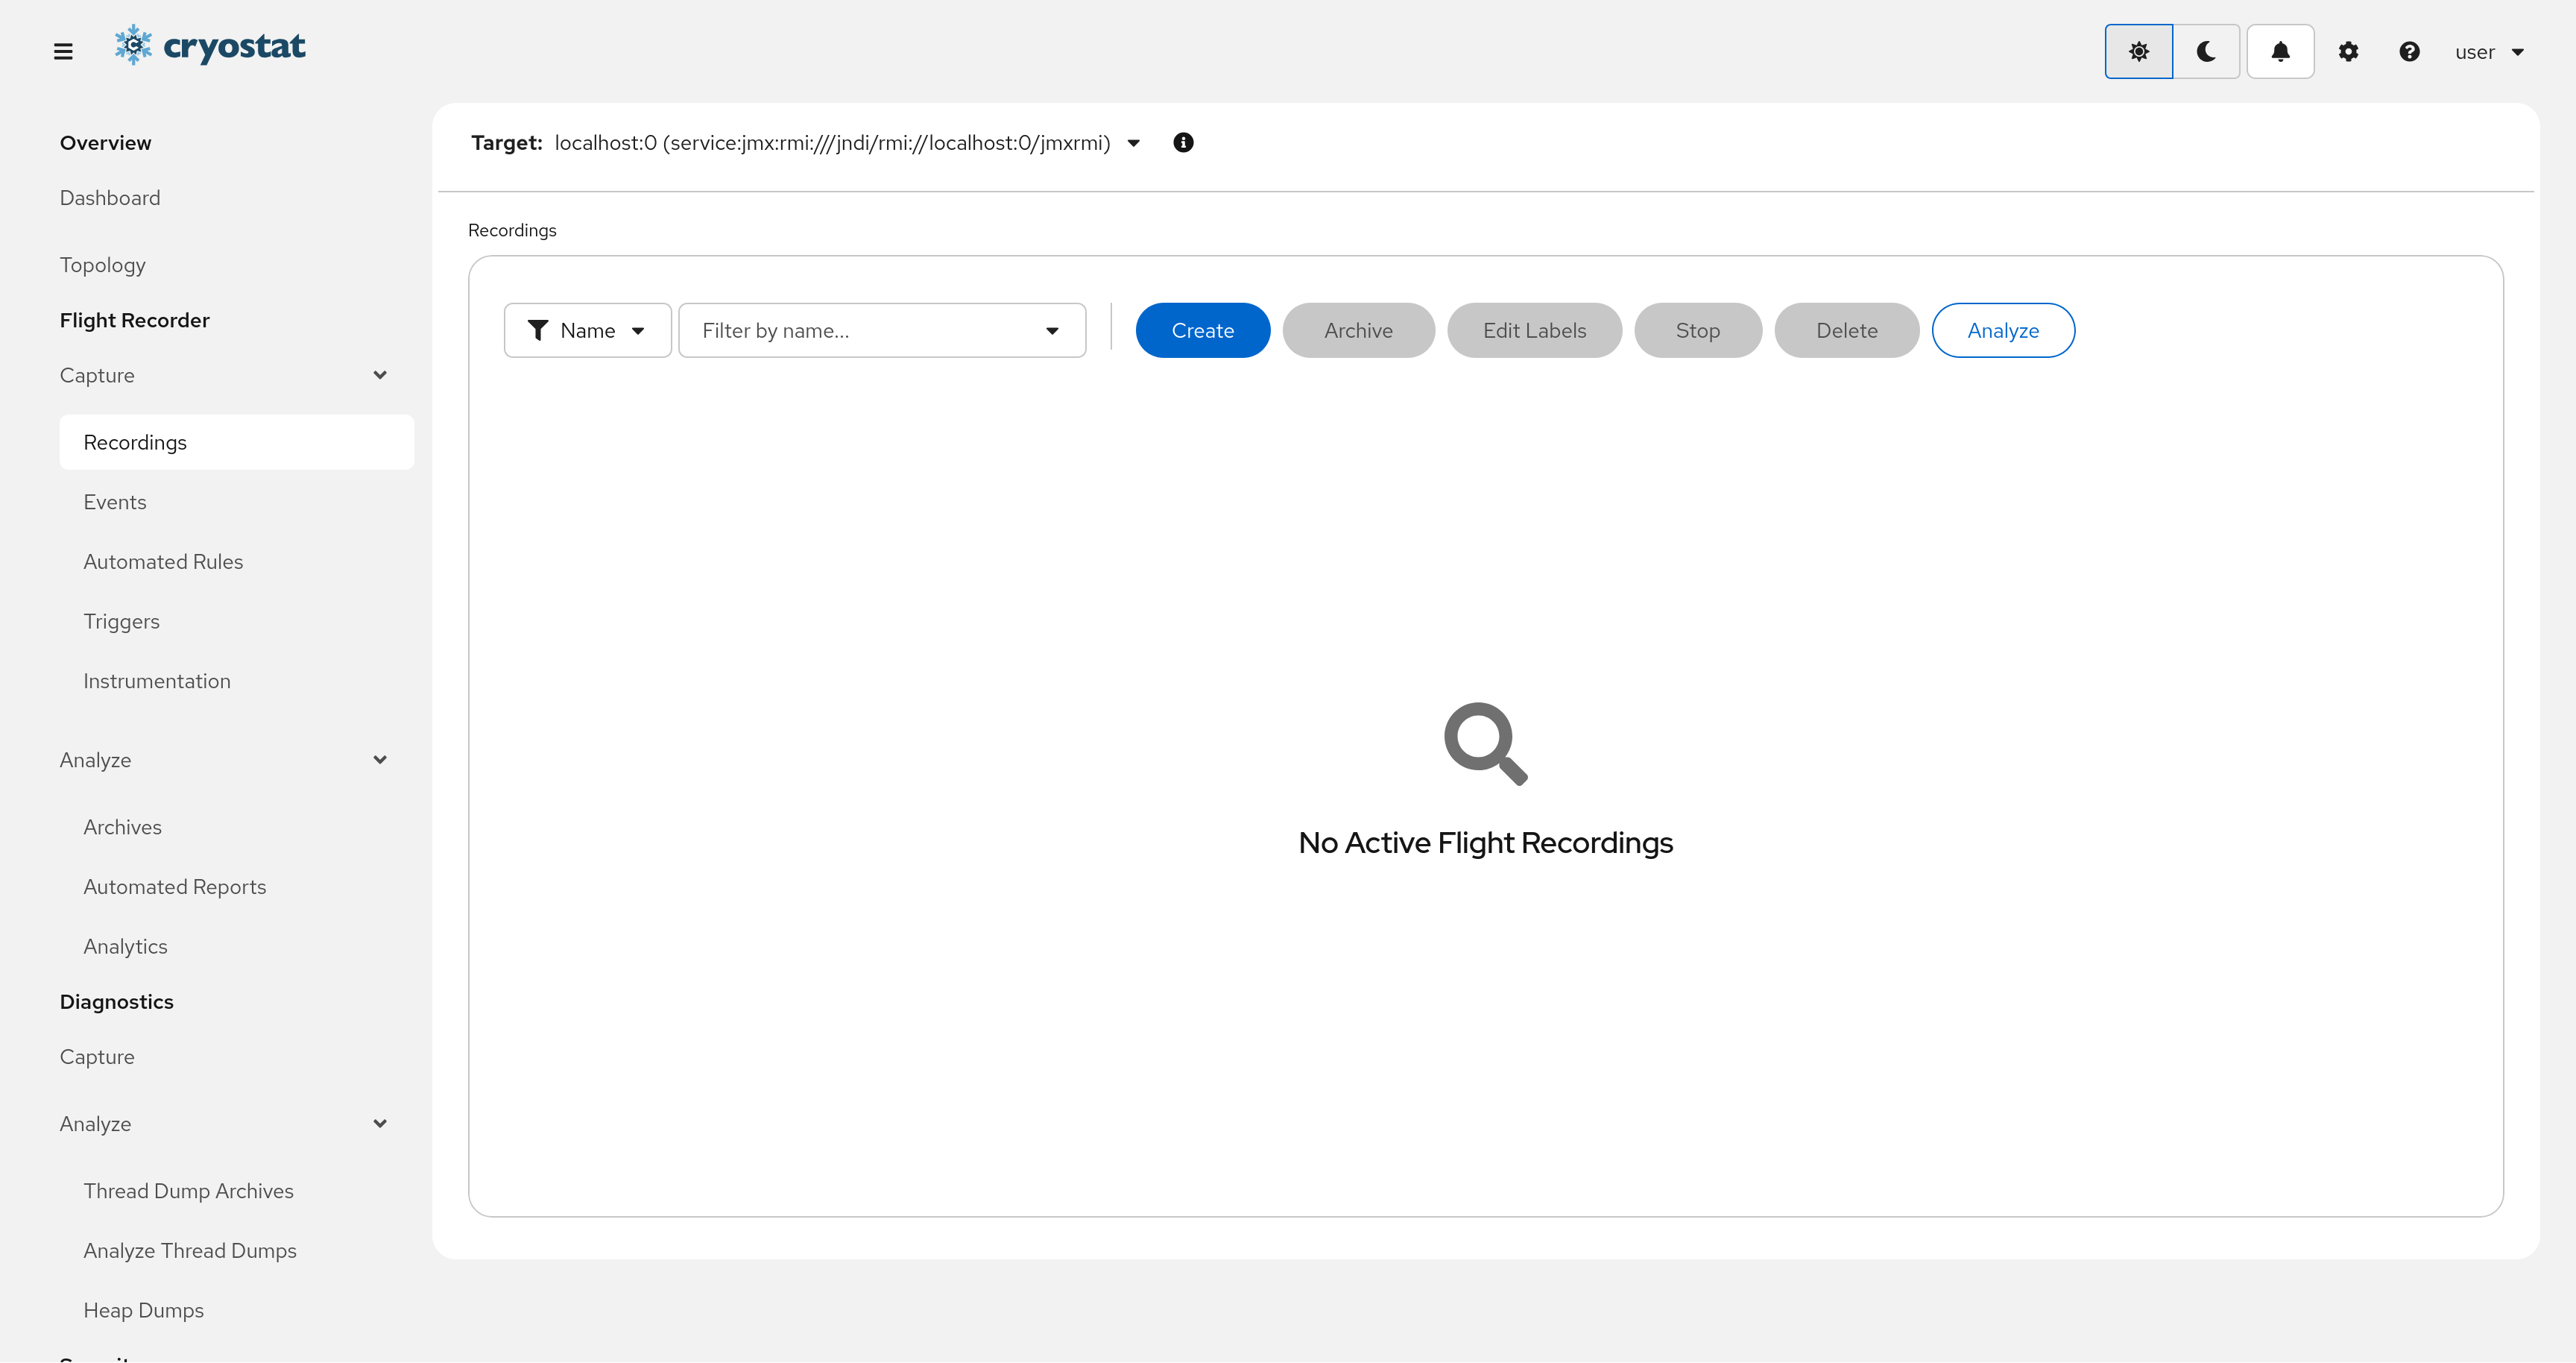
Navigate to Flight Recorder/Capture/Recordings
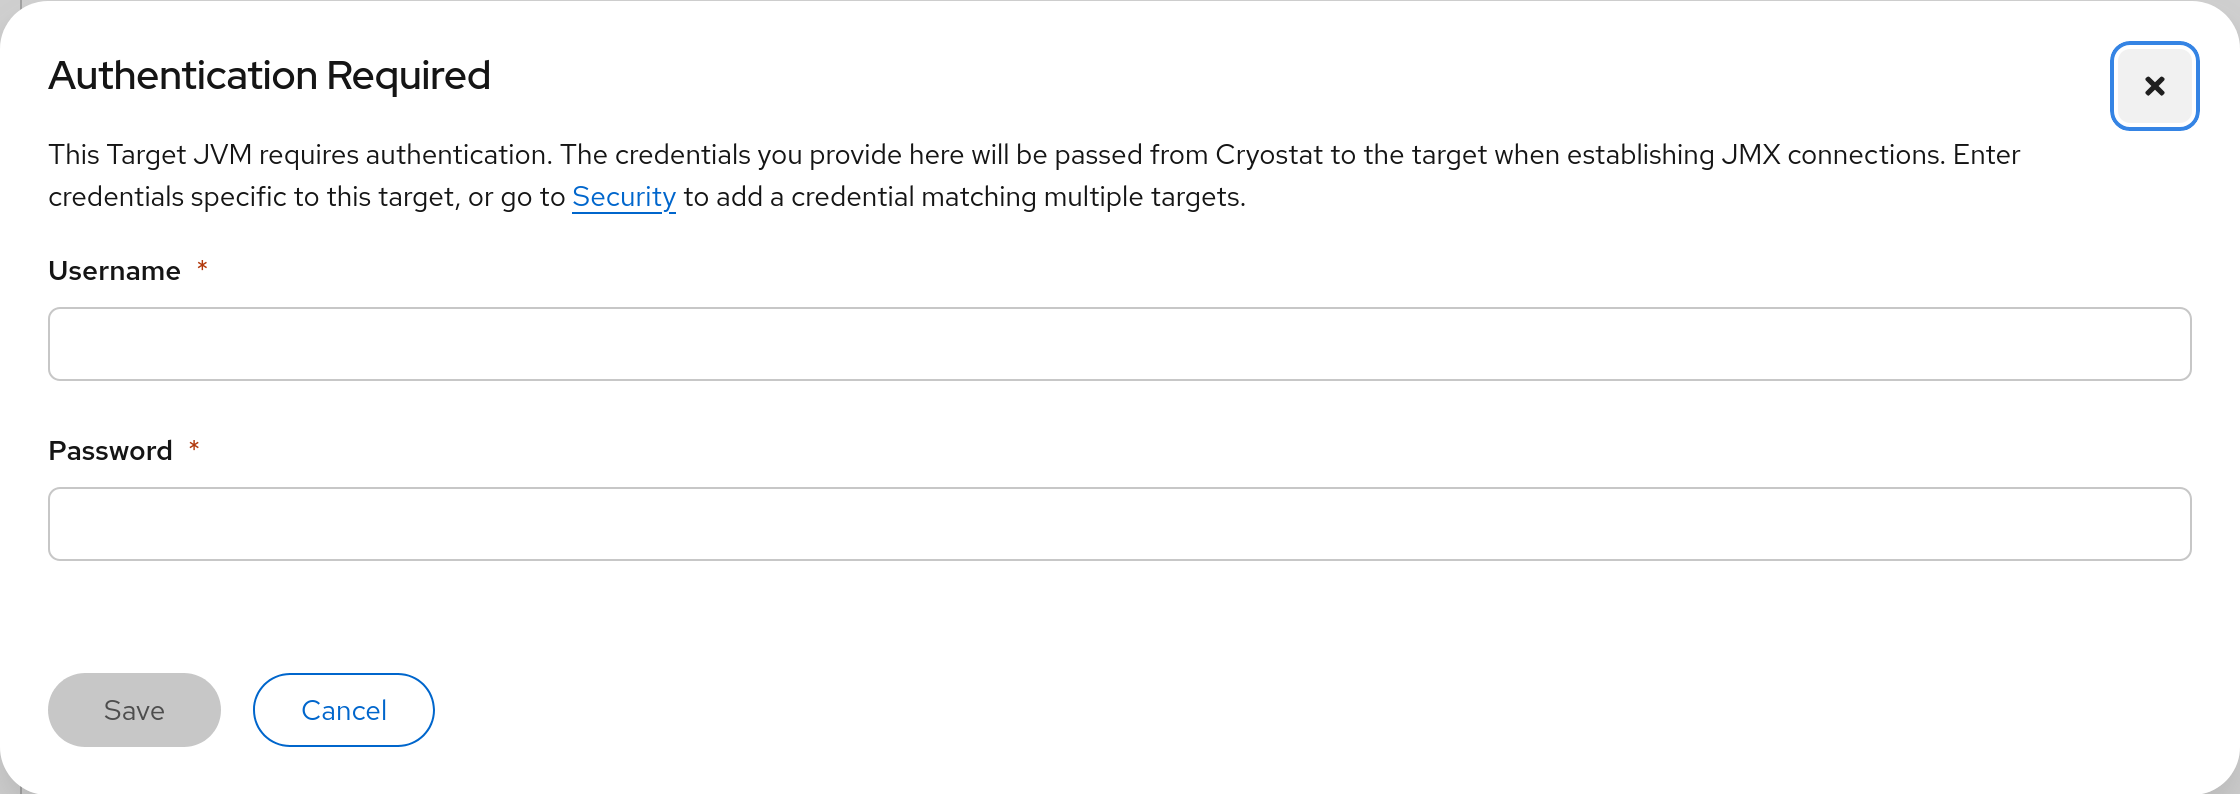
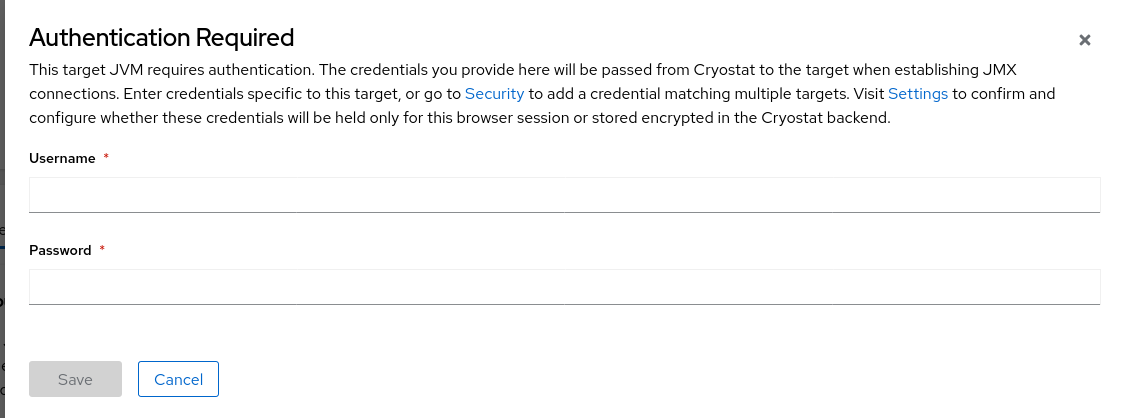
Supply JMX credentials to authenticate to the target, if necessary. If
the target is not configured with JMX authentication then the
connection attempt will continue without prompting for credentials.
If the targetJVM has SSL/TLS enabled on JMX connections, it may be
necessary to add the target's certificate to Cryostat's trust store. Go
to Add a Trusted Certificate
and return to this section after completing that guide.
Click Create
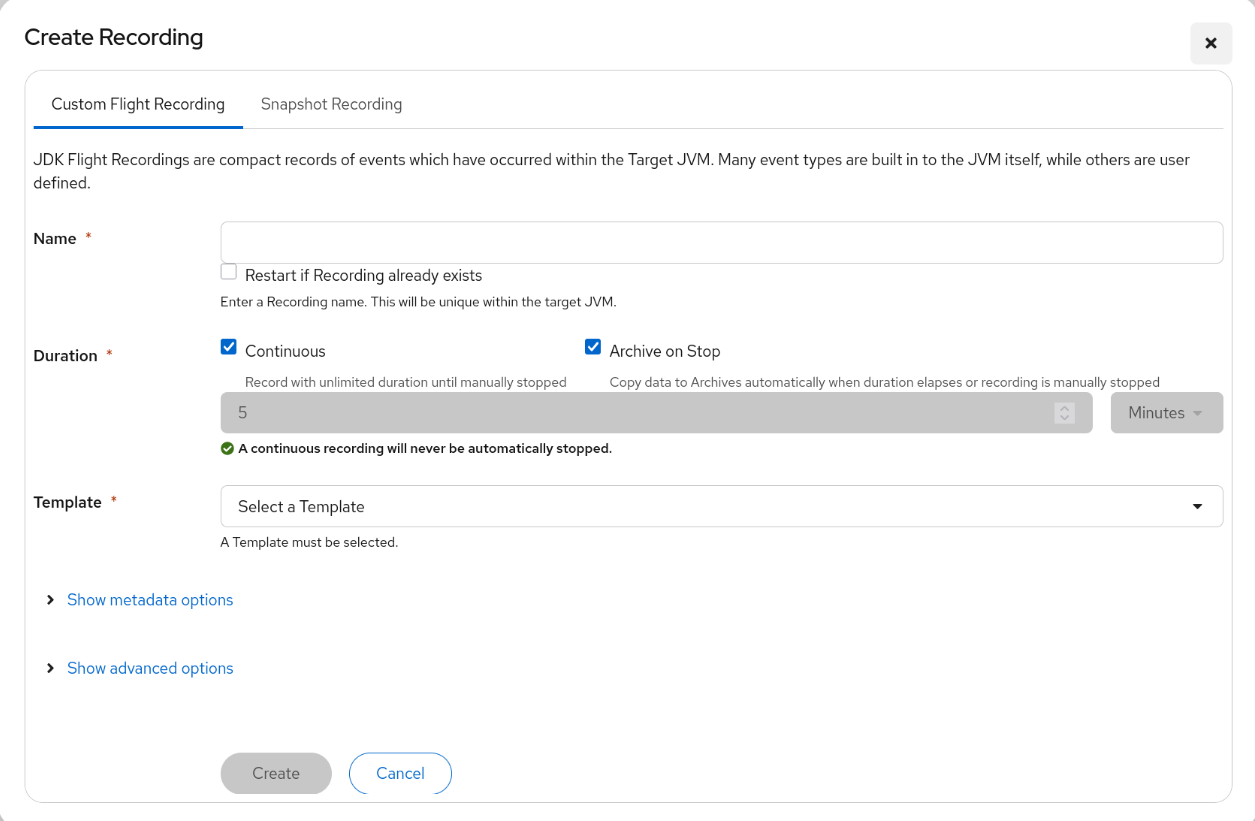
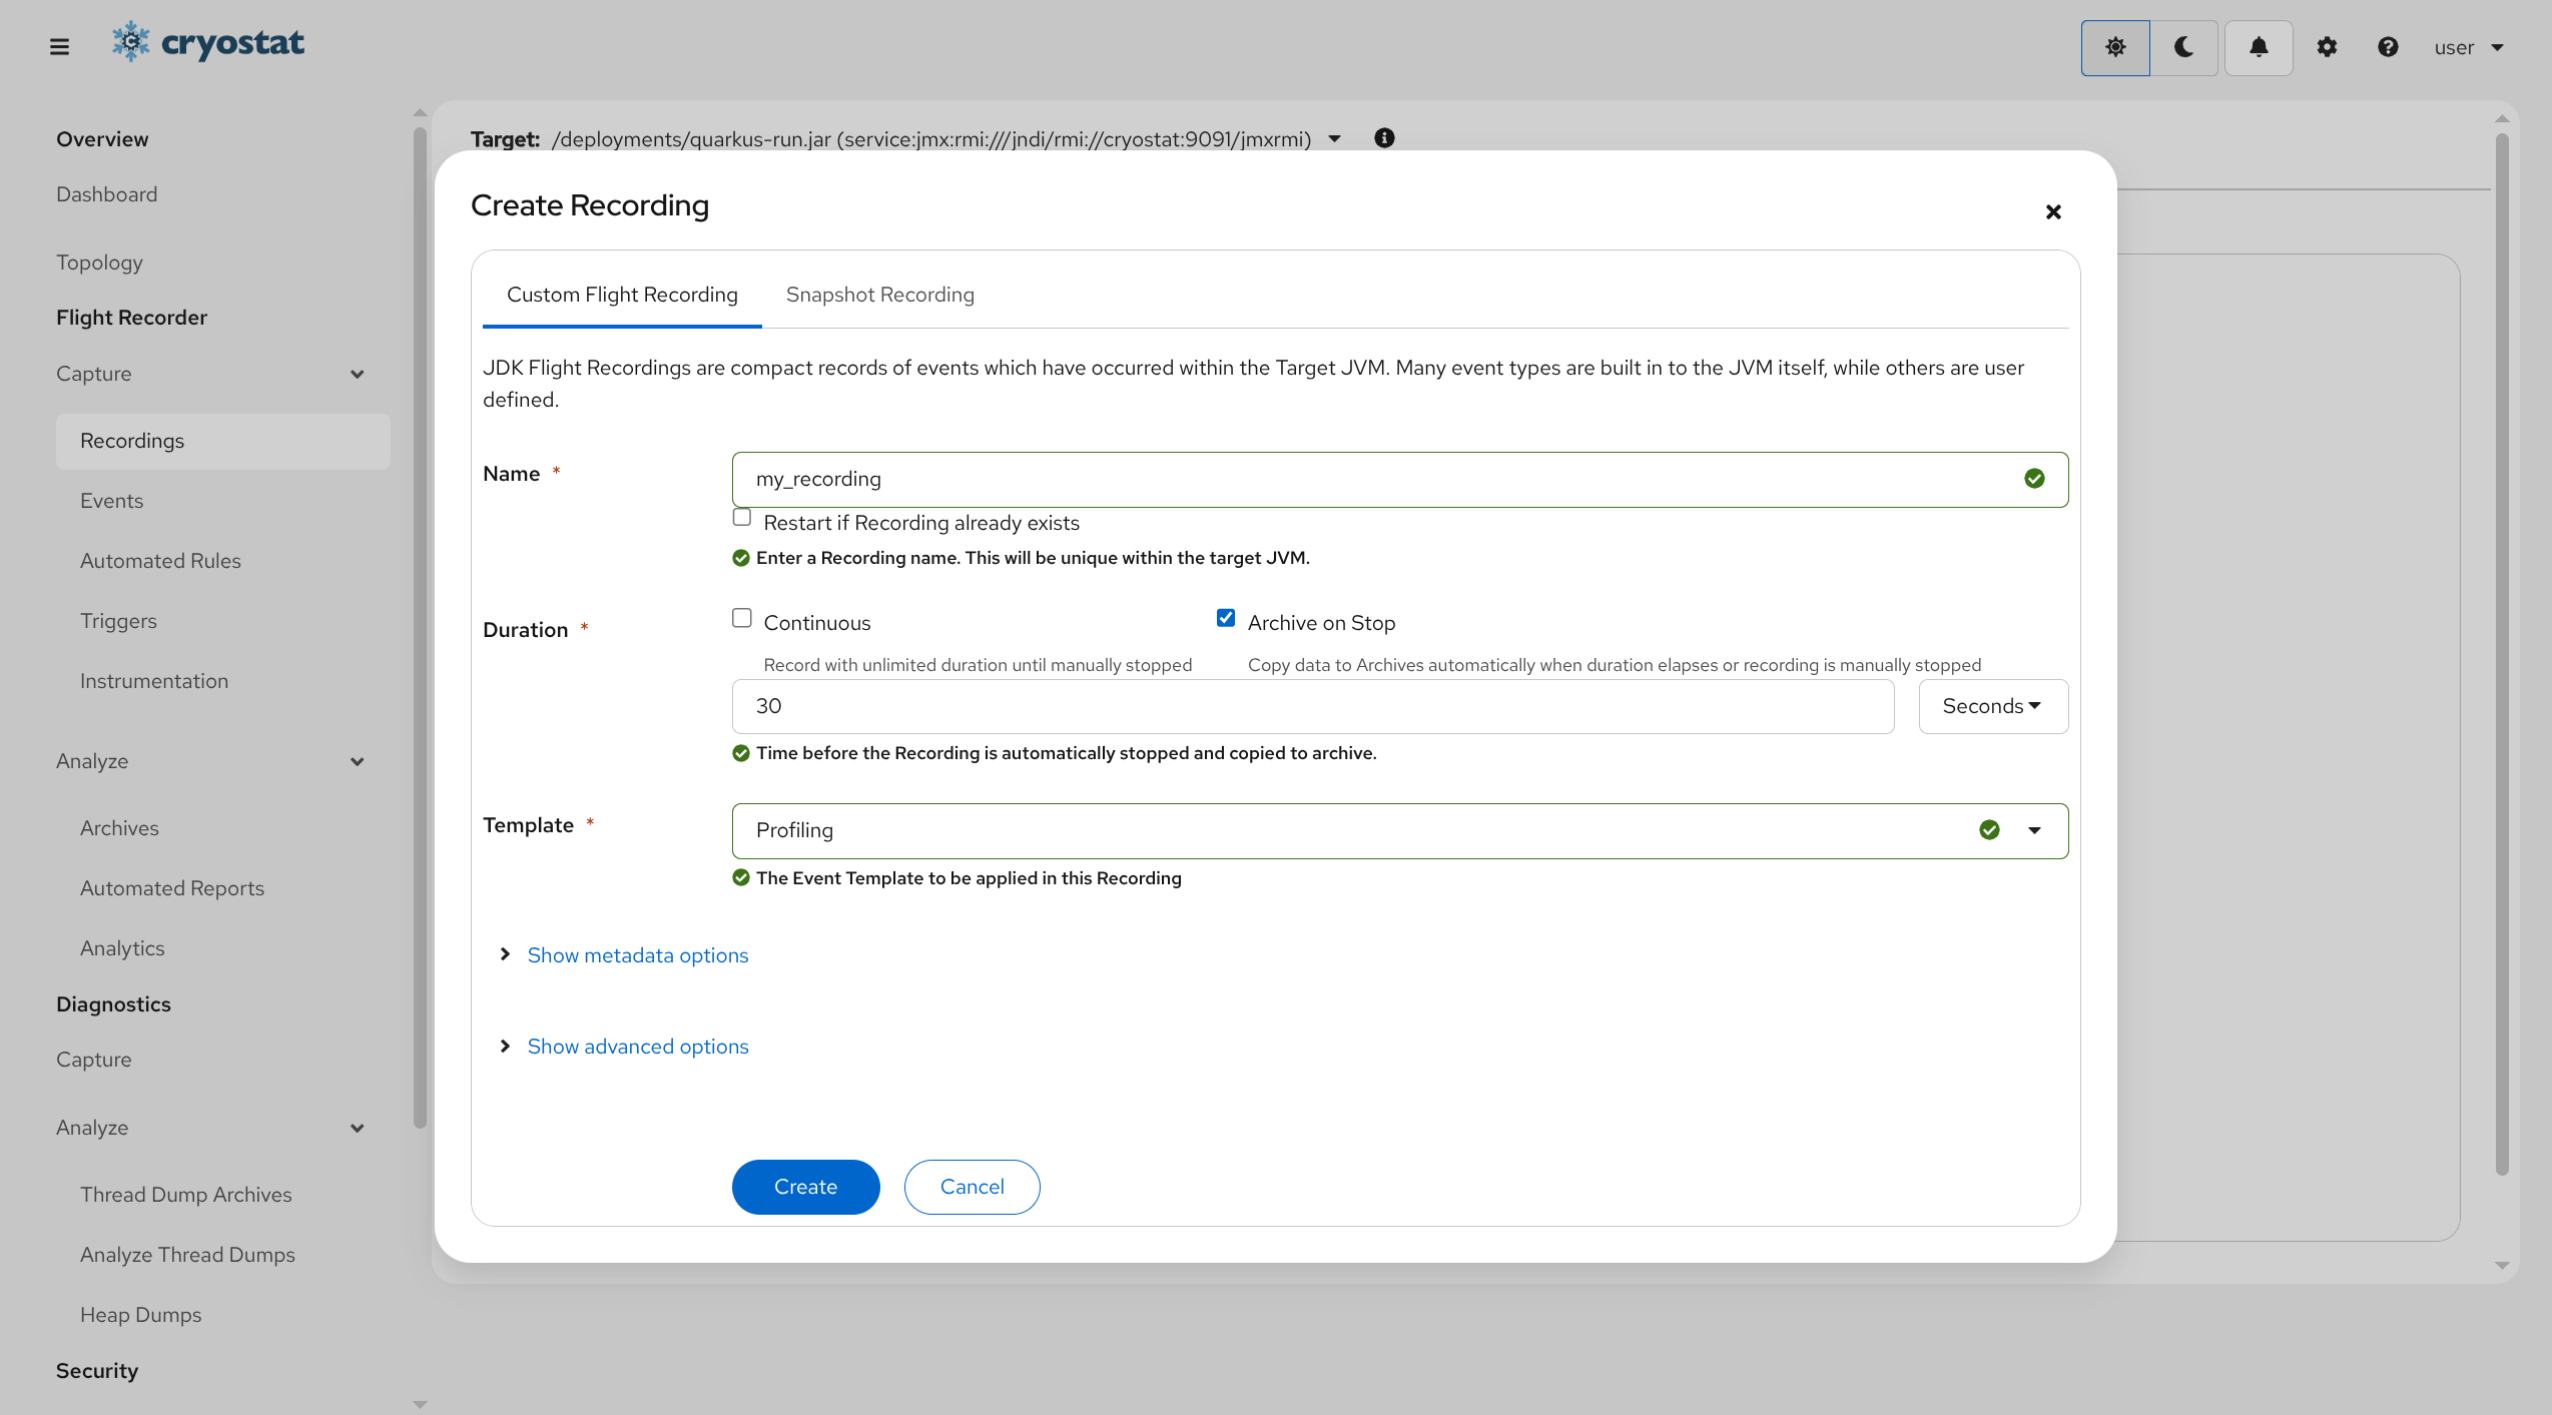
Configure the new Recording
Enter a Name for the new Recording. The form will alert you if the name
entered has an invalid format. If the name is already in use then the
creation will fail and you will need to try again, or check the Restart if recording already exists
checkbox to allow Cryostat to reuse the same recording name for a new recording with new settings.
Select the Duration of the Recording. The duration can be specified in
seconds, minutes, or hours. If you want to record indefinitely, select the
Continuous option. You may also want to save the Recording to Cryostat archive
storage when the Recording stops with the Archive on Stop option.
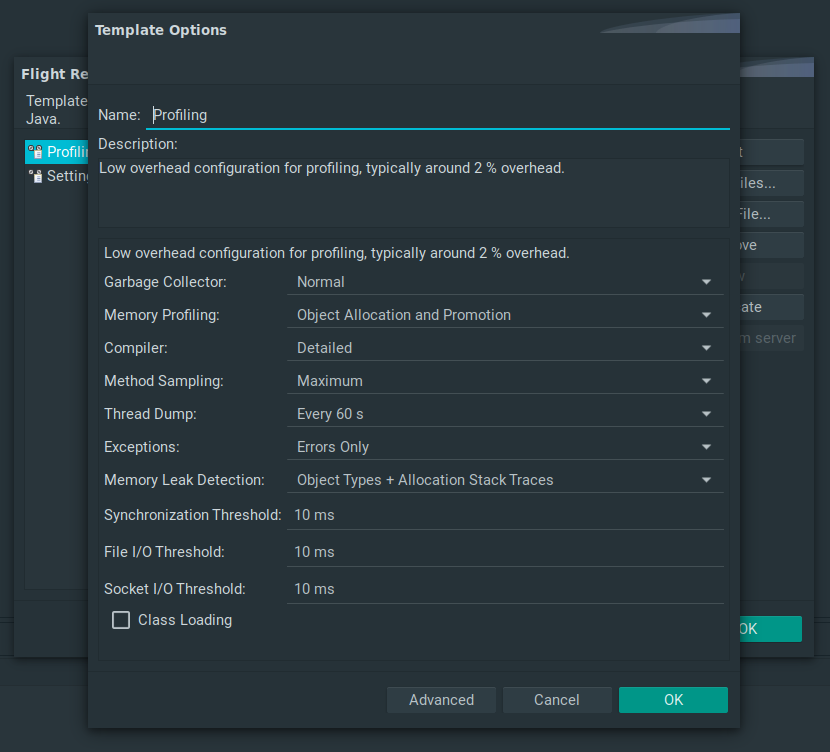
Select an event Template or enter a custom event definition. If you are
unsure which to choose, the Continuous template is useful for
always-on production monitoring with the Continuous recording
duration setting, and the Profiling template is useful for
collecting extra information for troubleshooting a specifically
identified problem with a fixed Recording duration.
You can also
upload a custom Event Template
and select it here.
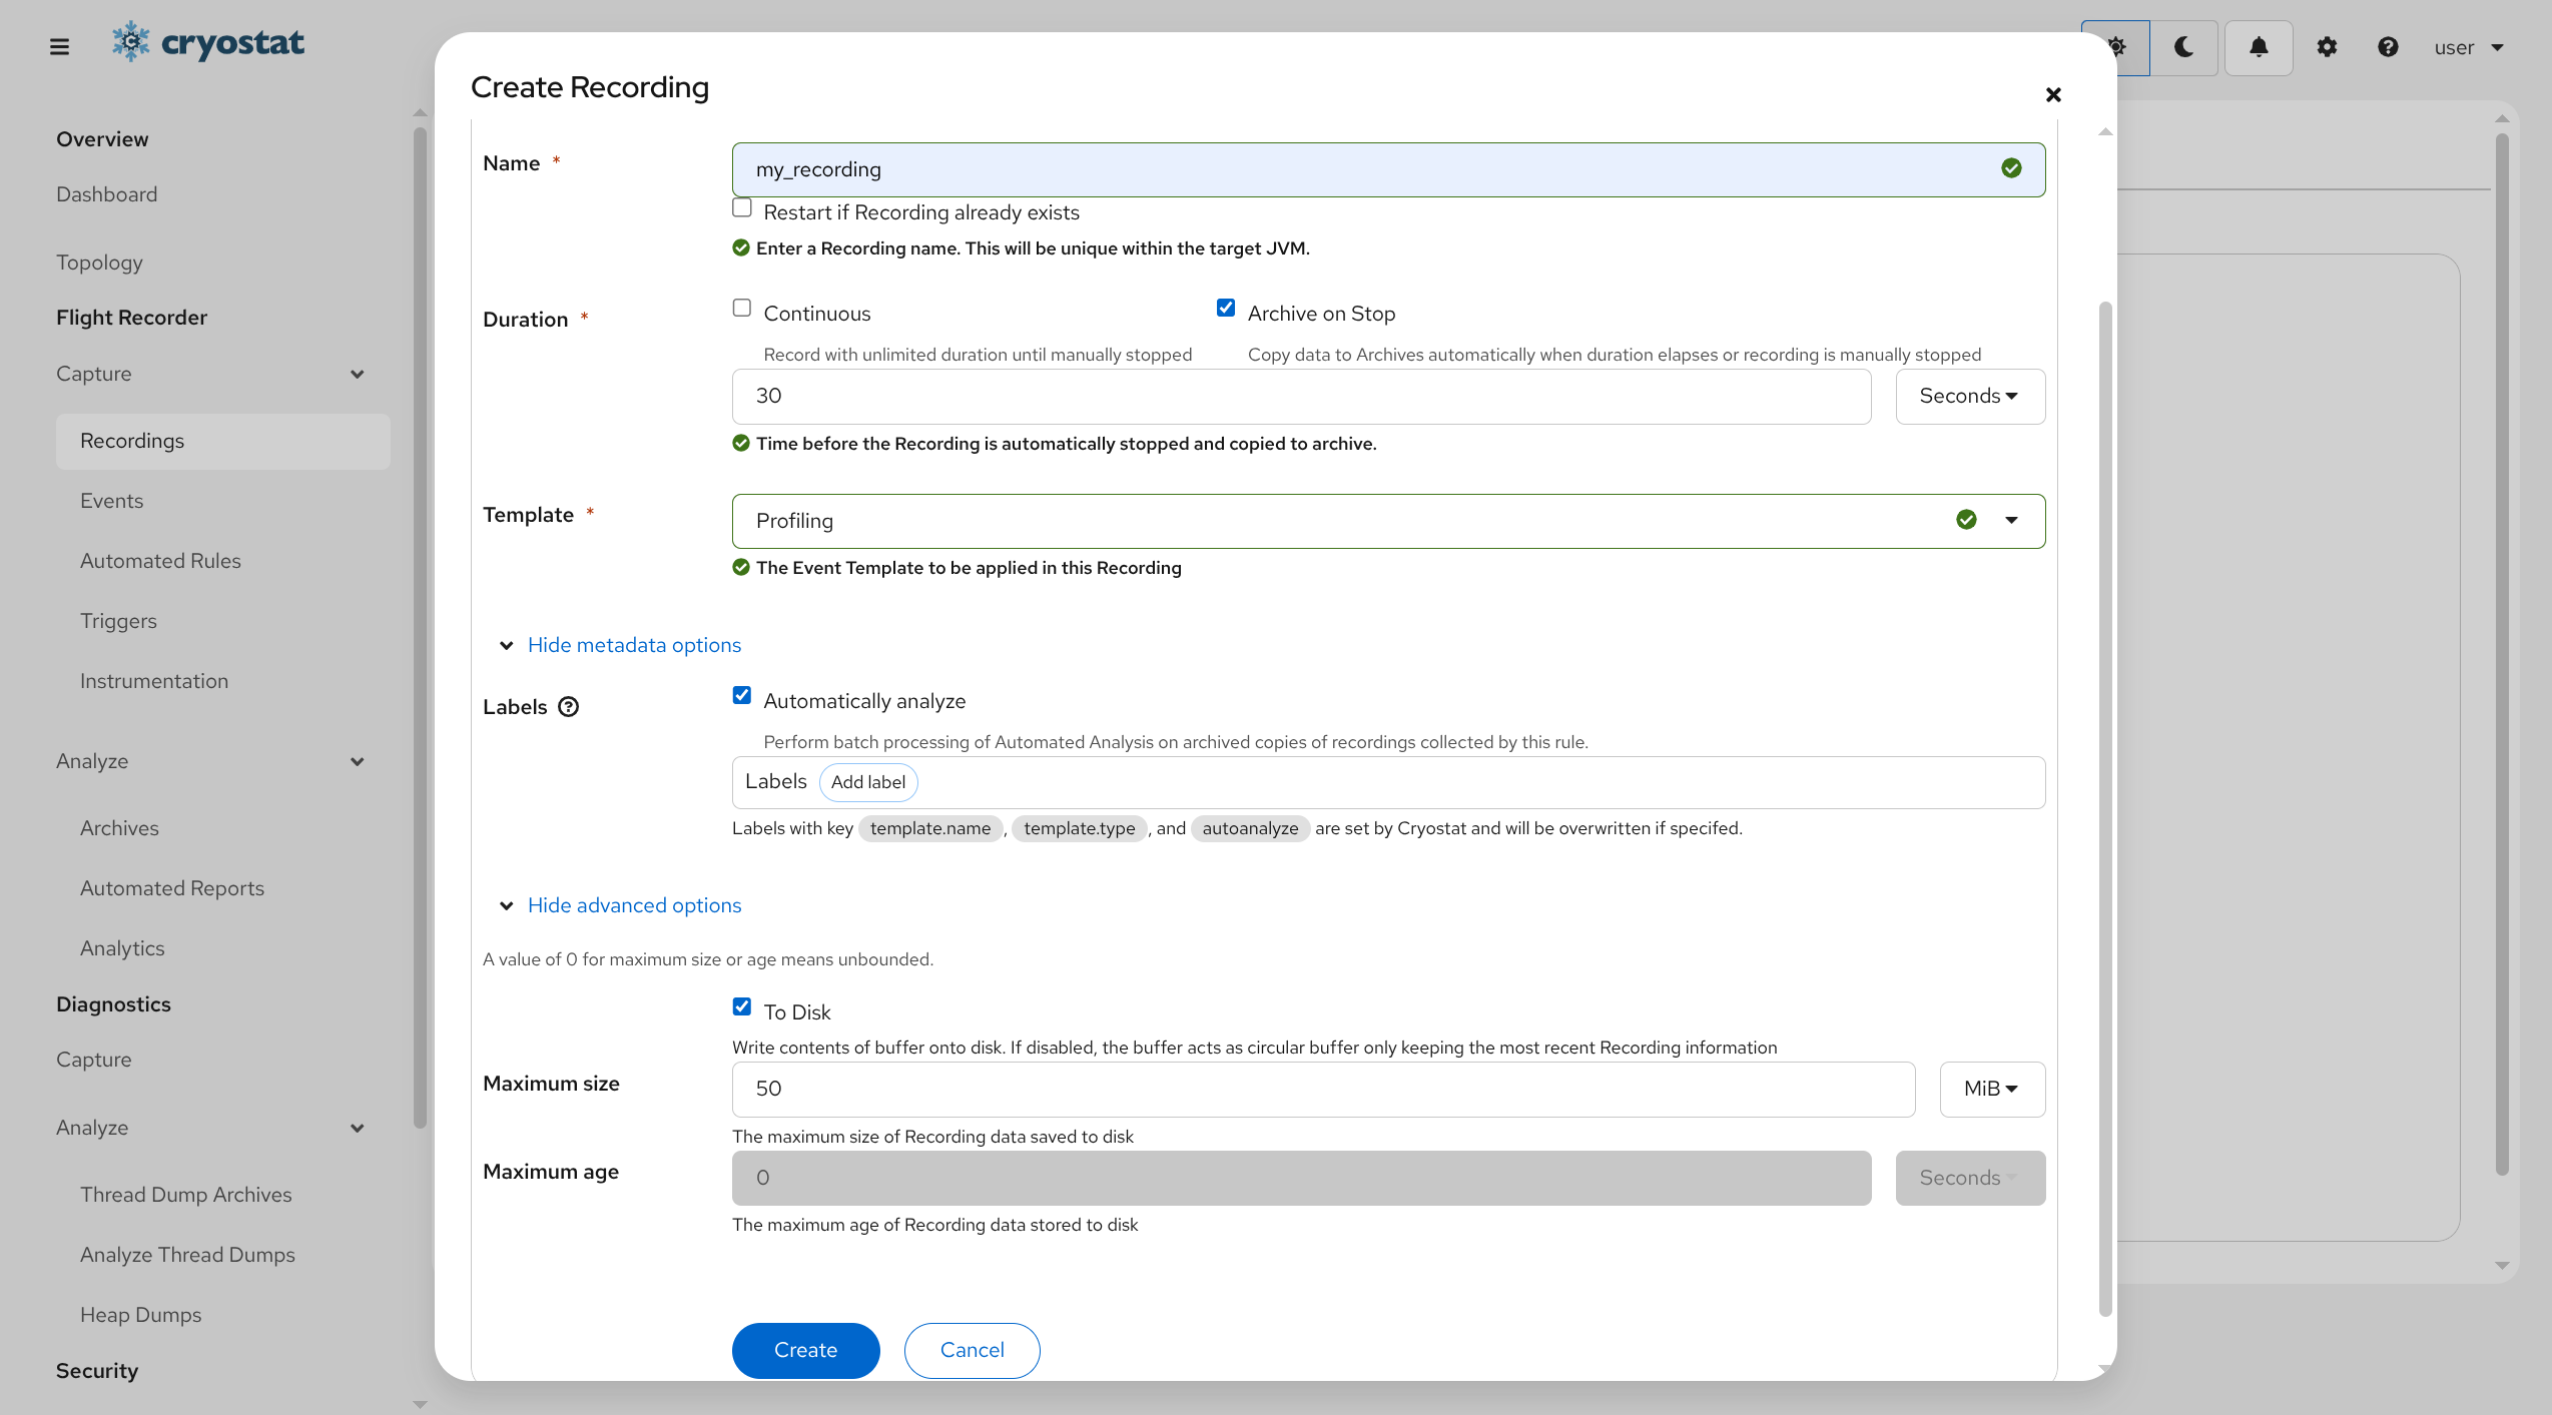
(Optional) Adjust any Advanced Options for the Recording
In many cases, the Advanced Options can be left with their
default values. To view and change their values, select Show
advanced options above the Create button. The following
options are configurable:
To Disk: Use this parameter to specify whether to write data to
your JVM container's disk while recording. By default, this parameter
is true.
Maximum Size: Use this parameter to specify the maximum size of
disk data to keep for the Recording. This parameter is valid only when
the disk parameter is set to true. By default, the maximum size of disk
data isn’t limited, and this parameter is set to 0.
Maximum Age: Use this parameter to specify the maximum number of
seconds, minutes, or hours that events should be kept in the Recording
before being discarded. This parameter is valid only when the disk
parameter is set to true, and the Recording duration is not Continuous.
By default, this parameter is set to 0, which means there is no limit set.
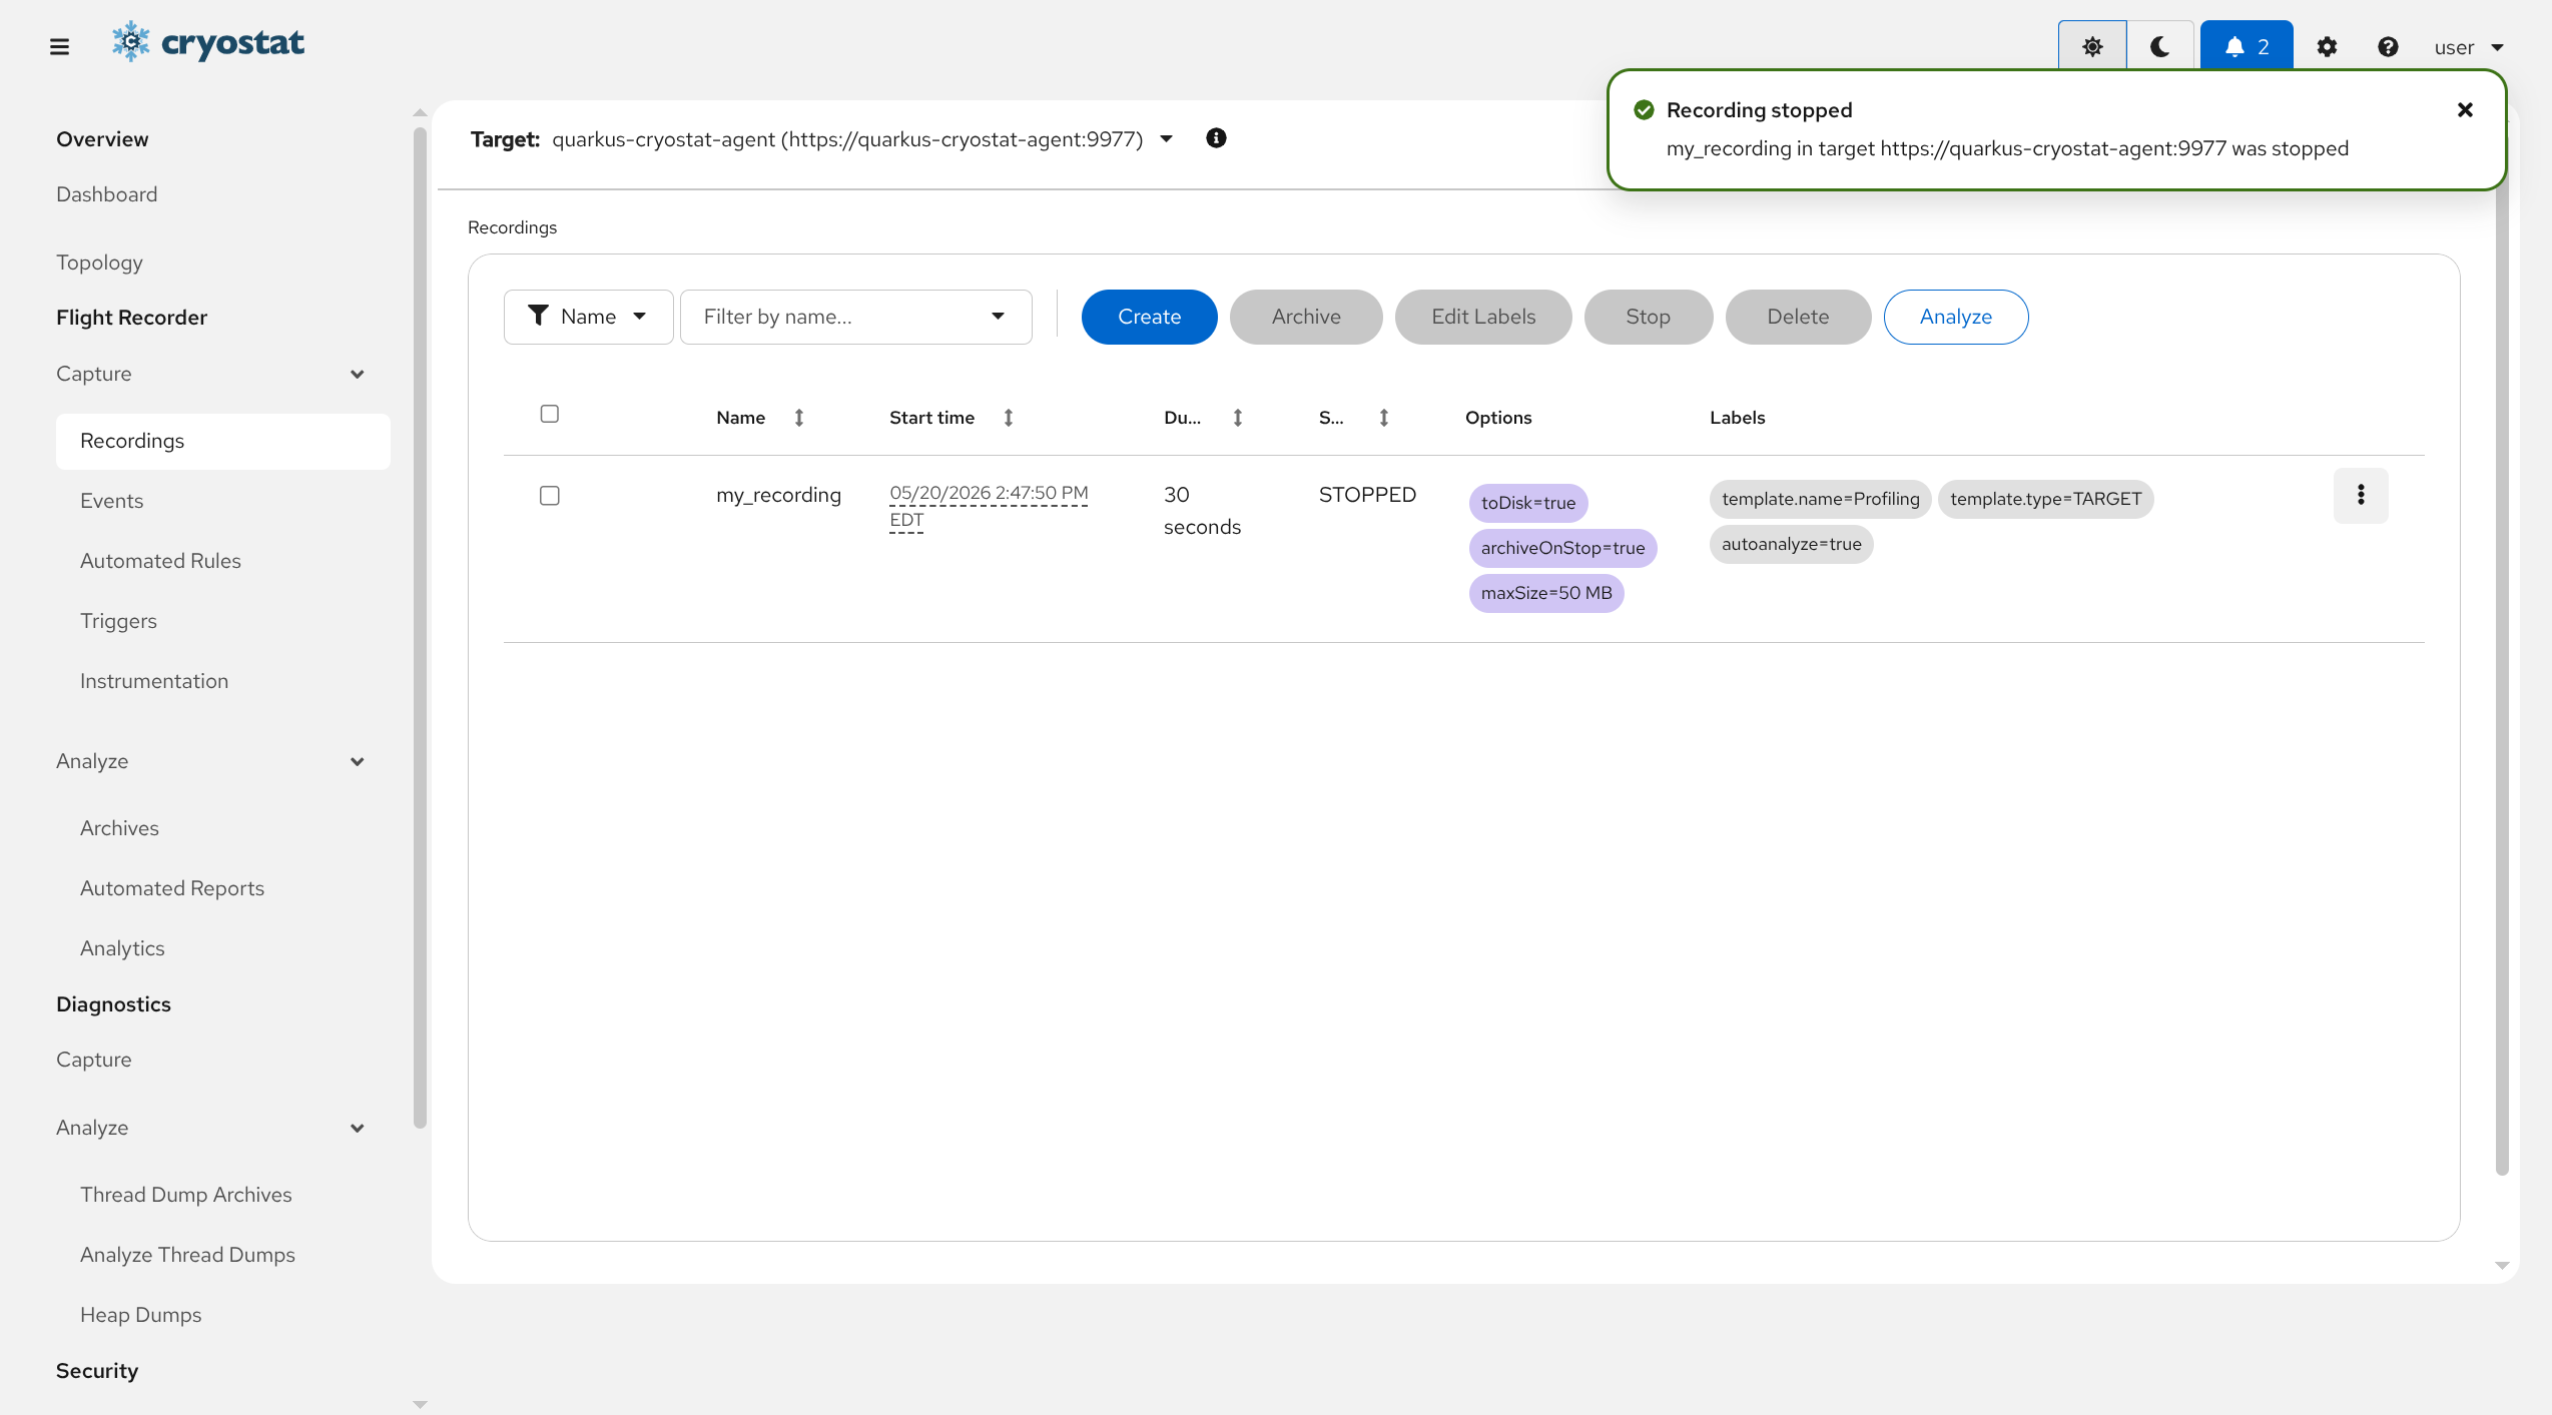
Click the Create button
Stop the Recording
When you no longer desire for the Flight Recording to be Active and
collecting data in your target application, select the Recording from
the list by clicking the checkbox to the left of the Recording name.
This will enable the Stop button in the toolbar. Click the
Stop button to end the data collection.
If the Recording has a fixed duration then it will automatically stop
after the targetJVM measures that the duration has elapsed. If the
Recording was created with a Continuous Duration then it will collect
data until explicitly stopped.
After Stopping a Recording it remains in the Active section of
the Recordings view. This signifies that the Recording data is still
present in the targetJVM, and not within Cryostat's storage. If the
targetJVM crashes, is killed, or the process otherwise restarts, then
the Recording data will be lost. To learn how to persist the Flight
Recording data, continue on to
Archive a Recording.
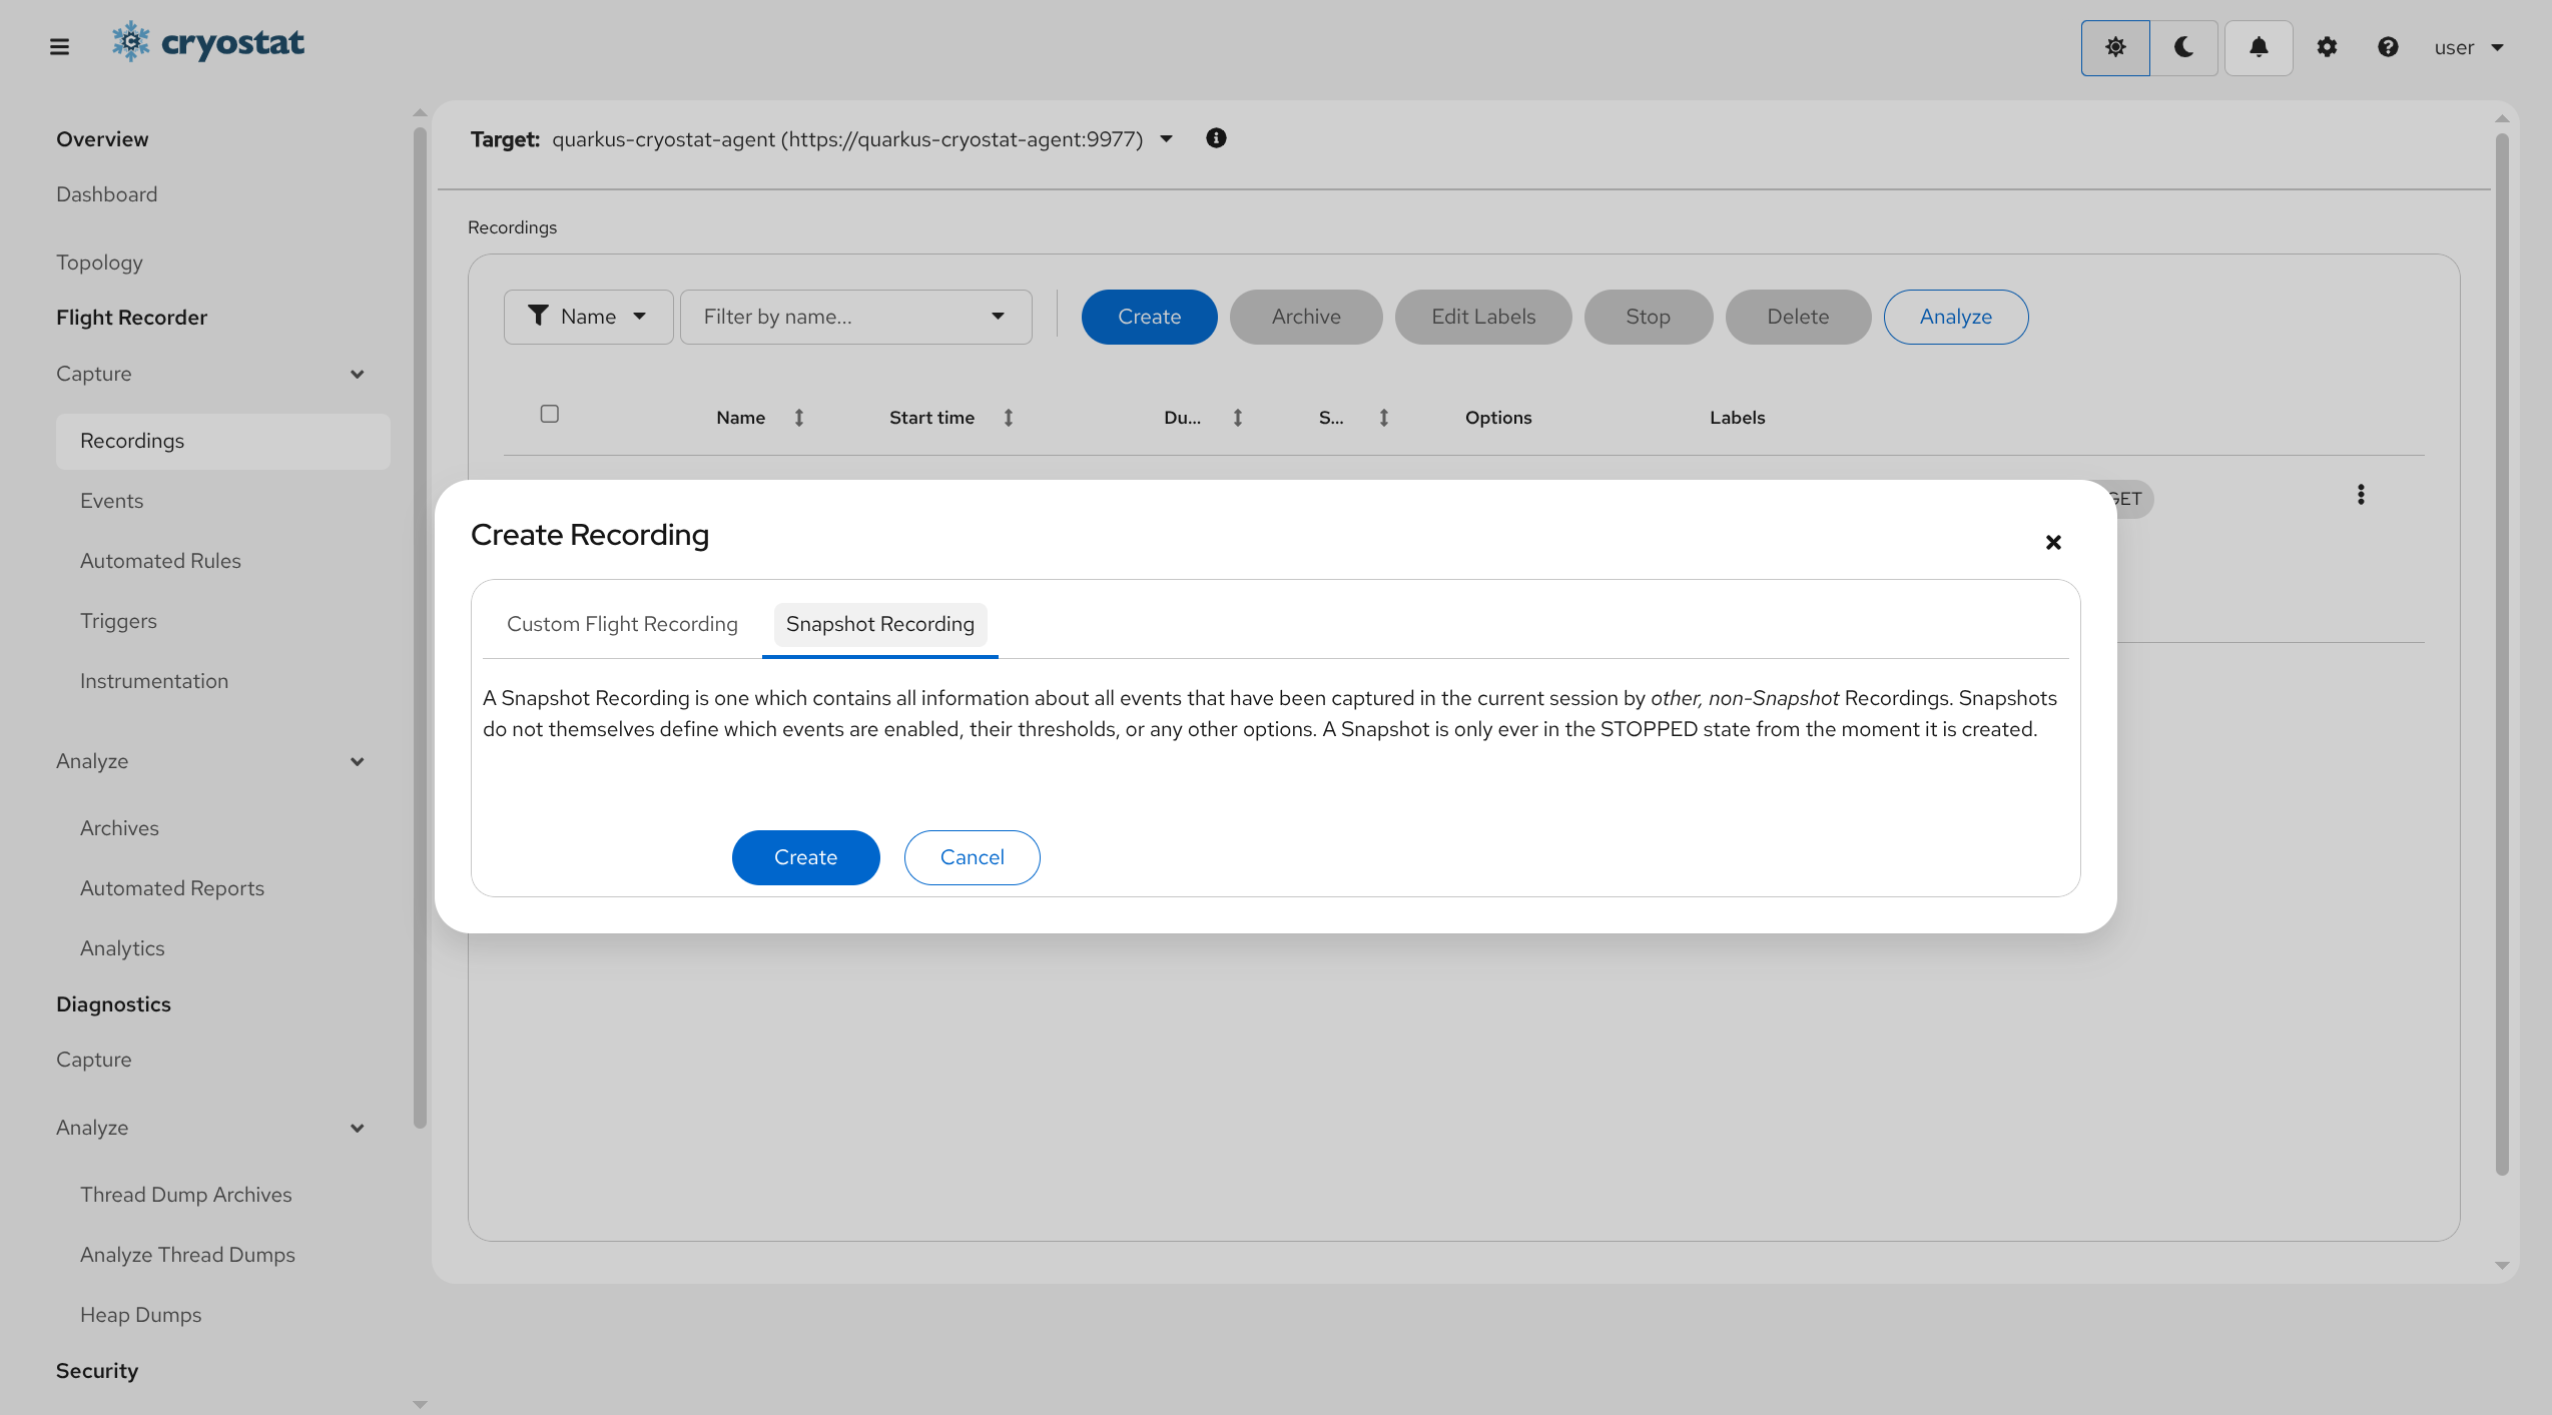
Snapshotting an application produces a new Flight Recording named snapshot-n,
where n is a natural number. This snapshot contains all of the JFR data that
was present in the targetJVM at the time that the snapshot was taken and is in
the STOPPED state as soon as it is created (that is, the snapshot will never
record any further information and is fixed in size). This is useful when you
have an ongoing, Continuous Recording active in a target application and want
to preserve the specific information at a given point in time. If the
Continuous source Recording is configured with a maximum event age or maximum
recording size then the need for snapshots is more apparent, since without
snapshotting, some older data will eventually be dropped and lost from the
source Recording. It is also useful when you have multiple concurrent source
Recordings running and want an easy way to capture the sum of all of their data
at a given point in time.
Select the Target ApplicationClik the Dropdown arrow on the right side of Target prompt to select or create a target.
If you wish to create a Custom Target from here, click Create Target displayed at the bottom. Go to Create a Custom Target and proceed from step 3.
Also, see Using the Cryostat Agent section to help discover other targets.
Navigate to Flight Recorder/Capture/Recordings
Supply JMX credentials to authenticate to the target, if necessary. If
the target is not configured with JMX authentication then the
connection attempt will continue without prompting for credentials.
If the targetJVM has SSL/TLS enabled on JMX connections, it may be
necessary to add the target's certificate to Cryostat's trust store. Go
to Add a Trusted Certificate
and return to this section after completing that guide.
If you do not have any Recordings present in the Active Recordings
view, follow
Start/Stop a Recording
to create one, or select a different target application.
Click Create
Switch to the Snapshot Recording tab
Switch to the Snapshot Recording Tab and Click the Create
button.
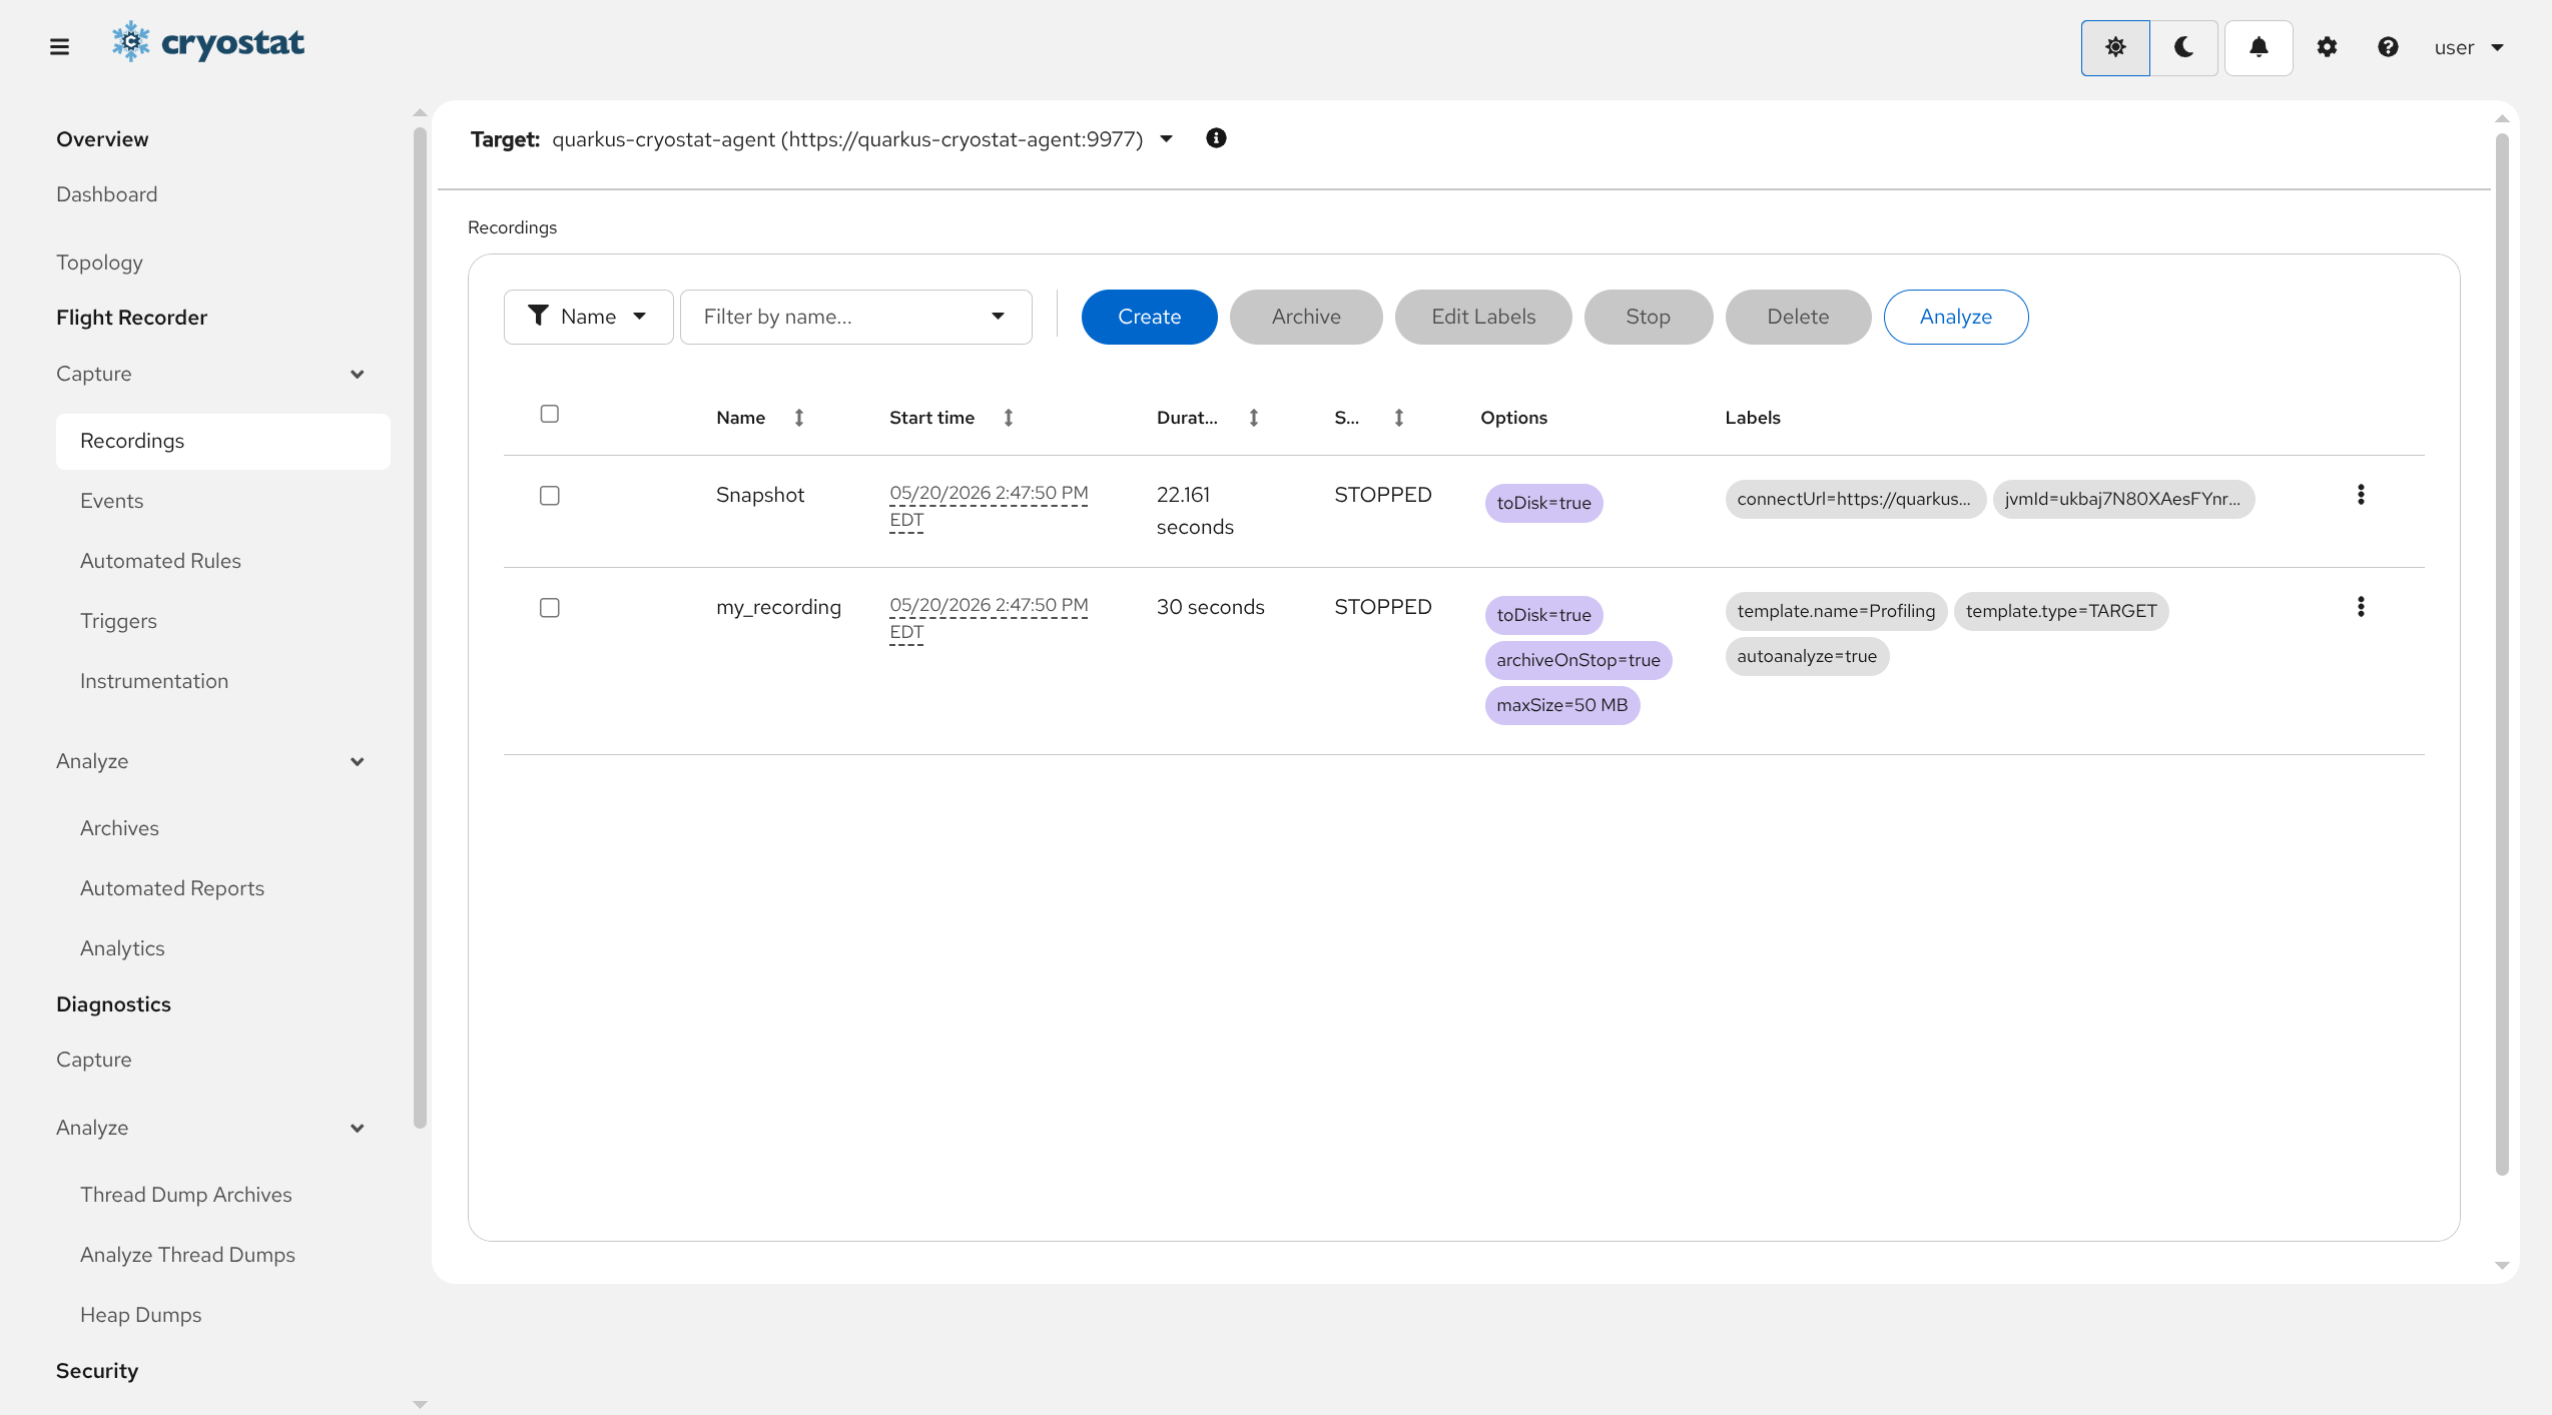
Observe the New snapshot
After clicking the Create button you will be returned to the
Active Recordings view and the new snapshot recording will be present
in the table. The snapshot recording can then be treated as any other
Active Recording in the target application's JVM memory.
In contrast to Active Recordings, which reside within the container
of the target application, Archived Recordings reside within persistent
storage attached to a Cryostat instance. In OpenShift, for example, the
archives are stored in a PersistentVolumeClaim.
Archived Recordings are created by performing archival upon Active Recordings.
When this is requested, Cryostat connects to the target application and copies
the Flight Recorder data from the selected Active Recording into an Archived
Recording file in storage. The Active Source Recording may be Continuous or
Fixed-duration, using any Event Template, in
any state (RUNNING, STOPPED, etc.), and may even be a snapshot.
Select the Target ApplicationClik the Dropdown arrow on the right side of Target prompt to select or create a target.
If you wish to create a Custom Target from here, click Create Target displayed at the bottom. Go to Create a Custom Target and proceed from step 3.
Also, see Using the Cryostat Agent section to help discover other targets.
Navigate to Flight Recorder/Capture/Recordings
Supply JMX credentials to authenticate to the target, if necessary. If
the target is not configured with JMX authentication then the
connection attempt will continue without prompting for credentials.
If the targetJVM has SSL/TLS enabled on JMX connections, it may be
necessary to add the target's certificate to Cryostat's trust store. Go
to Add a Trusted Certificate
and return to this section after completing that guide.
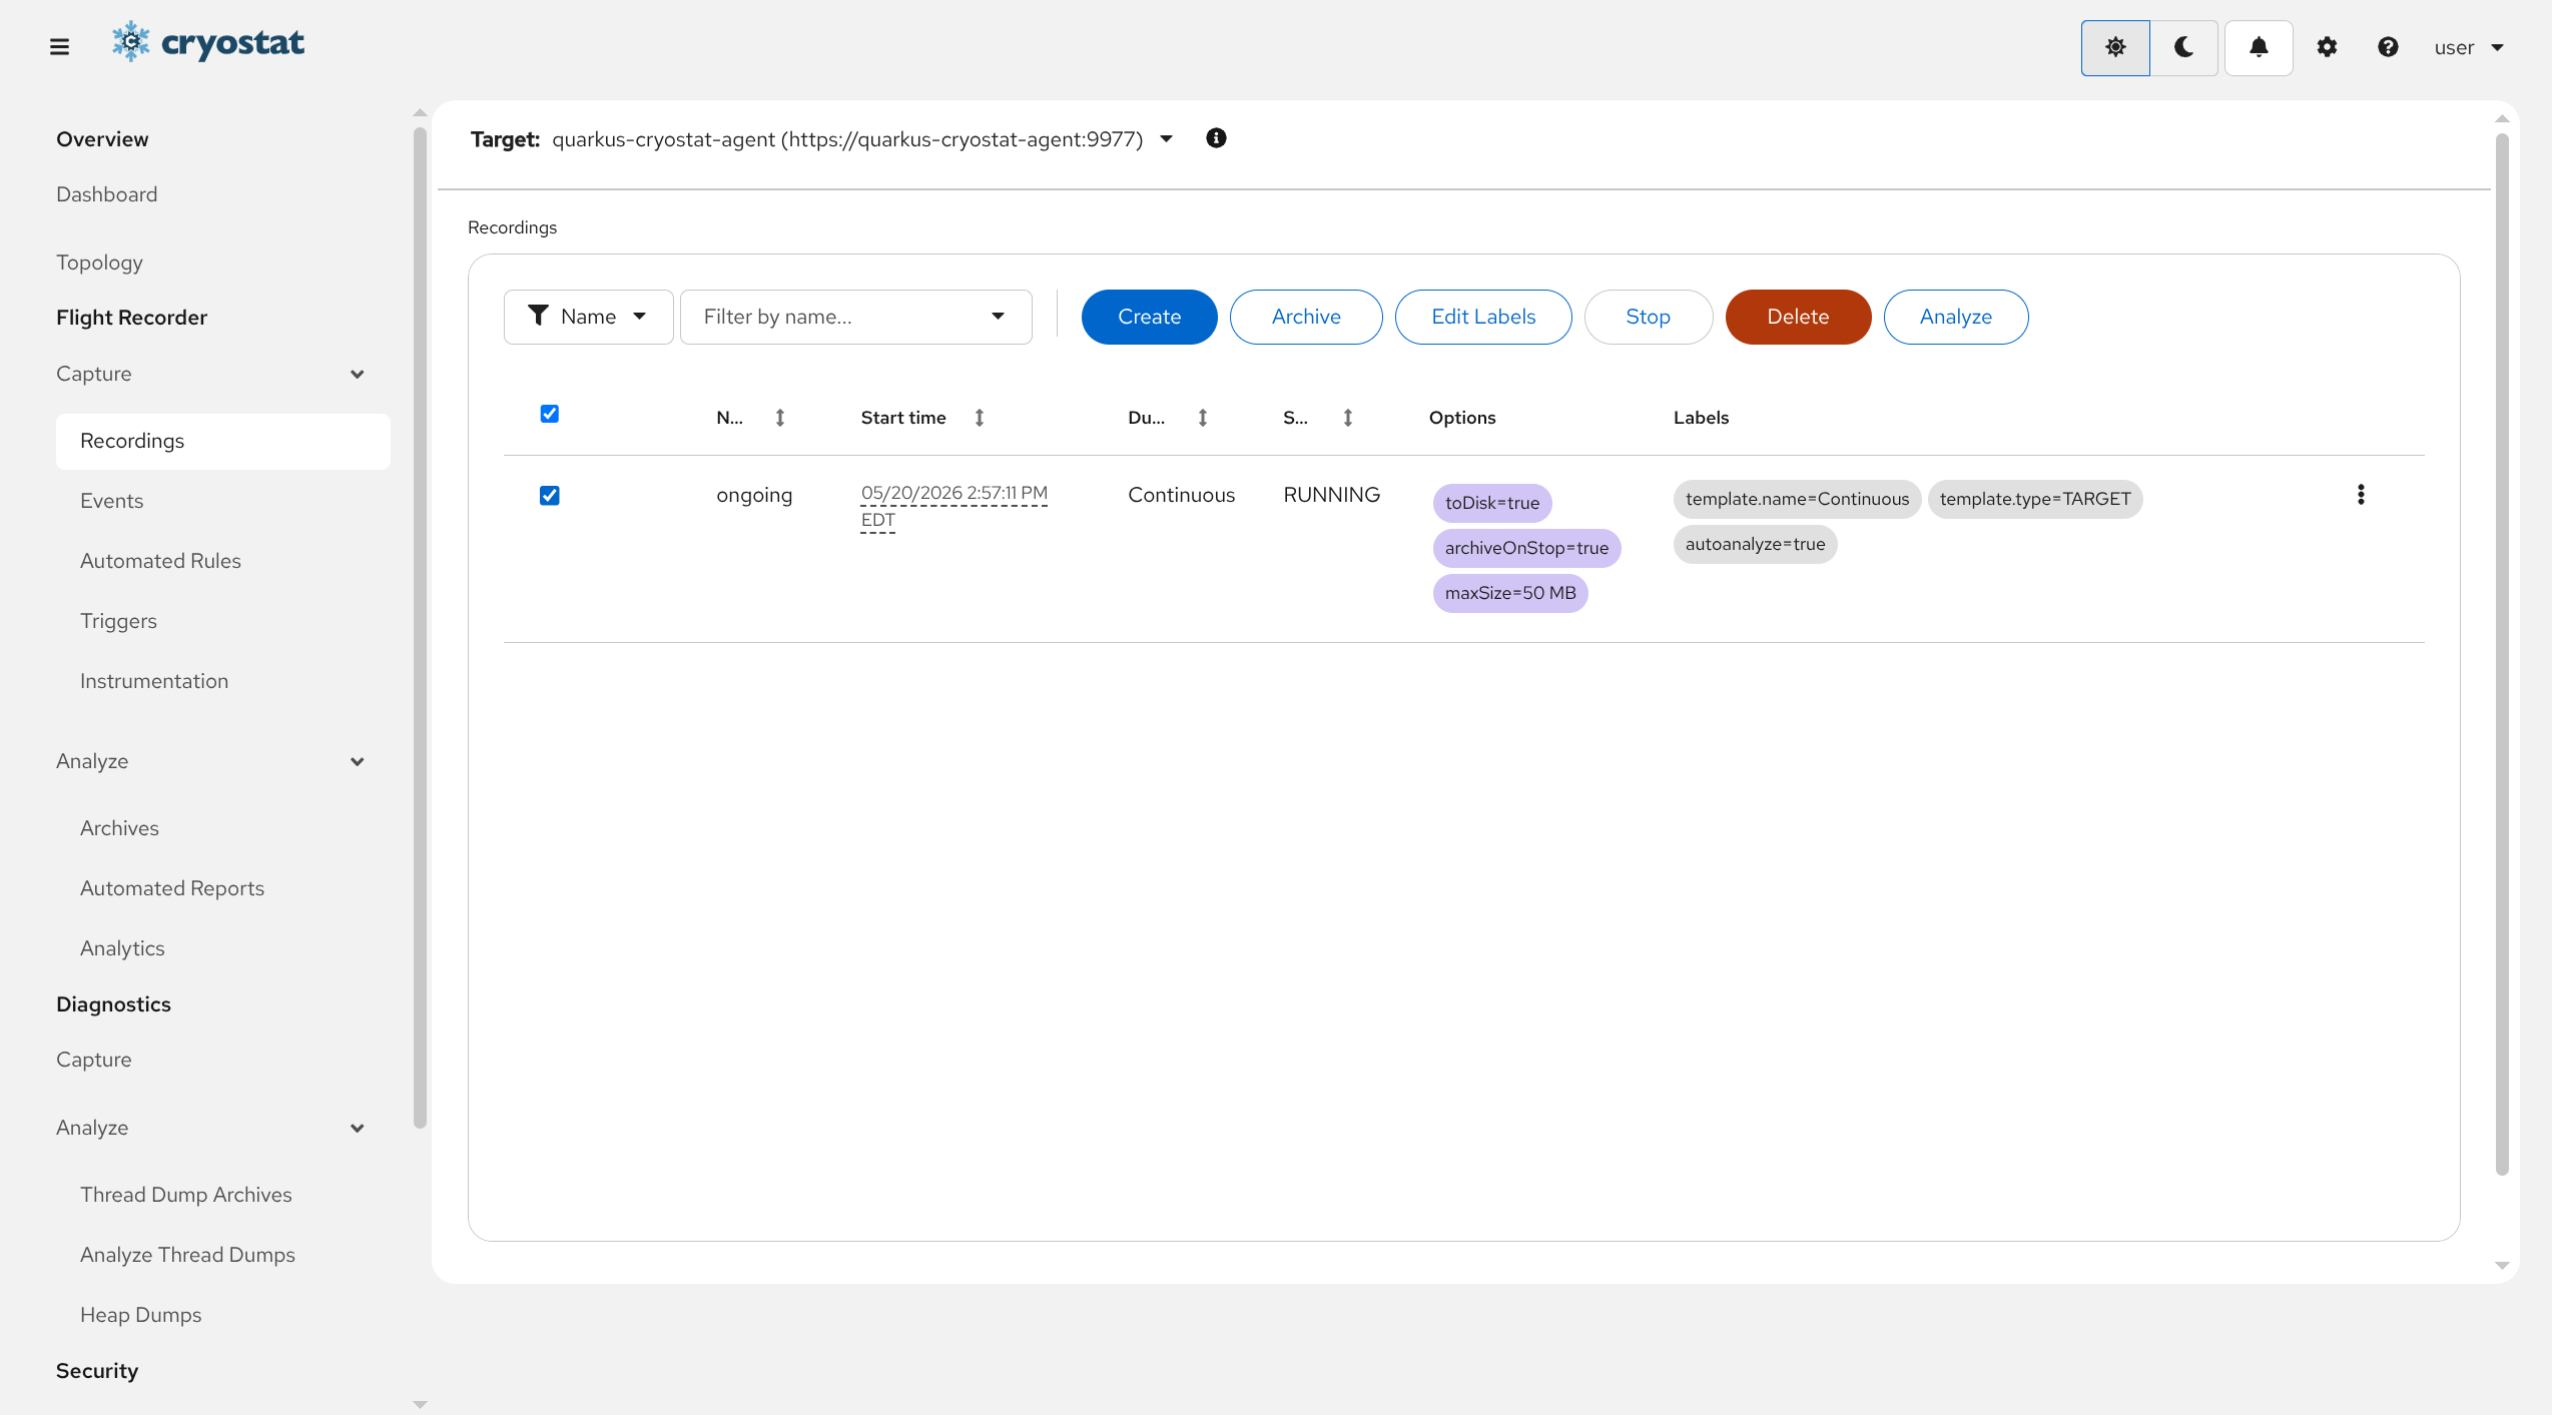
Select an Active Recording
If you do not have any Recordings present in the Active Recordings
view, follow
Start/Stop a Recording
to create one, or select a different target application.
Click the Archive button
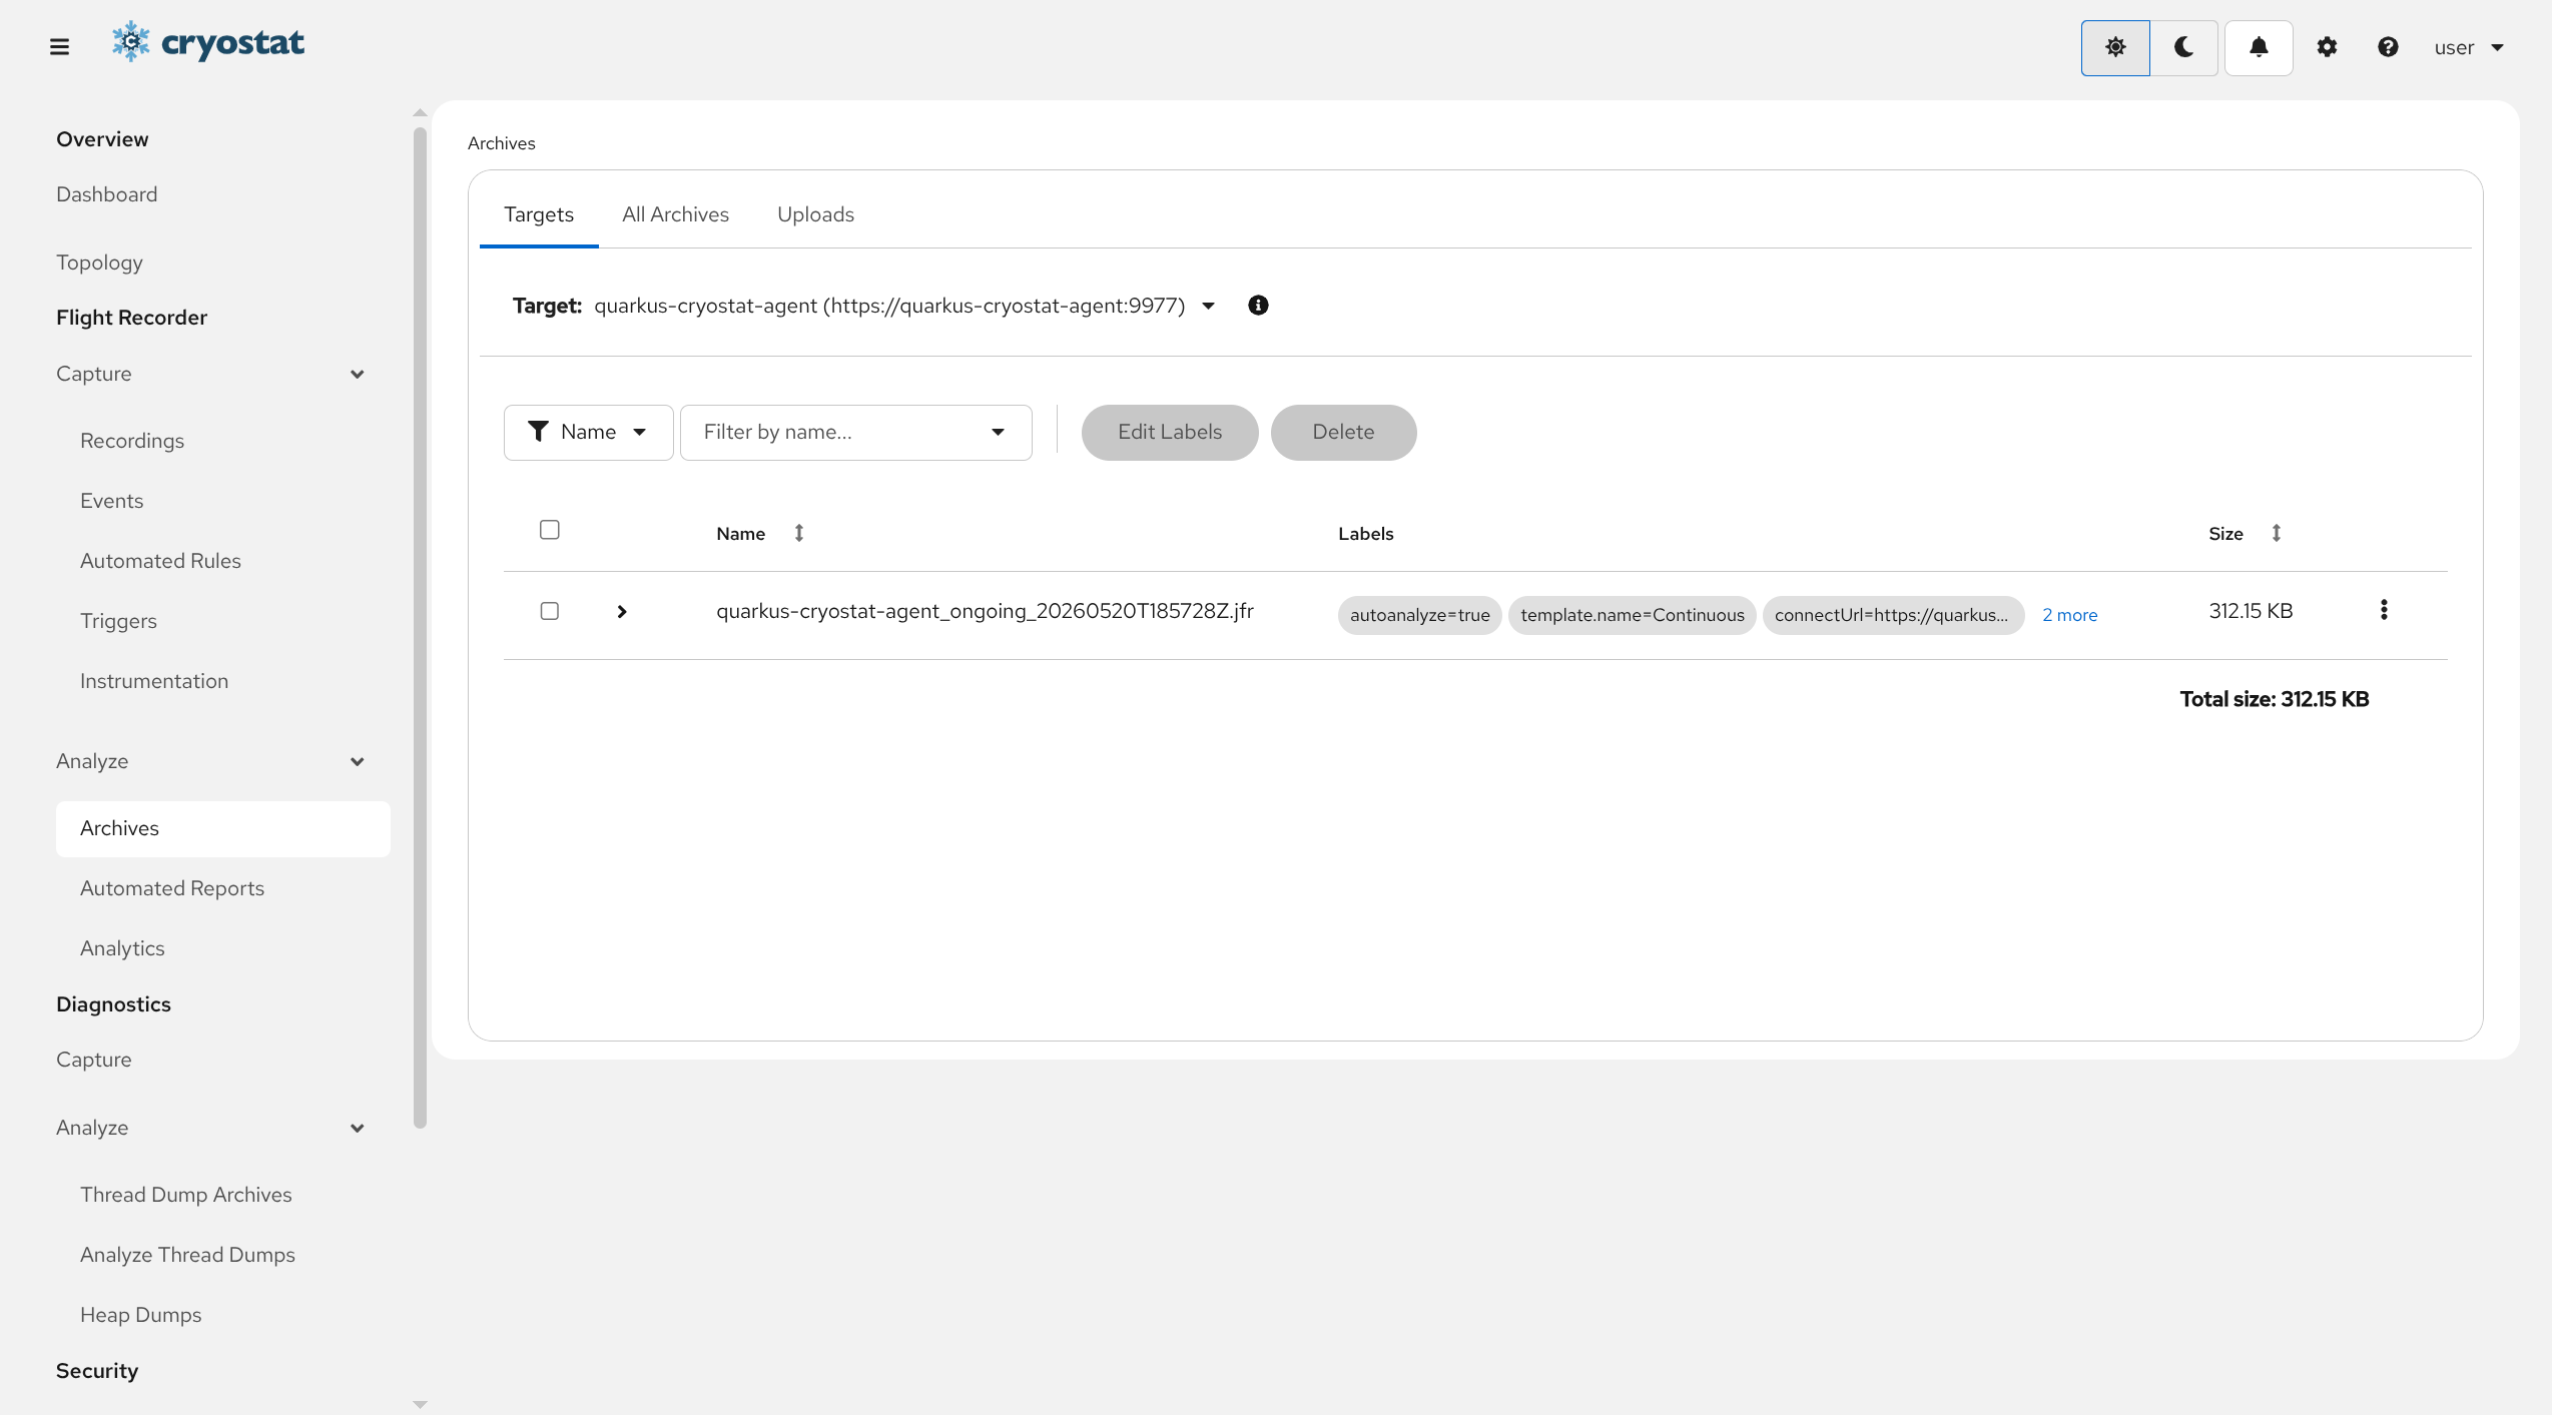
Navigate to the Flight Recorder/Analyze/Archives view
Once the Recording has been archived, a new entry will appear in the
targetJVM'sArchived Recordings table.
All Recordings that were
saved from the current target will be listed here in their own table.
Switching to a different target from the dropdown will list only the
Recordings archived from that source target. The name of the Archived
Recording reflects the address of the target application, the original
name of the Active Recording that it was retrieved from, and includes a
timestamp indicating when the Archived Recording was created.
There are several ways to view Archived Recordings. The first method is to navigate to the Flight Recorder/Analyze/Archives view to list Archived Recordings belonging to a single target. See Archive a Recording.
The second method is to view the All-Targets archived recording table within the Flight Recorder/Analyze/Archives view on the Cryostat console sidebar.
The All-Targets view gathers all of Cryostat’s discovered targetJVM applications into one section for ease of access. Here, we are able to interact with any Archived Recordings that have been saved from a source target by opening a target’s nested recordings table.
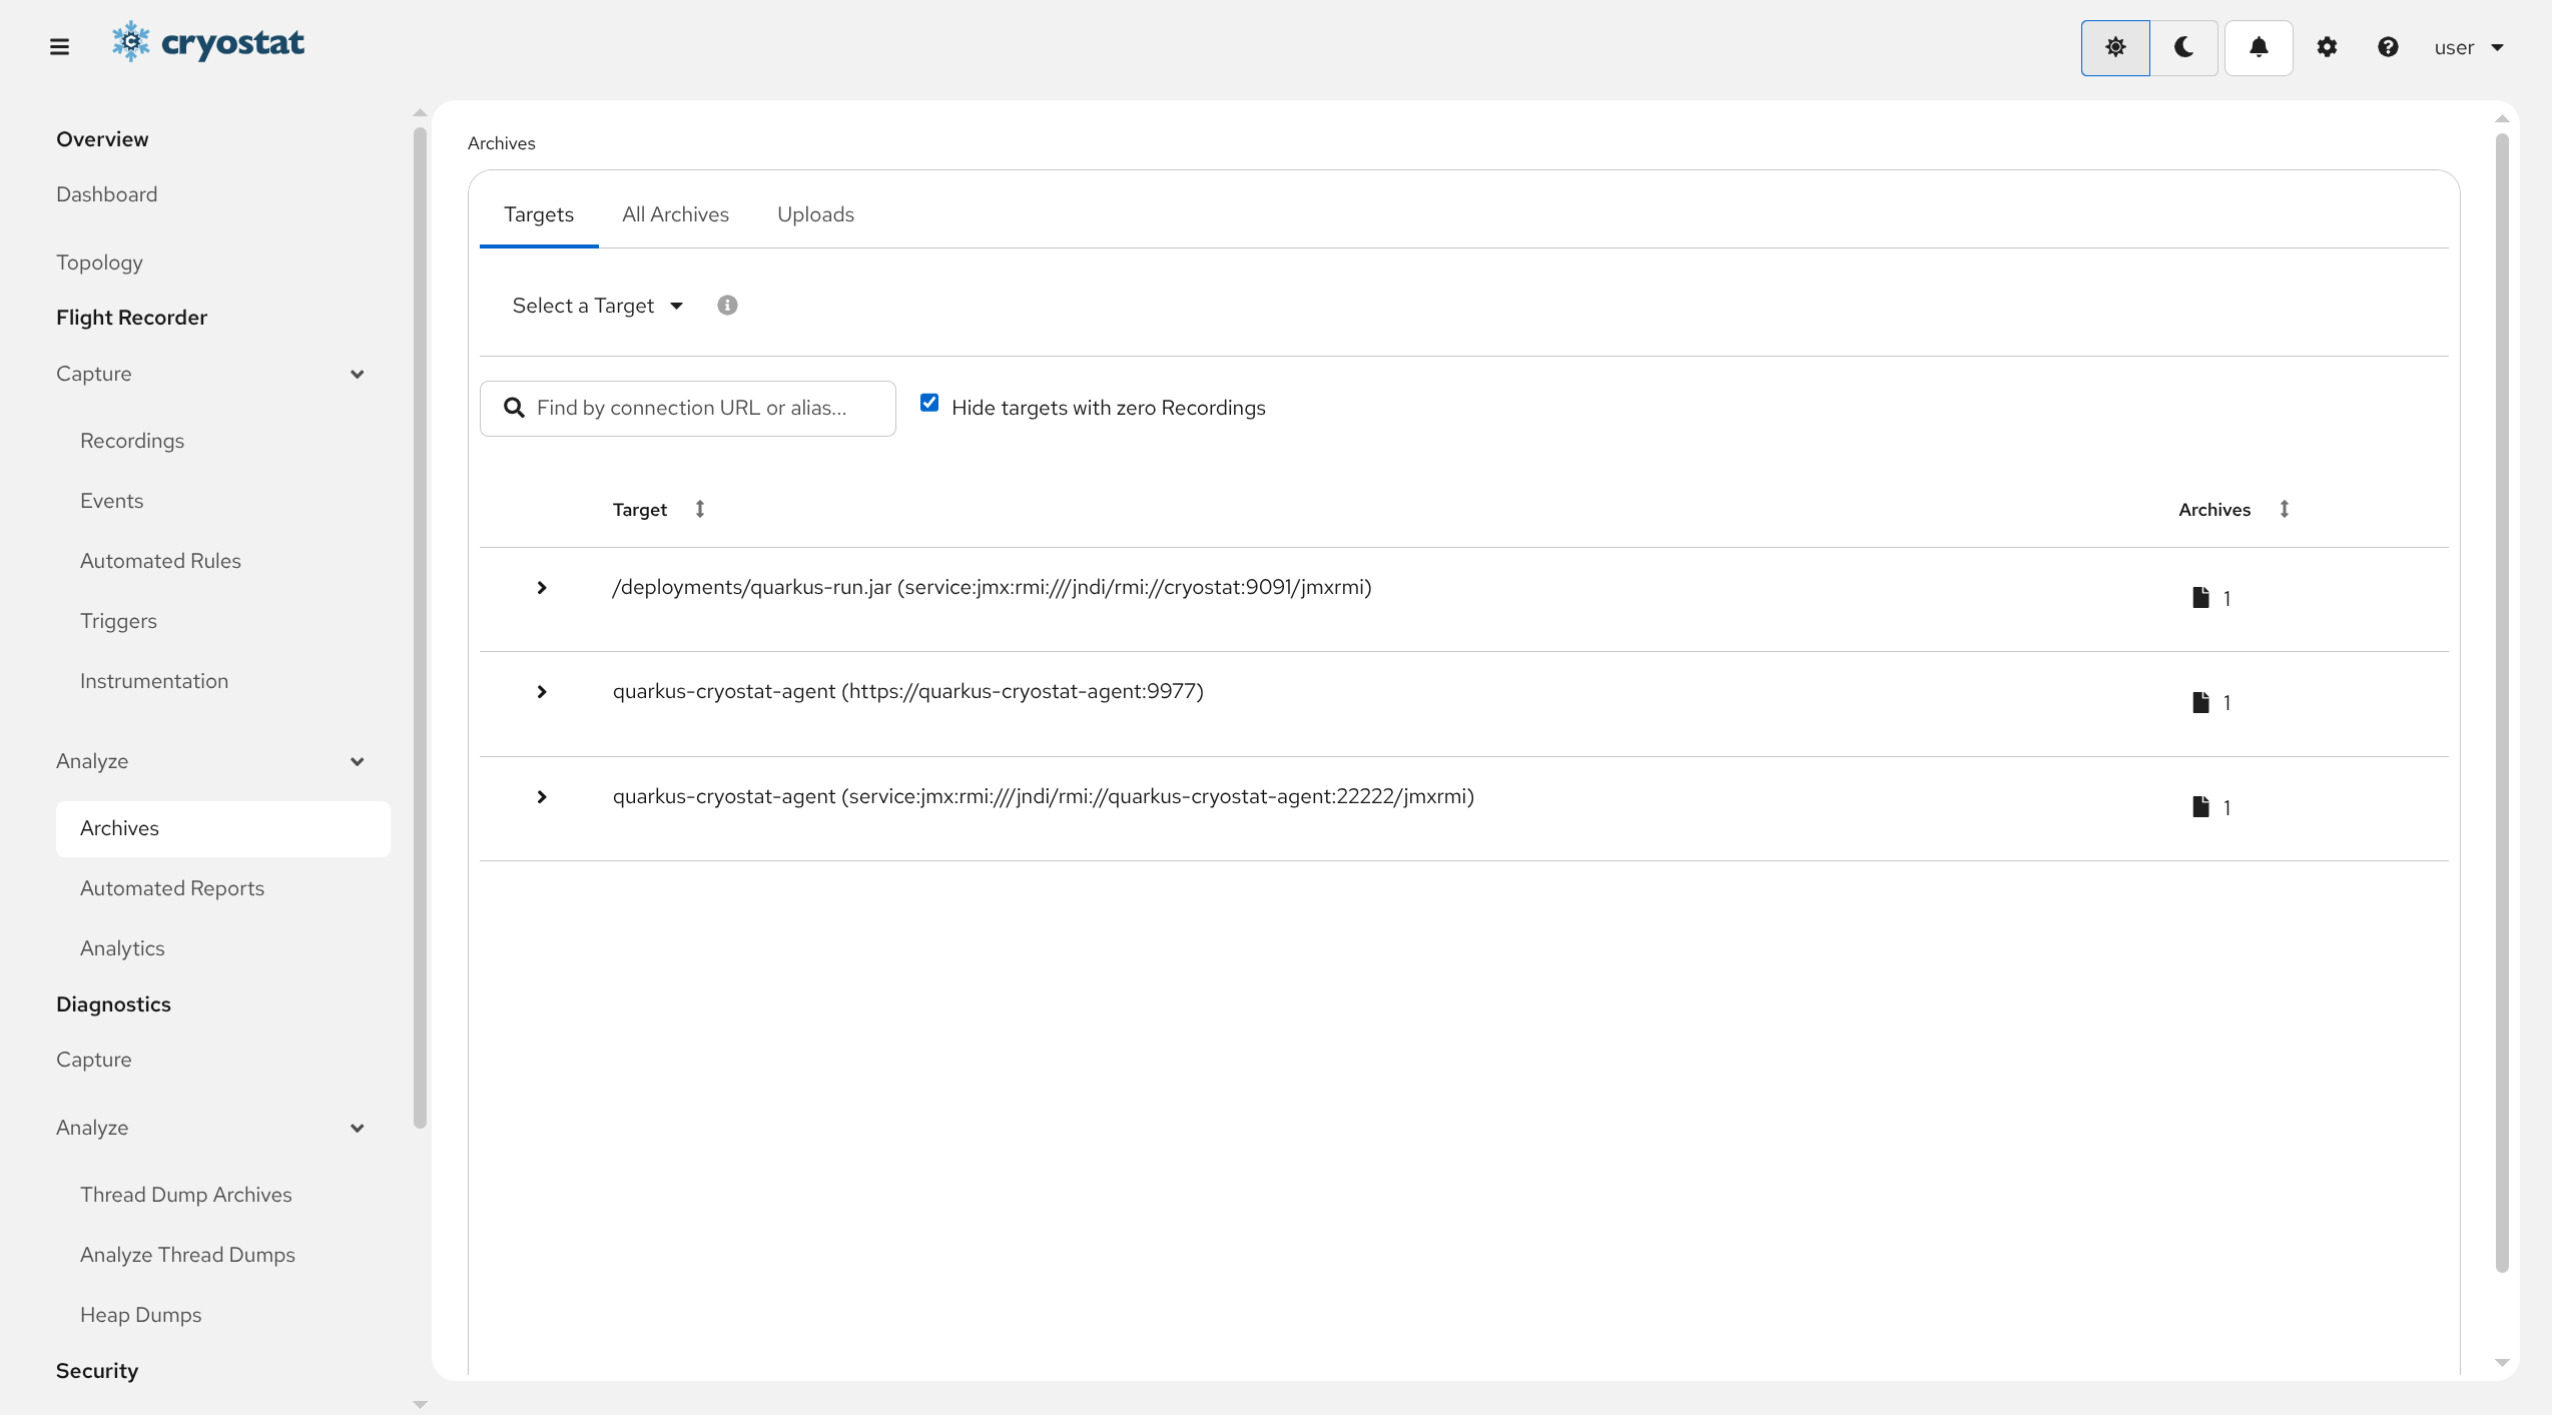
Navigate to the All-Targets Archived Recordings viewClick on the Flight Recorder/Analyze/Archives route on the sidebar, and the first tab should automatically be selected as the Targets Archives view.
If you clear the target selection from the dropdown, the view will
change into a nested table format. The outer table will render a list of currently discovered
target applications. Expanding each of these table rows will reveal an inner table containing
the list of Archived Recordings retrieved from that target.
The option to automatically hide all targets with zero Archived Recordings is on by default and can be toggled. Targets can also be filtered in the search bar.
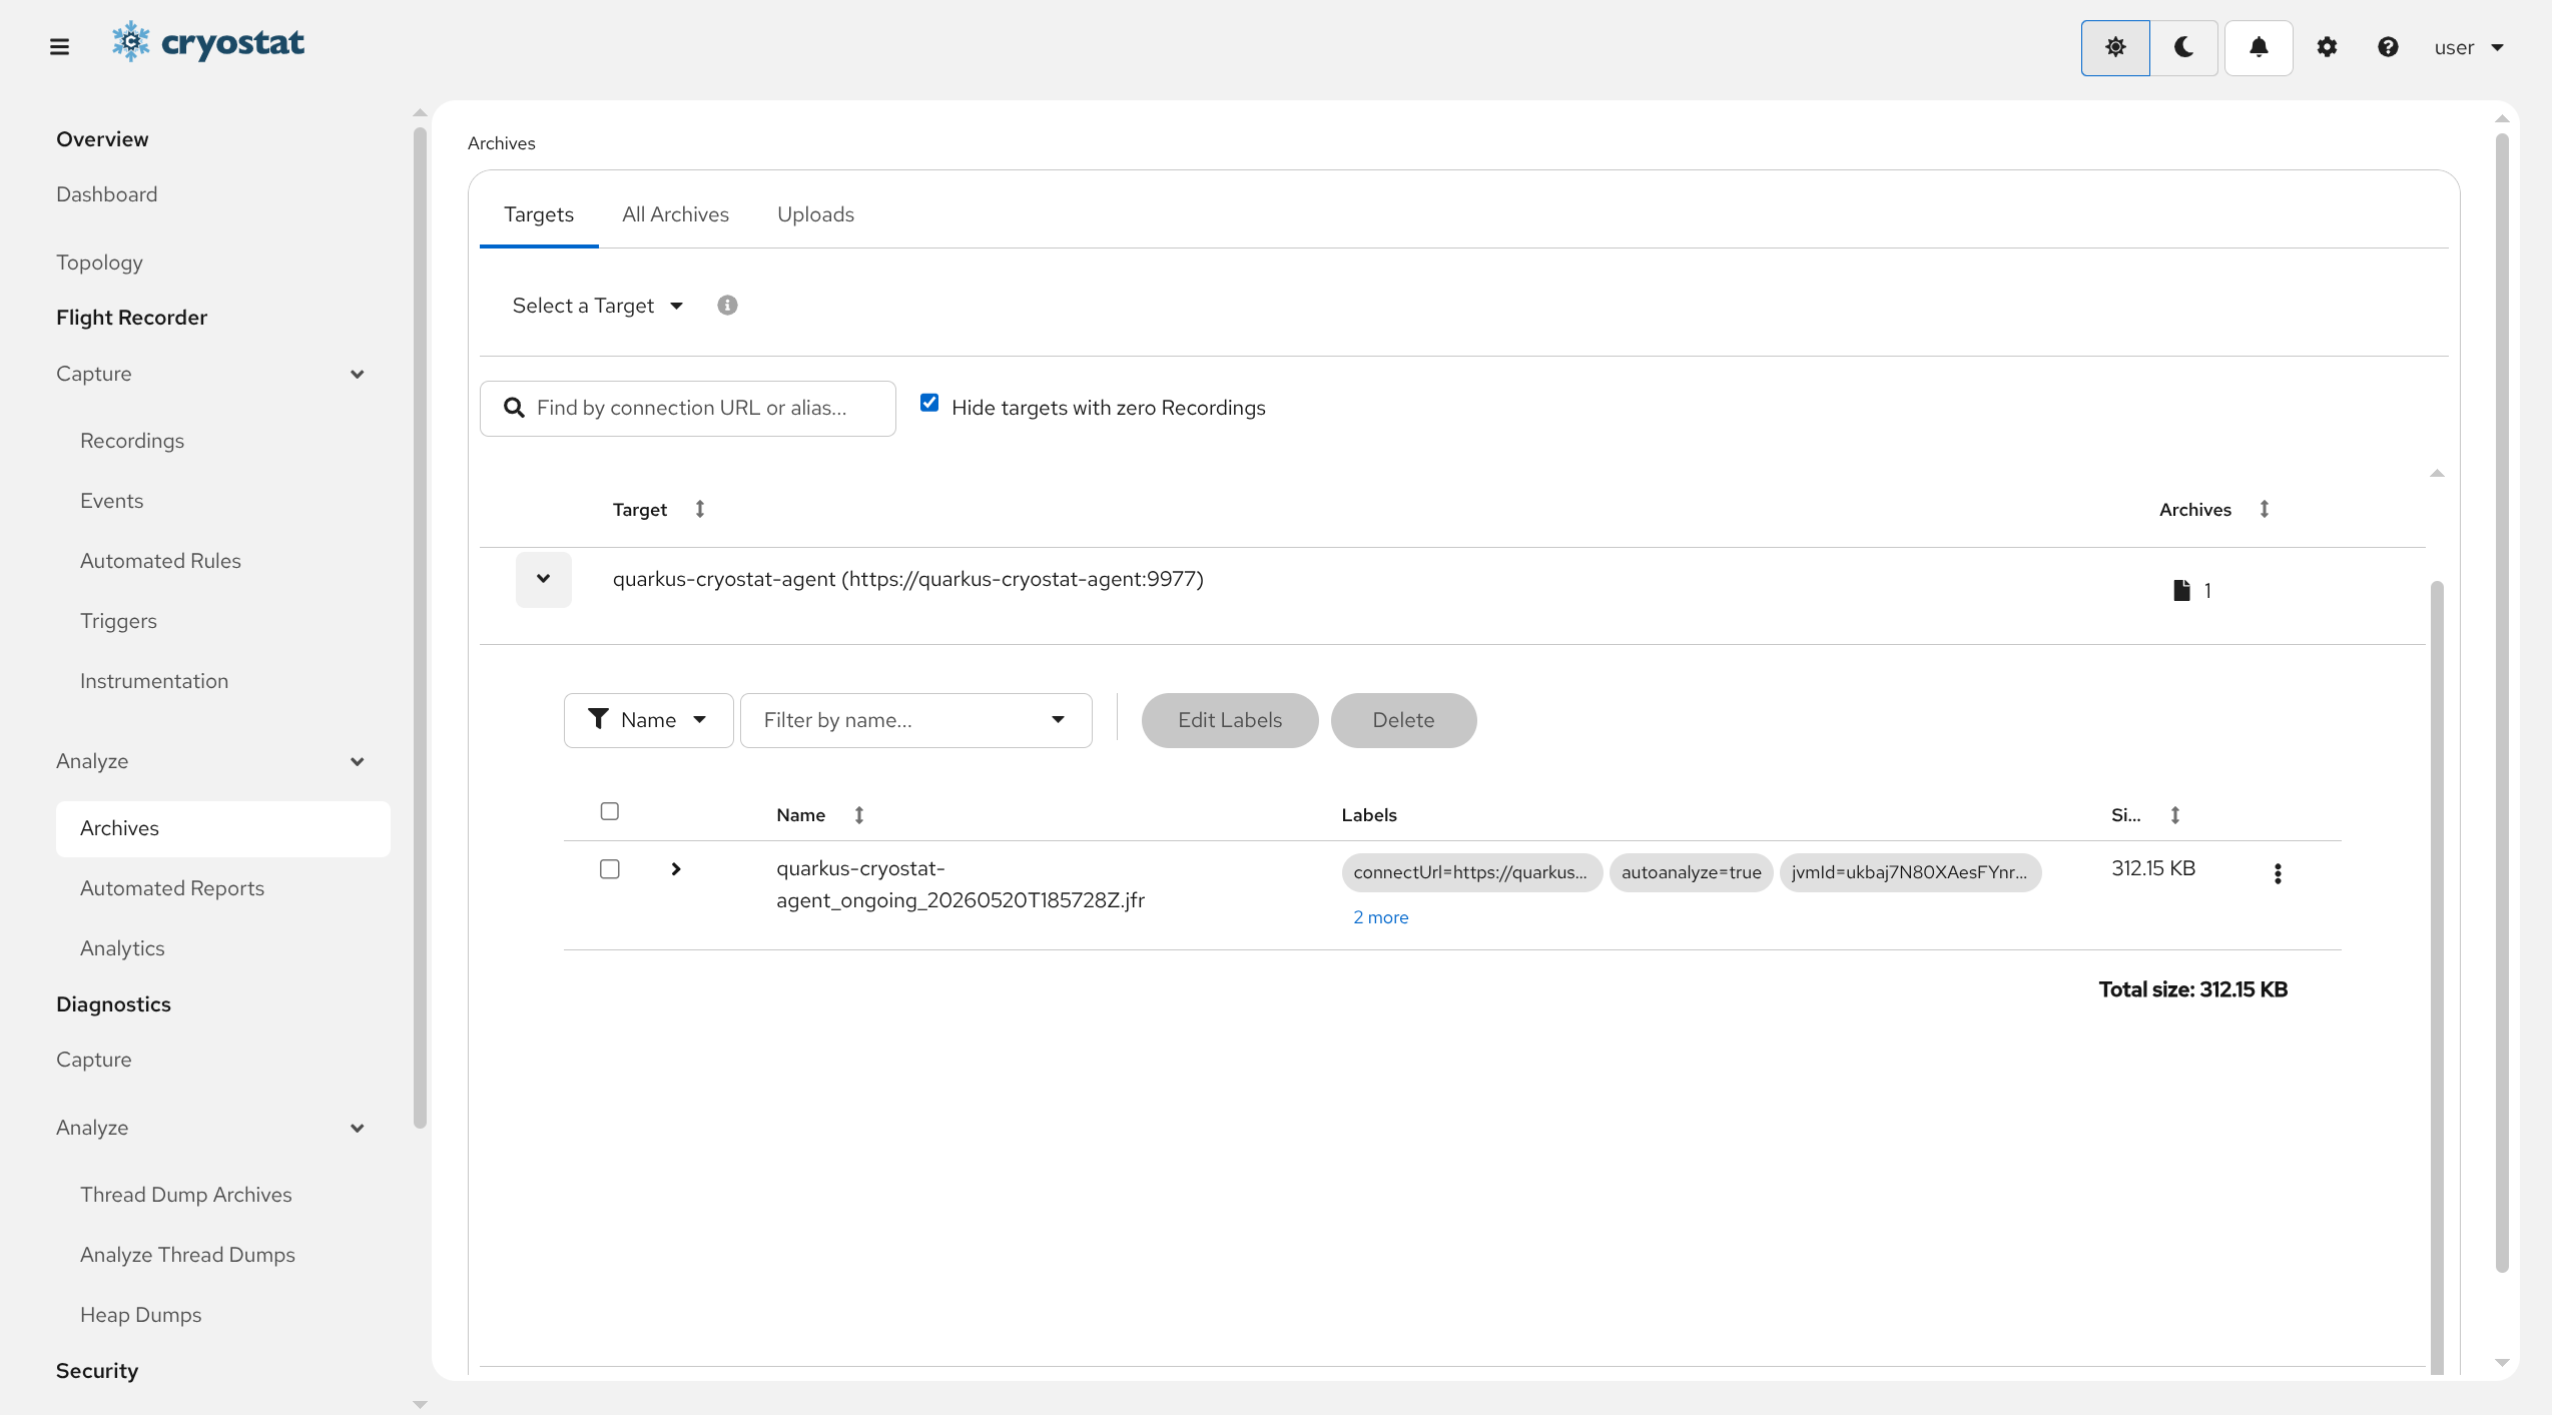
Select a Source Target ApplicationClicking the dropdown arrow next to a target name will list any Archived Recordings originating from that source target.
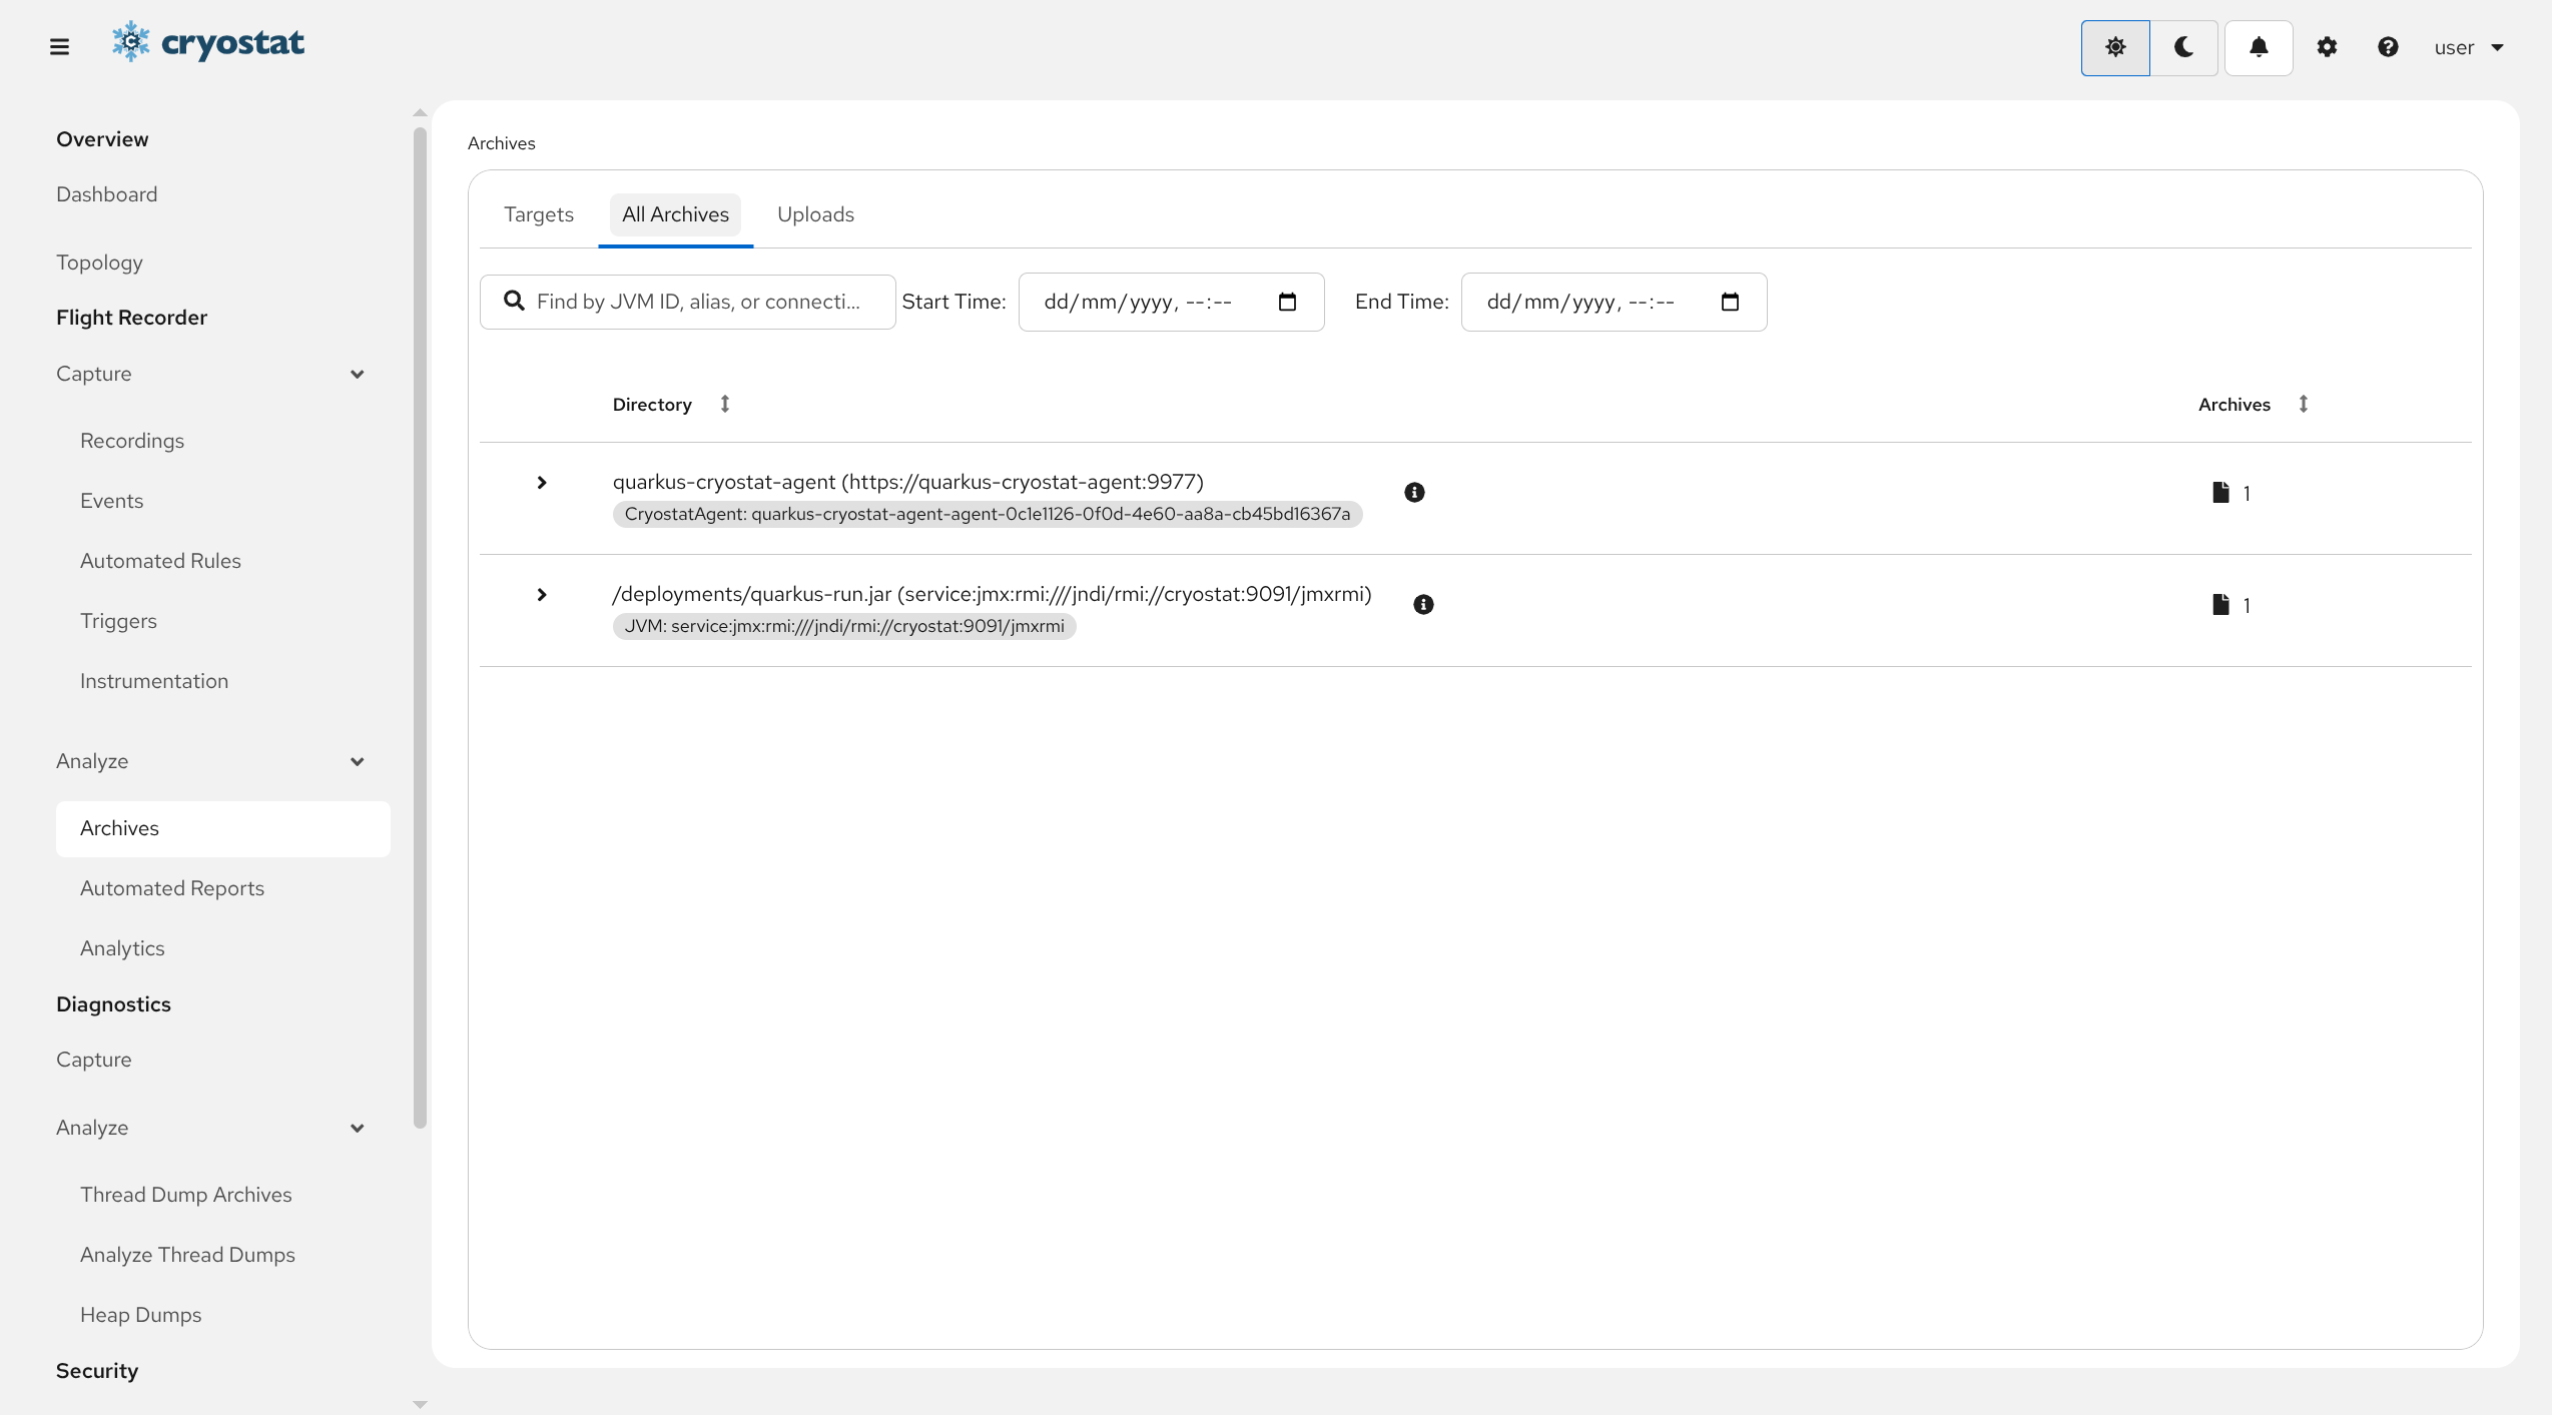
The third method is to navigate to the All-ArchivesArchived Recording view within the Flight Recorder/Analyze/Archives view on the Cryostat console sidebar.
The All-Archives view is a view which queries Cryostat’s internal storage for any created Archived Recordings and the directories that contain them. Here, we are able to interact with any Archived Recordings that have been saved into storage by opening a nested recordings table within each directory.
This view is used to save any lost Archived Recordings in case any targetJVM restarts or exits. It will be empty if no Recordings are currently saved to storage.
Navigate to the All-ArchivesArchived Recordings ViewClick on the Flight Recorder/Analyze/Archives view on the sidebar, and select the second tab titled All Archives.
Directories can be filtered in the search bar.
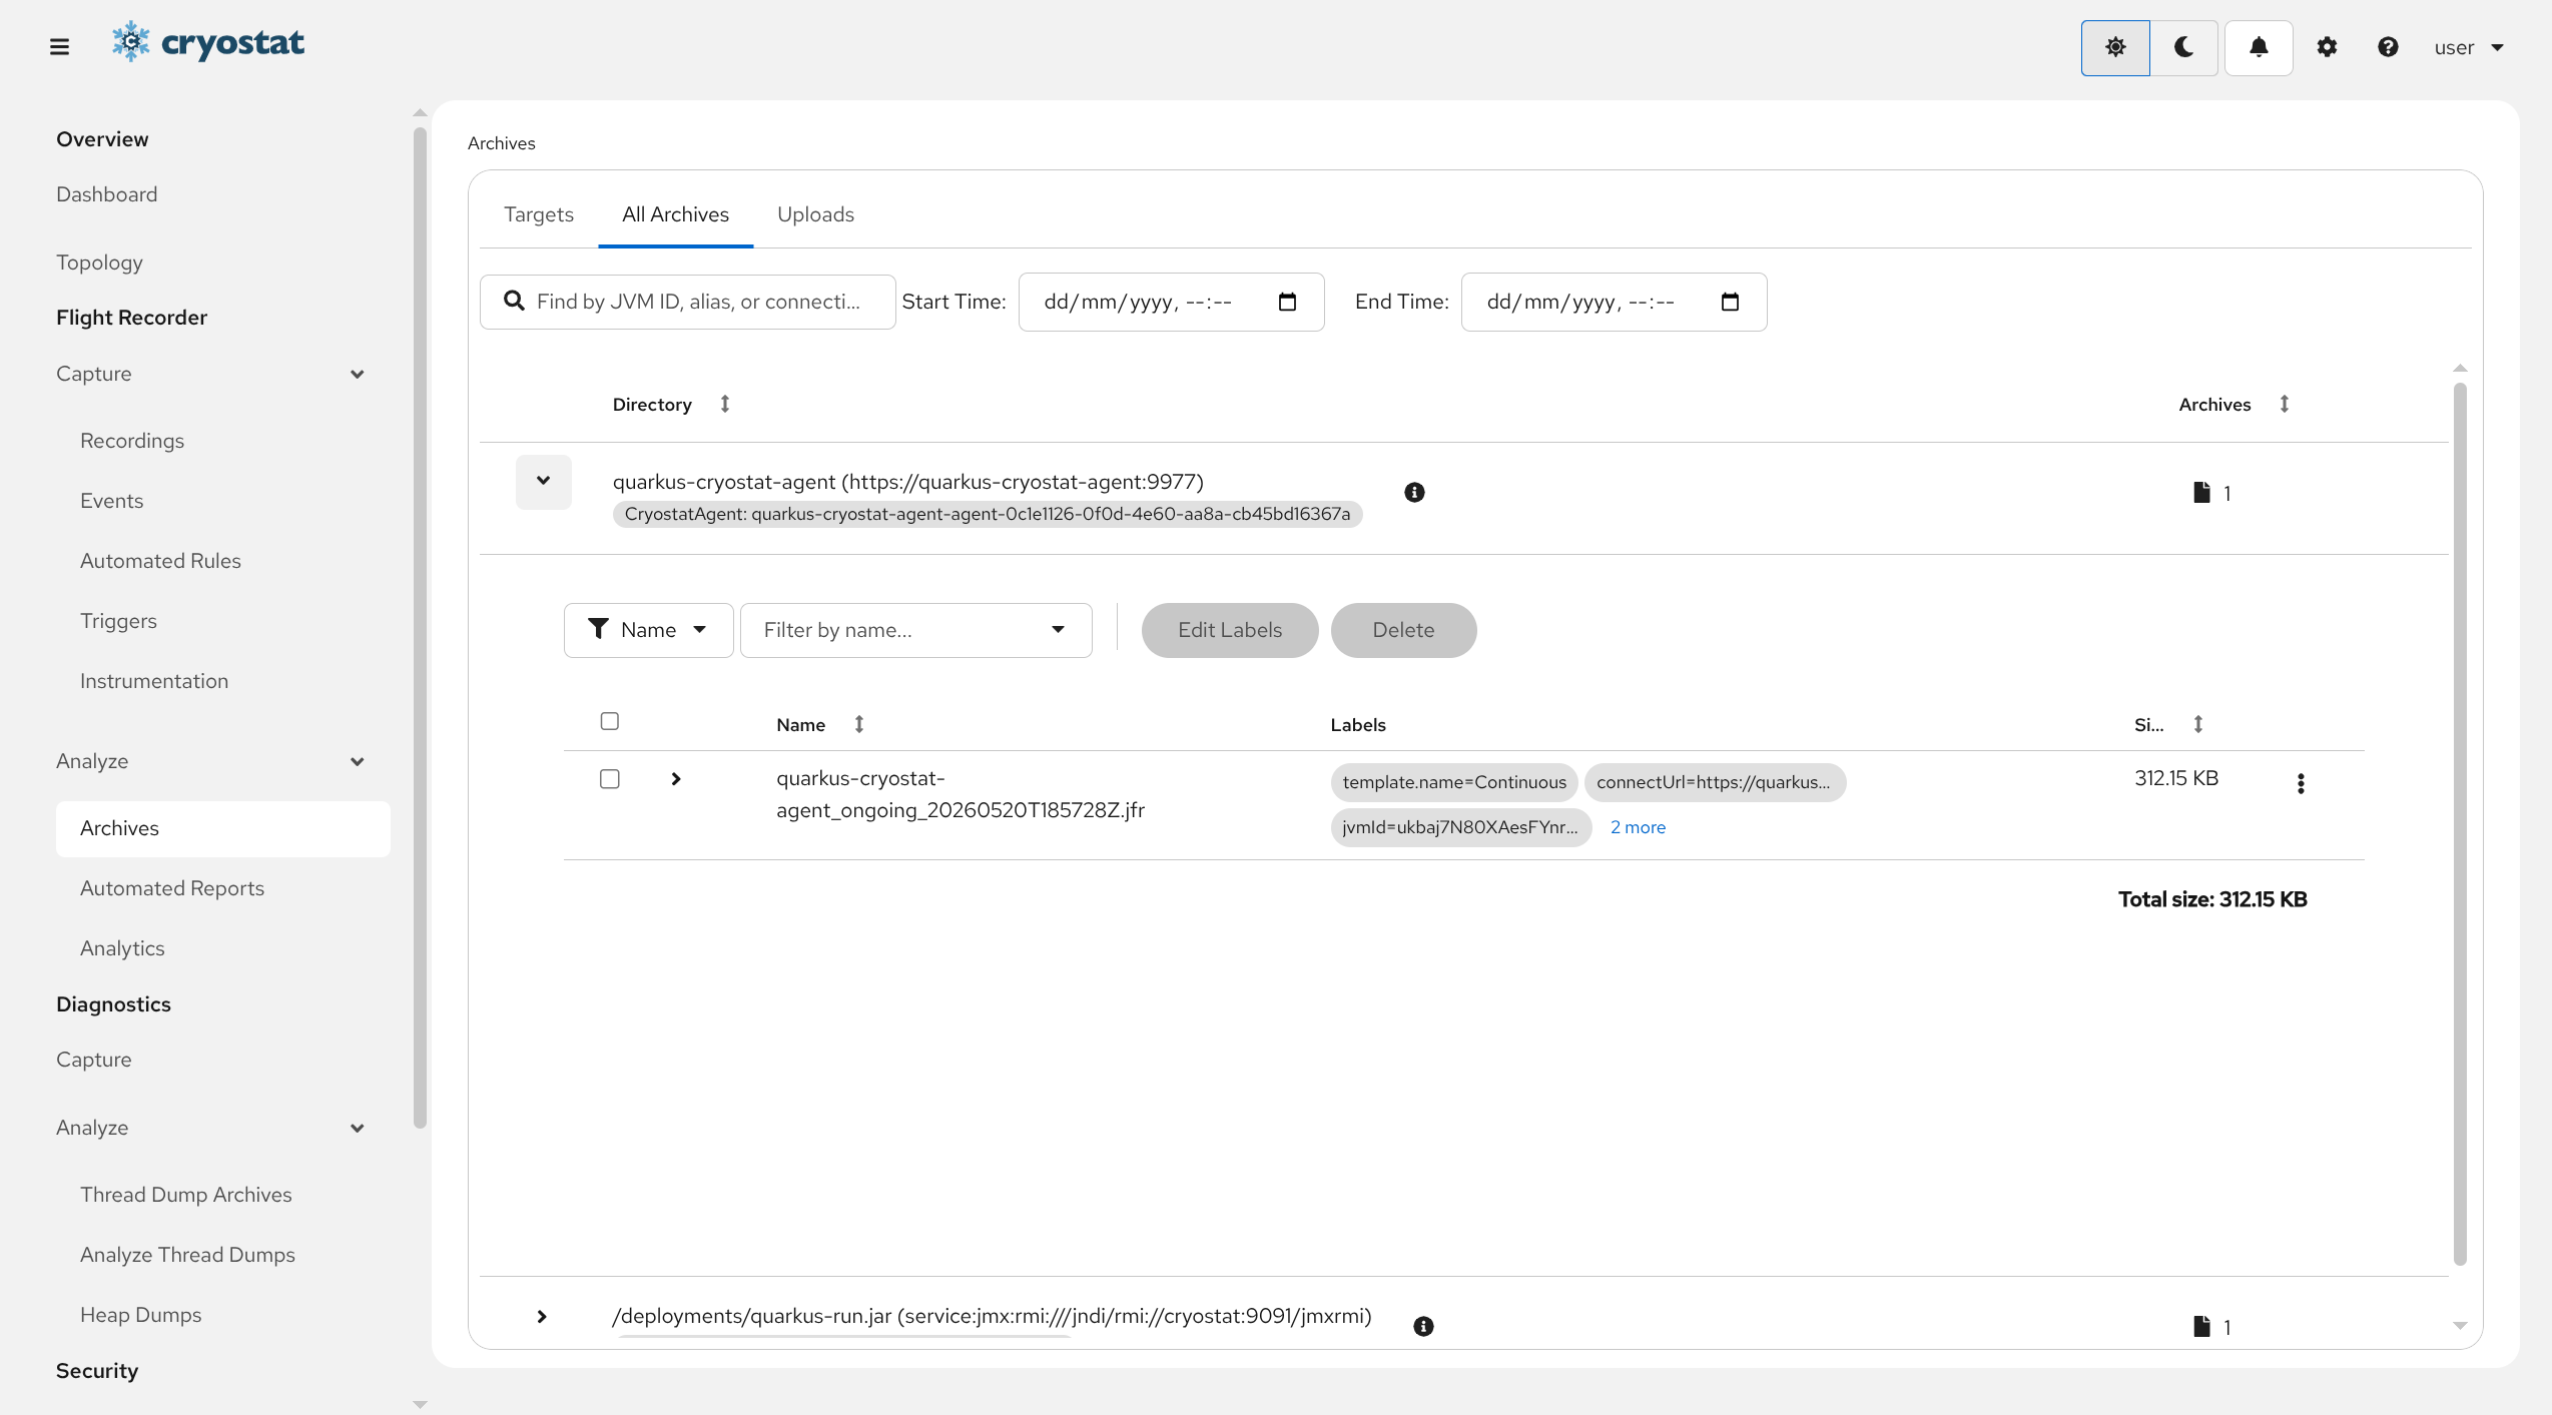
Select an Archives directoryClicking the dropdown arrow next to a directory name will list any Archived Recordings within that directory in the Cryostat storage. Again, we can interact with any Archived Recordings in a similar fashion as before.
A directory name is related to its corresponding source target's serviceUrl. Mousing over the tooltip, we can also see a Cryostat generated hash ID for that target.
Cryostat provides some basic capabilities for analysis of Flight Recording data
in-cluster. However, the core analysis workflow is to collect JFR files from
target applications and copy them to local developer or admin workstations, then
use tools such as JDK Mission Control,
Visual VM, binjr,
or jfr for the heavy lifting on your workstation.
Select the Target ApplicationClik the Dropdown arrow on the right side of Target prompt to select or create a target.
If you wish to create a Custom Target from here, click Create Target displayed at the bottom. Go to Create a Custom Target and proceed from step 3.
Also, see Using the Cryostat Agent section to help discover other targets.
Navigate to Flight Recorder/Capture/Recordings
Supply JMX credentials to authenticate to the target, if necessary. If
the target is not configured with JMX authentication then the
connection attempt will continue without prompting for credentials.
If the targetJVM has SSL/TLS enabled on JMX connections, it may be
necessary to add the target's certificate to Cryostat's trust store. Go
to Add a Trusted Certificate
and return to this section after completing that guide.
Select a Recording
Determine the Recording you wish to download to your local workstation.
If you wish to download an Archived Recording,
navigate to the Archives view
instead. The recording table works the same way between Active
and Archived recordings.
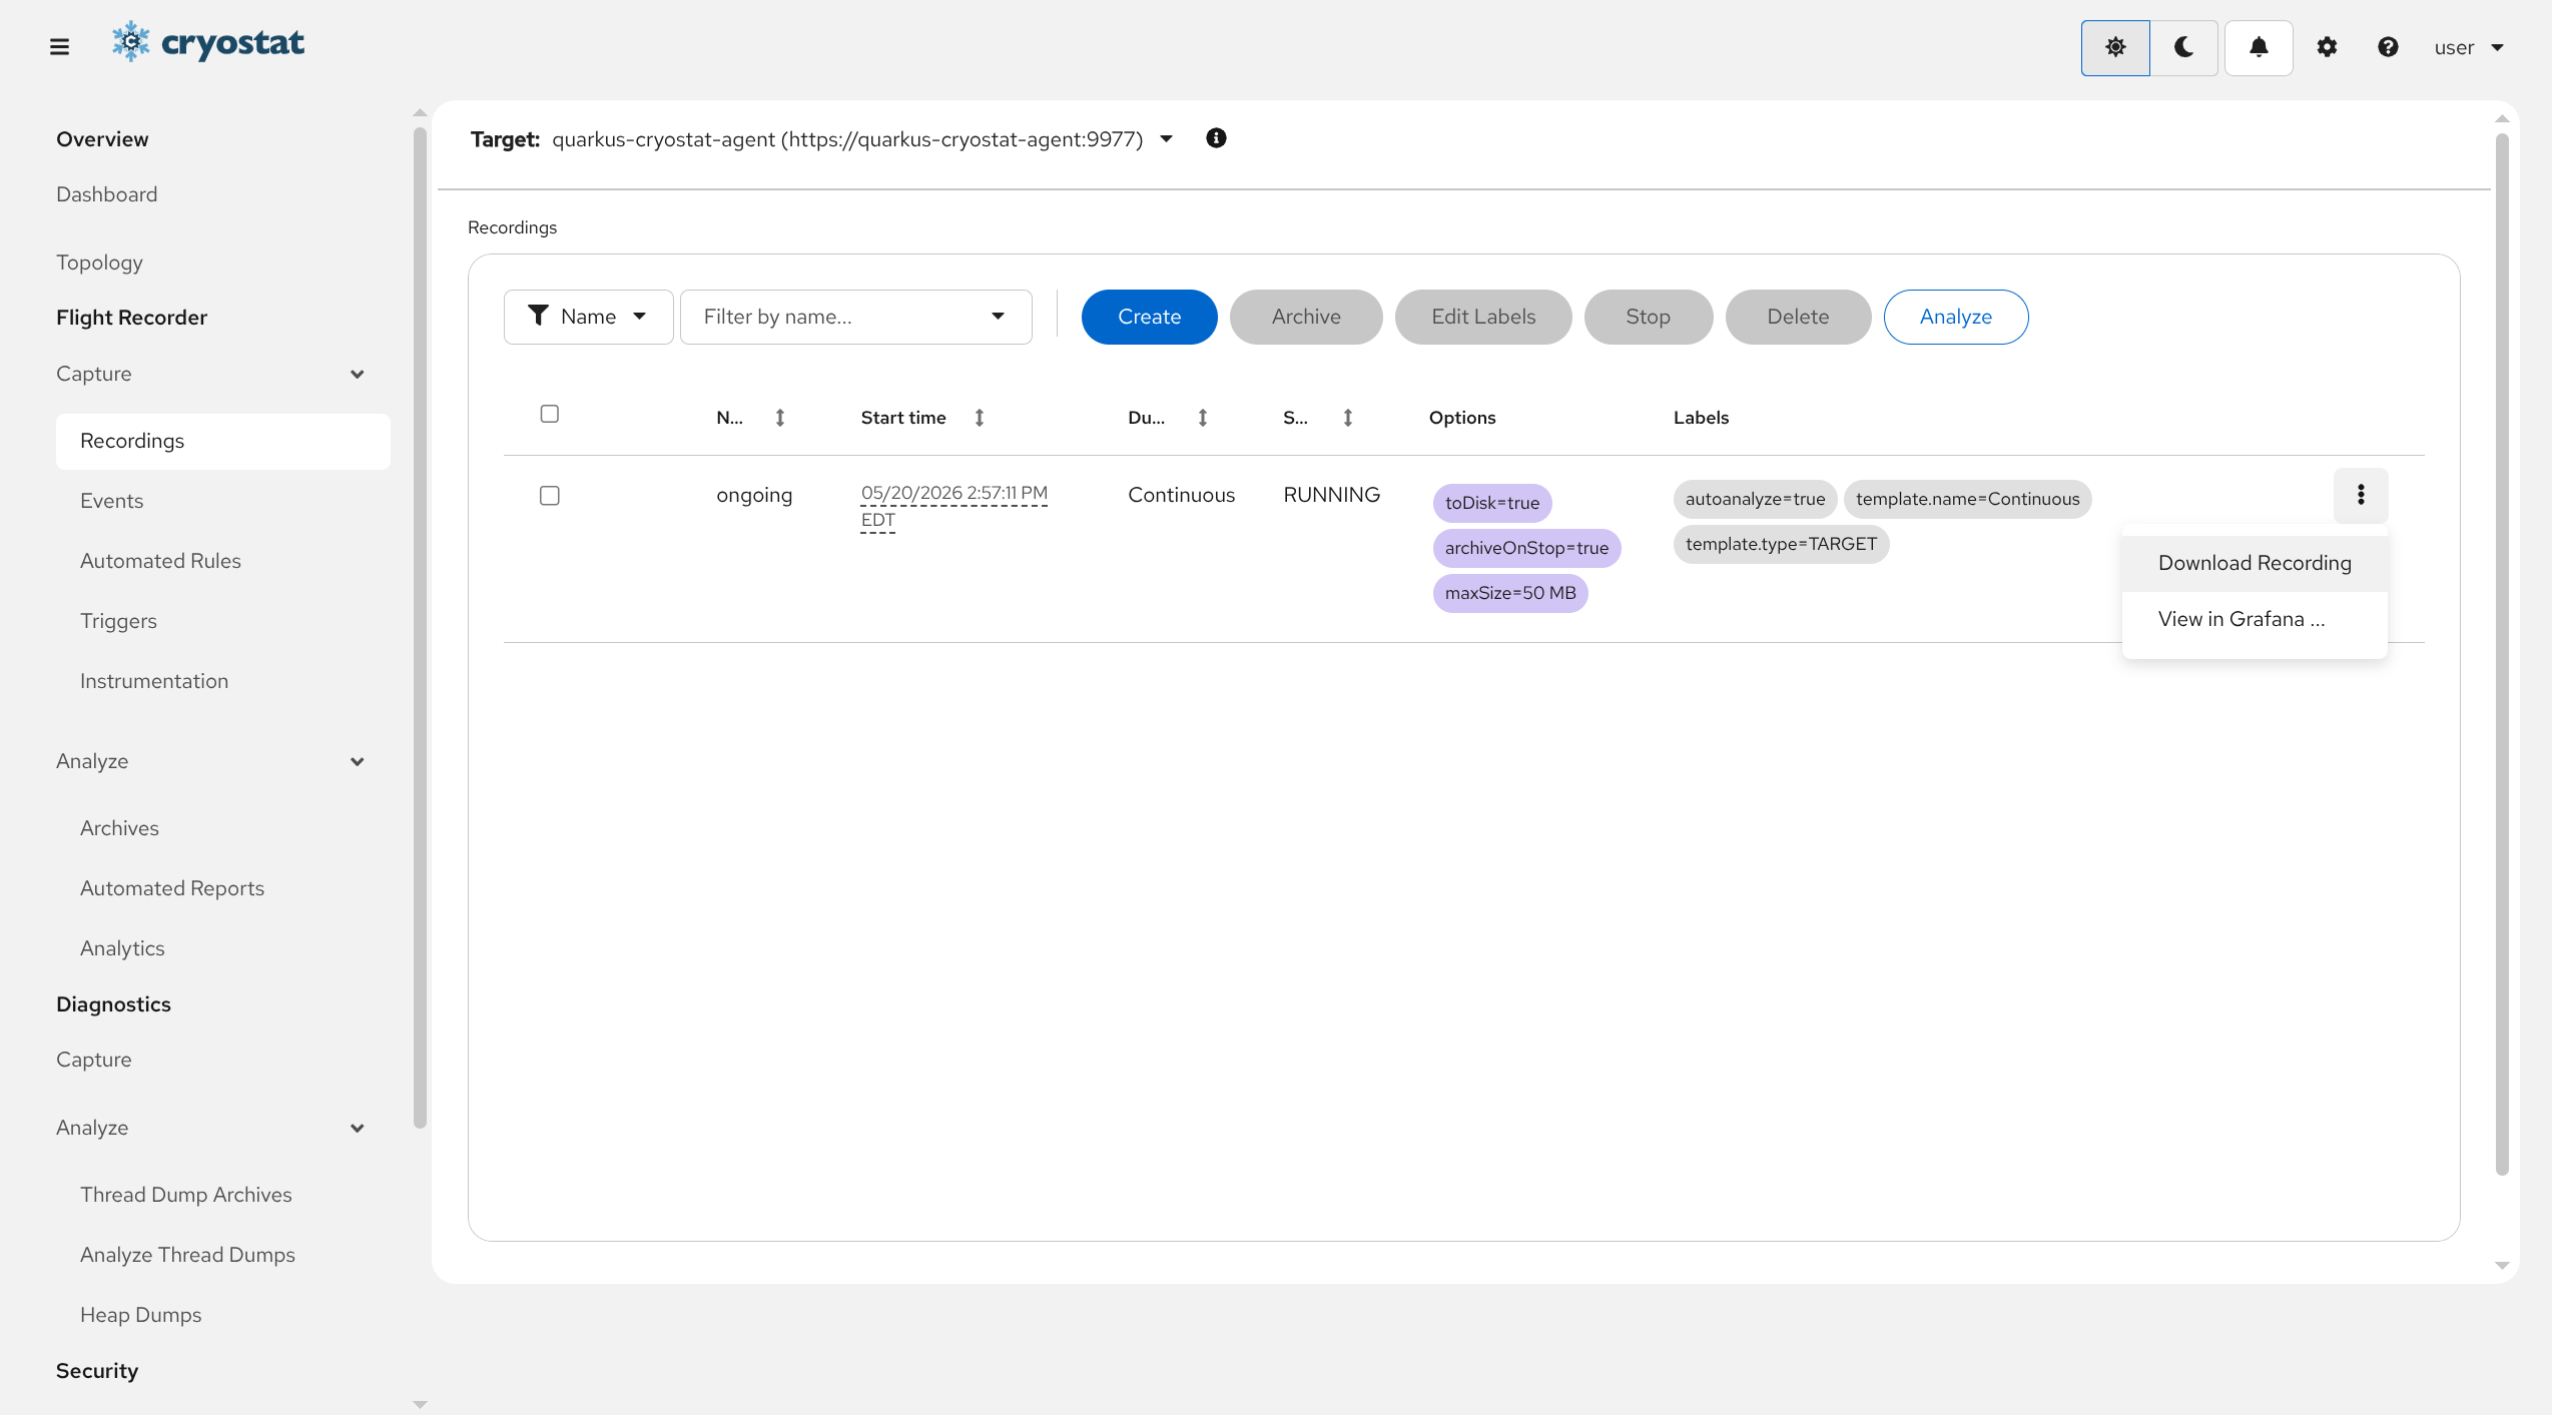
Download the Recording
Click the action overflow "︙" three-dot menu on the right side of the
recording entry in the table, then click Download Recording.
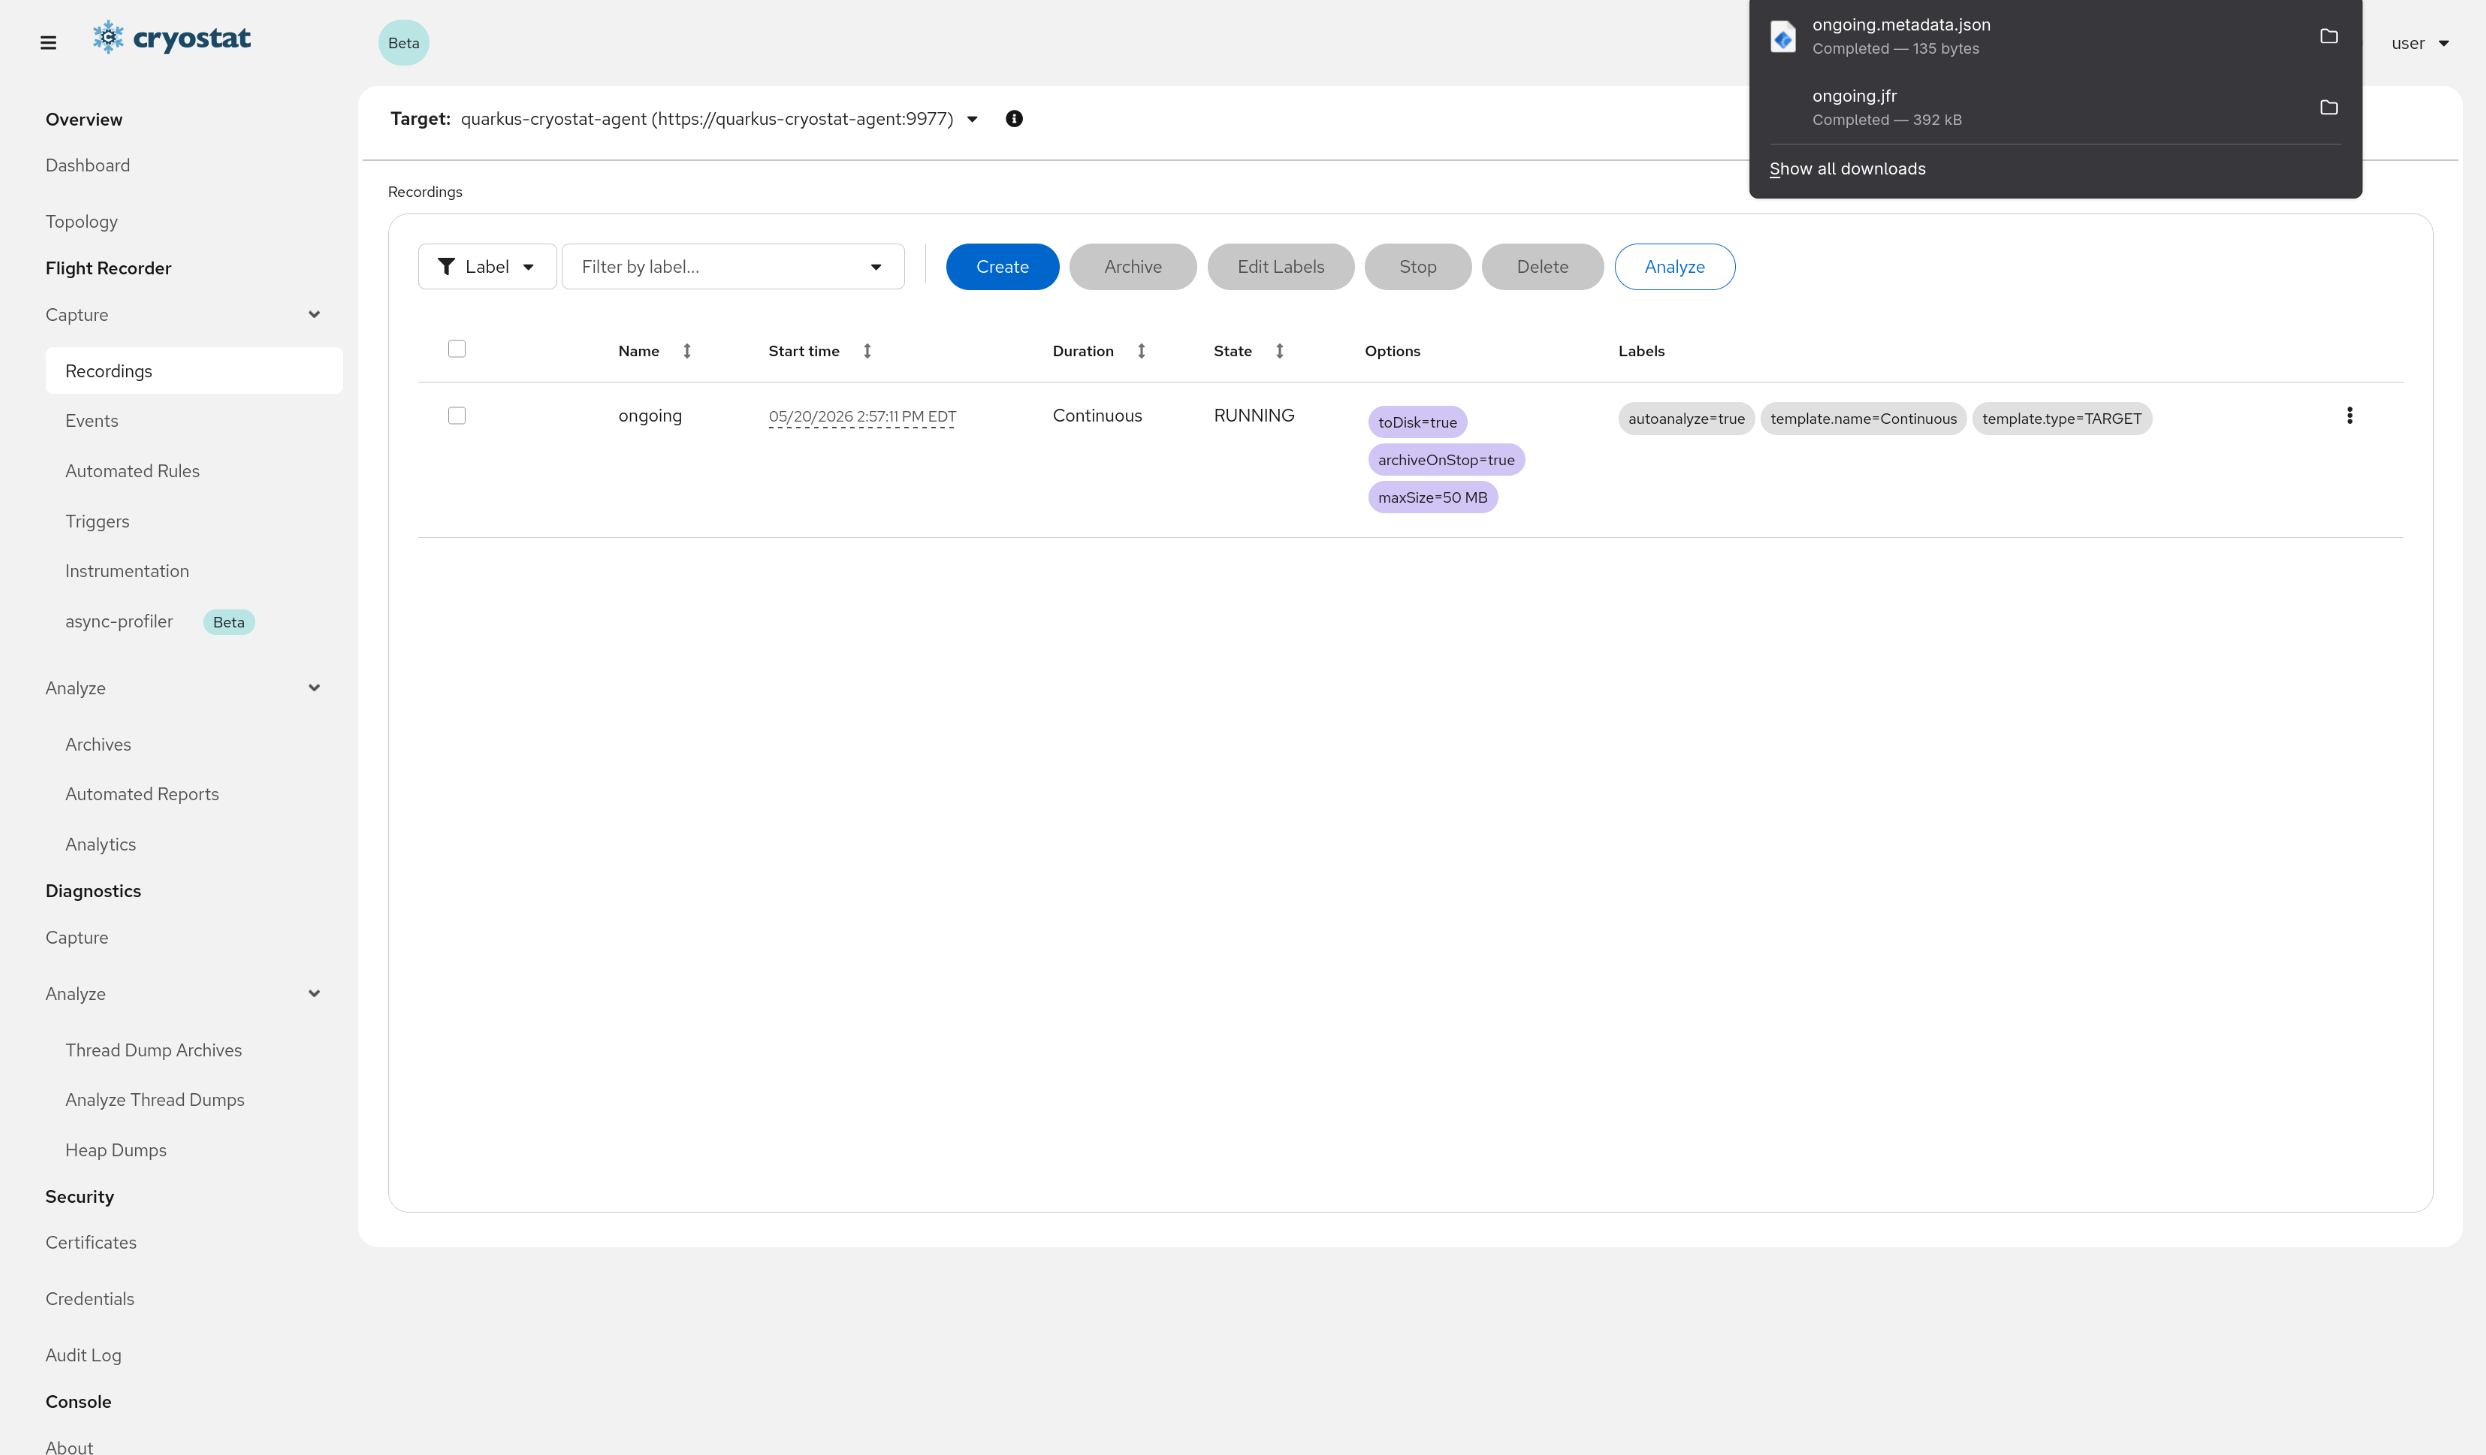
Choose what to do with the Recording File
Your browser will present you with its standard file-save dialog for both
the Archived Recording, and a .metadata.json file containing any
Metadata Labels that were attached. It may take some time for these dialogs
to appear. Once it does, you can choose to open the Recording file directly
in an analysis tool, or to save the Recording to disk for later analysis.
After downloading an Archived Recording from Cryostat, it can be re-uploaded
into Cryostat’s archives later. This is useful if, for example, your Cryostat
instance has been scaled down or undeployed for some time and the attached
storage is lost, and you then want to use Cryostat’s analysis tools with a
previously retrieved Recording in a new Cryostat instance.
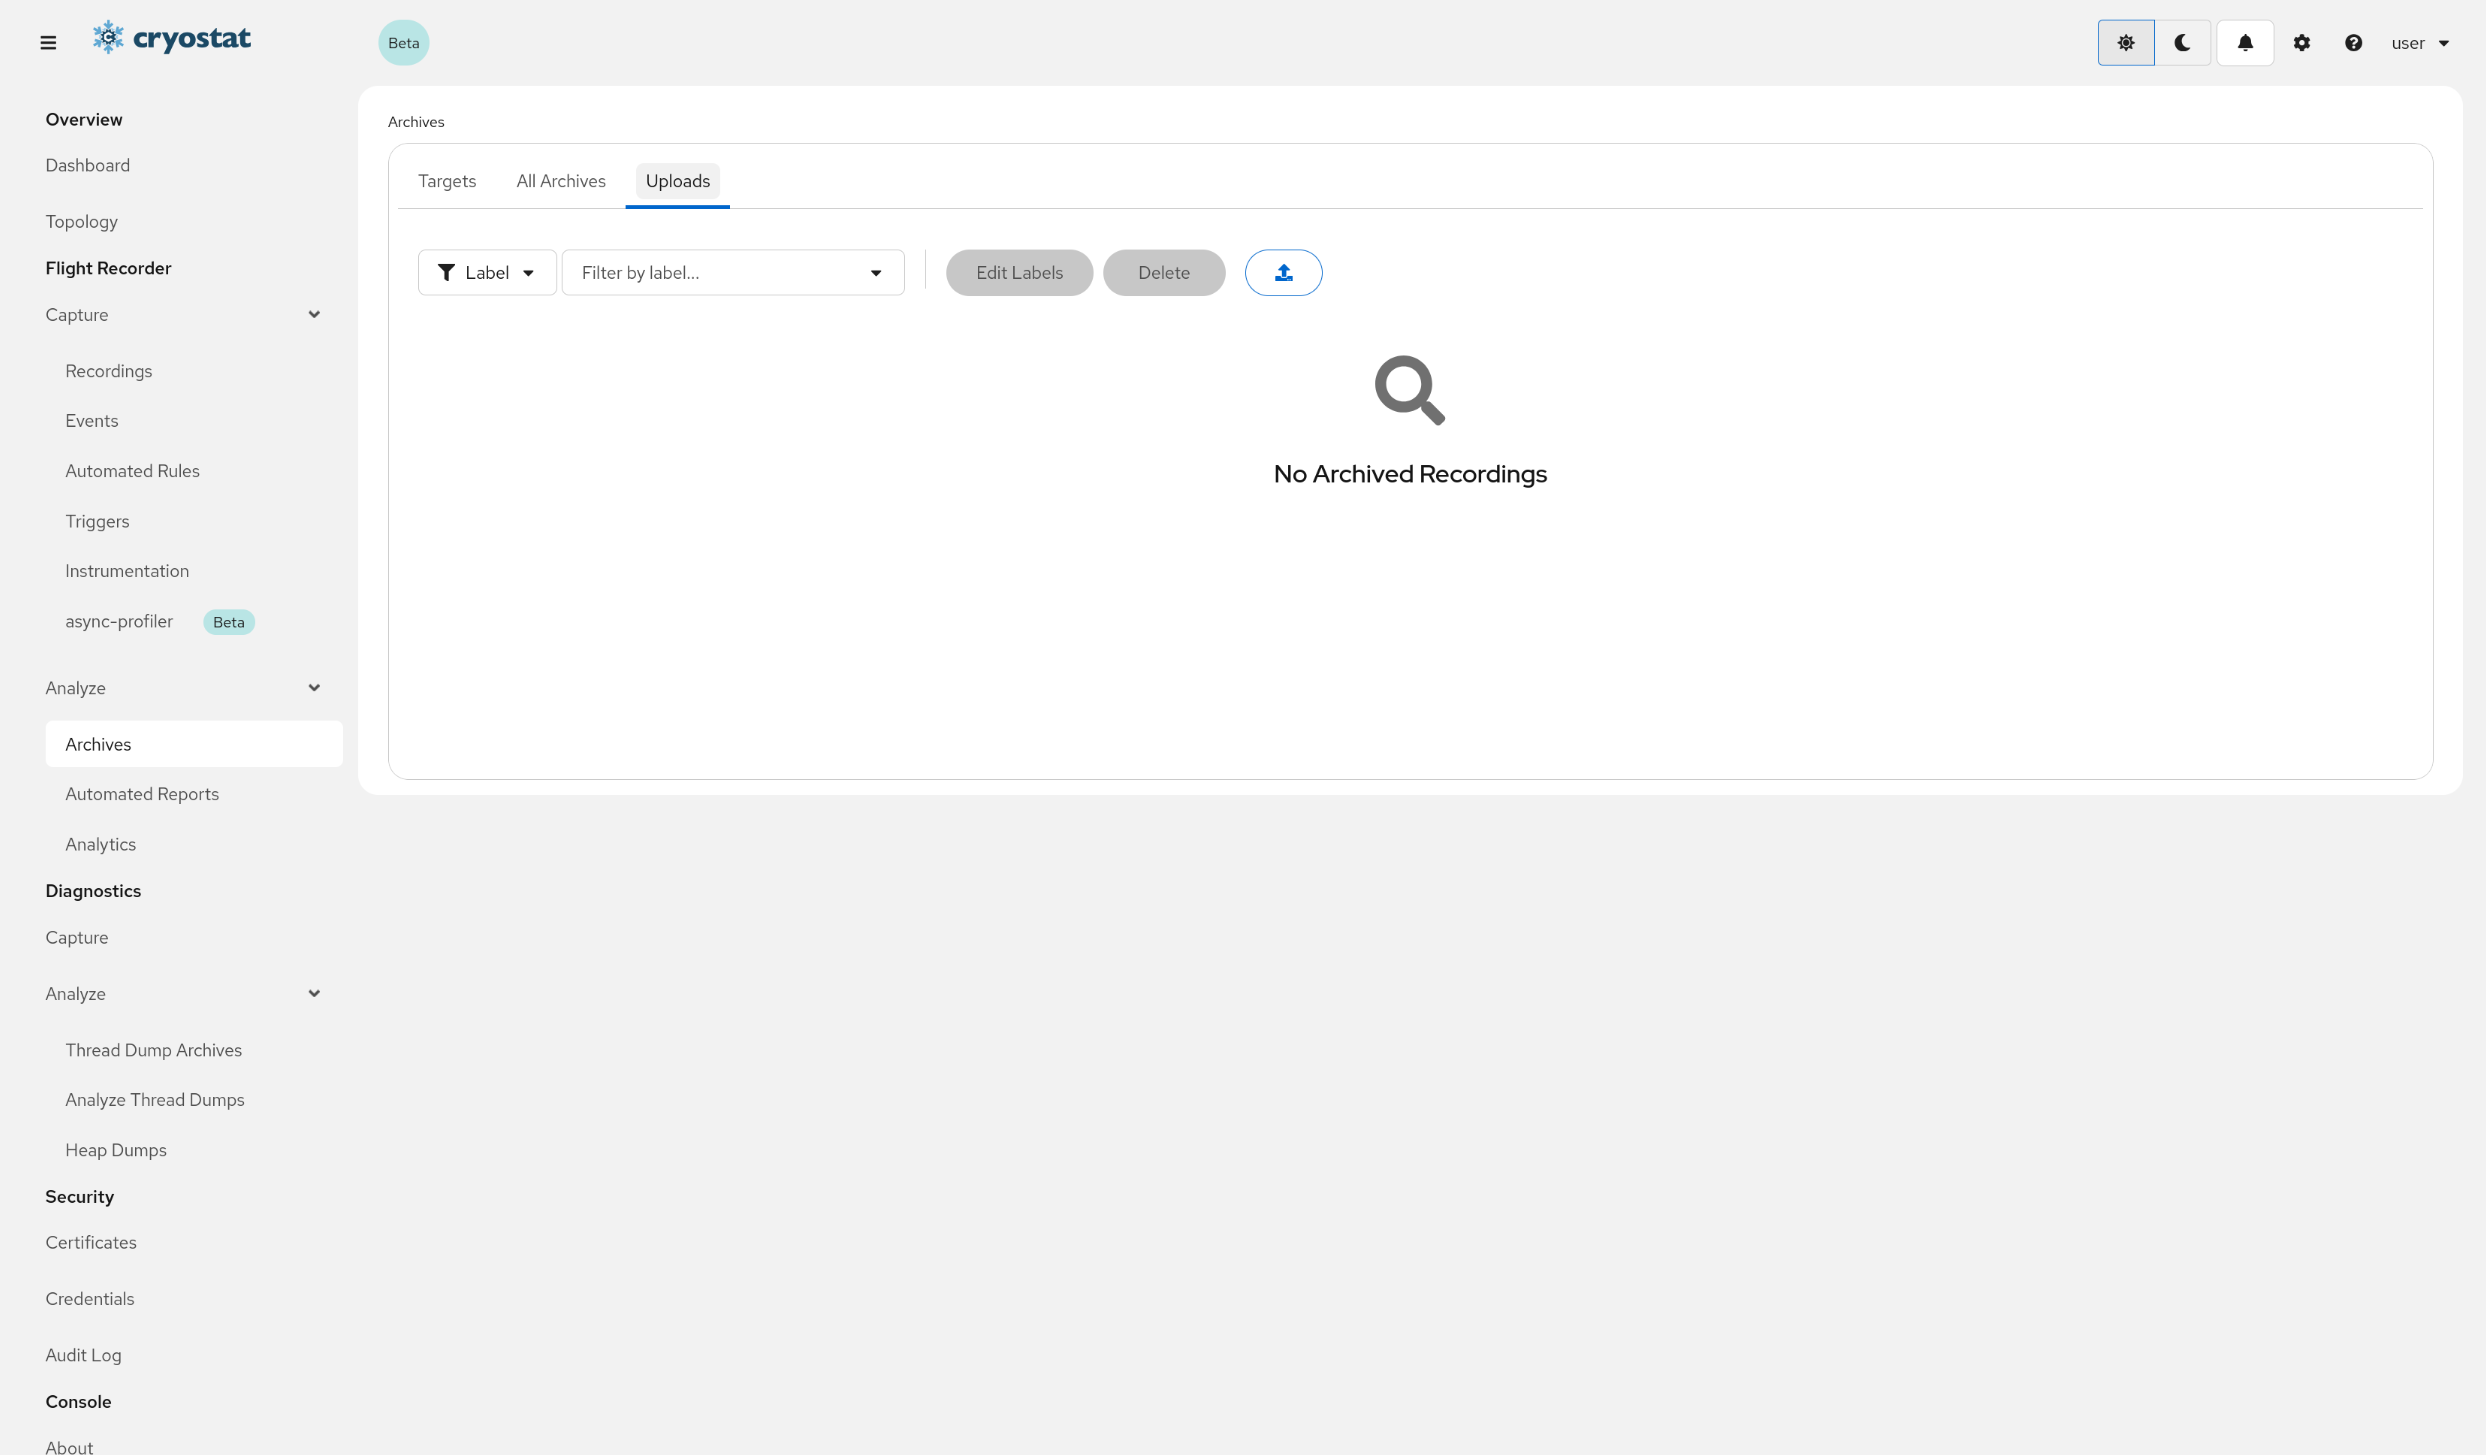
Navigate to the Flight Recorder/Analyze/Archives ViewSelect the Uploads tab.
The entire Archives view contains several tabs related to performing operations
on Archived Recordings. See Viewing Archived Recordings.
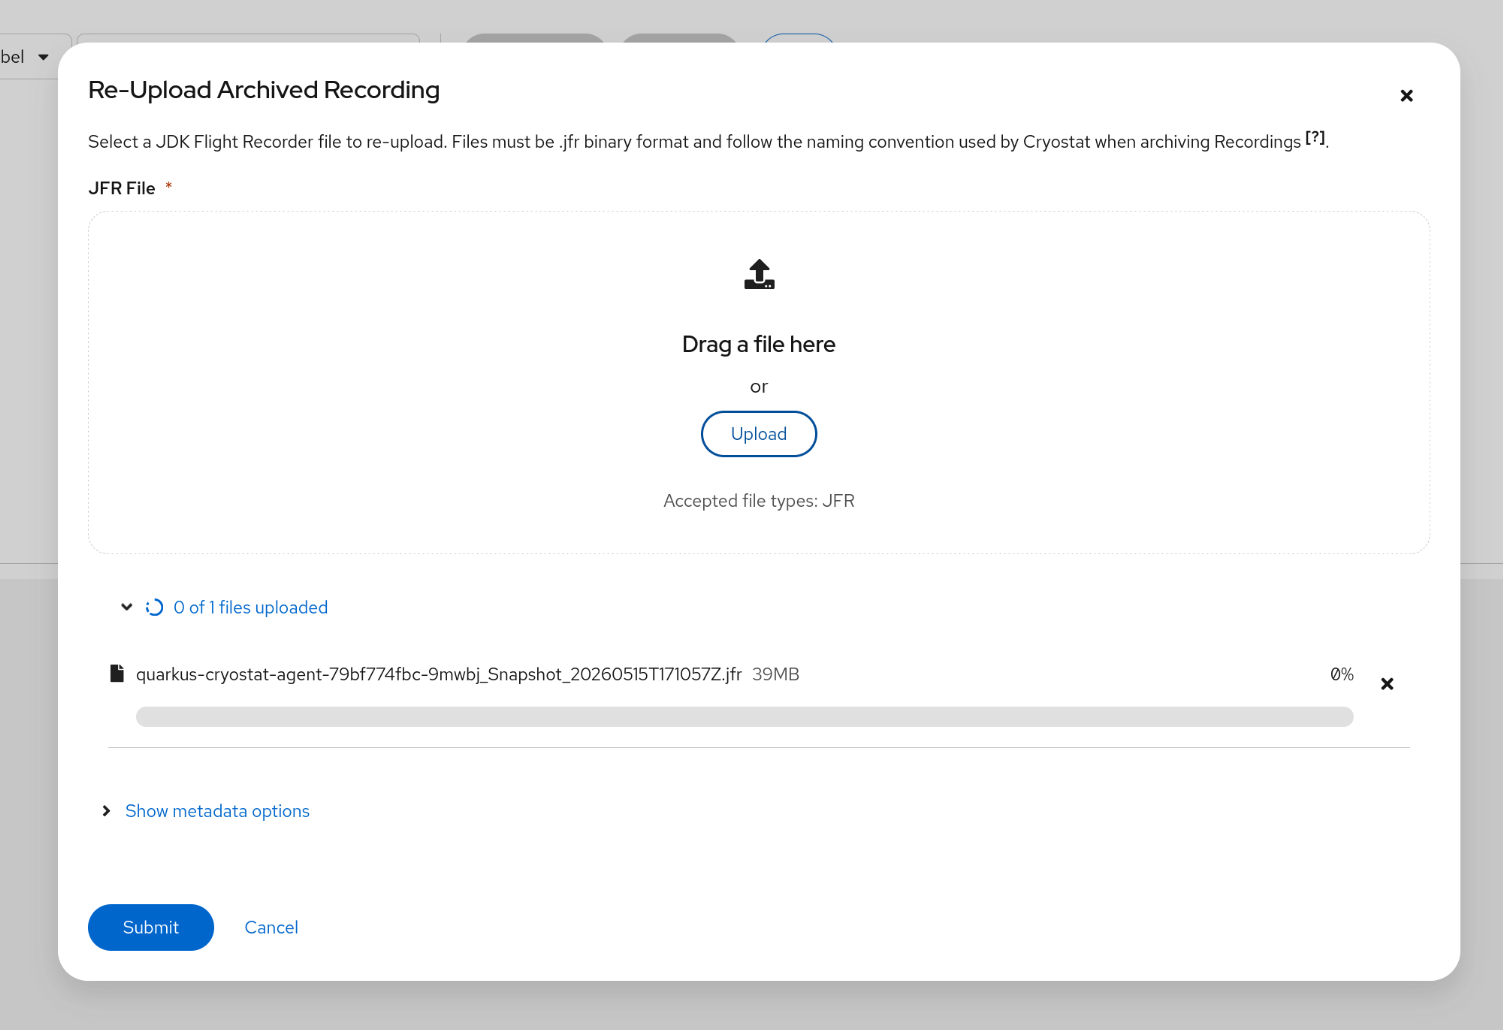
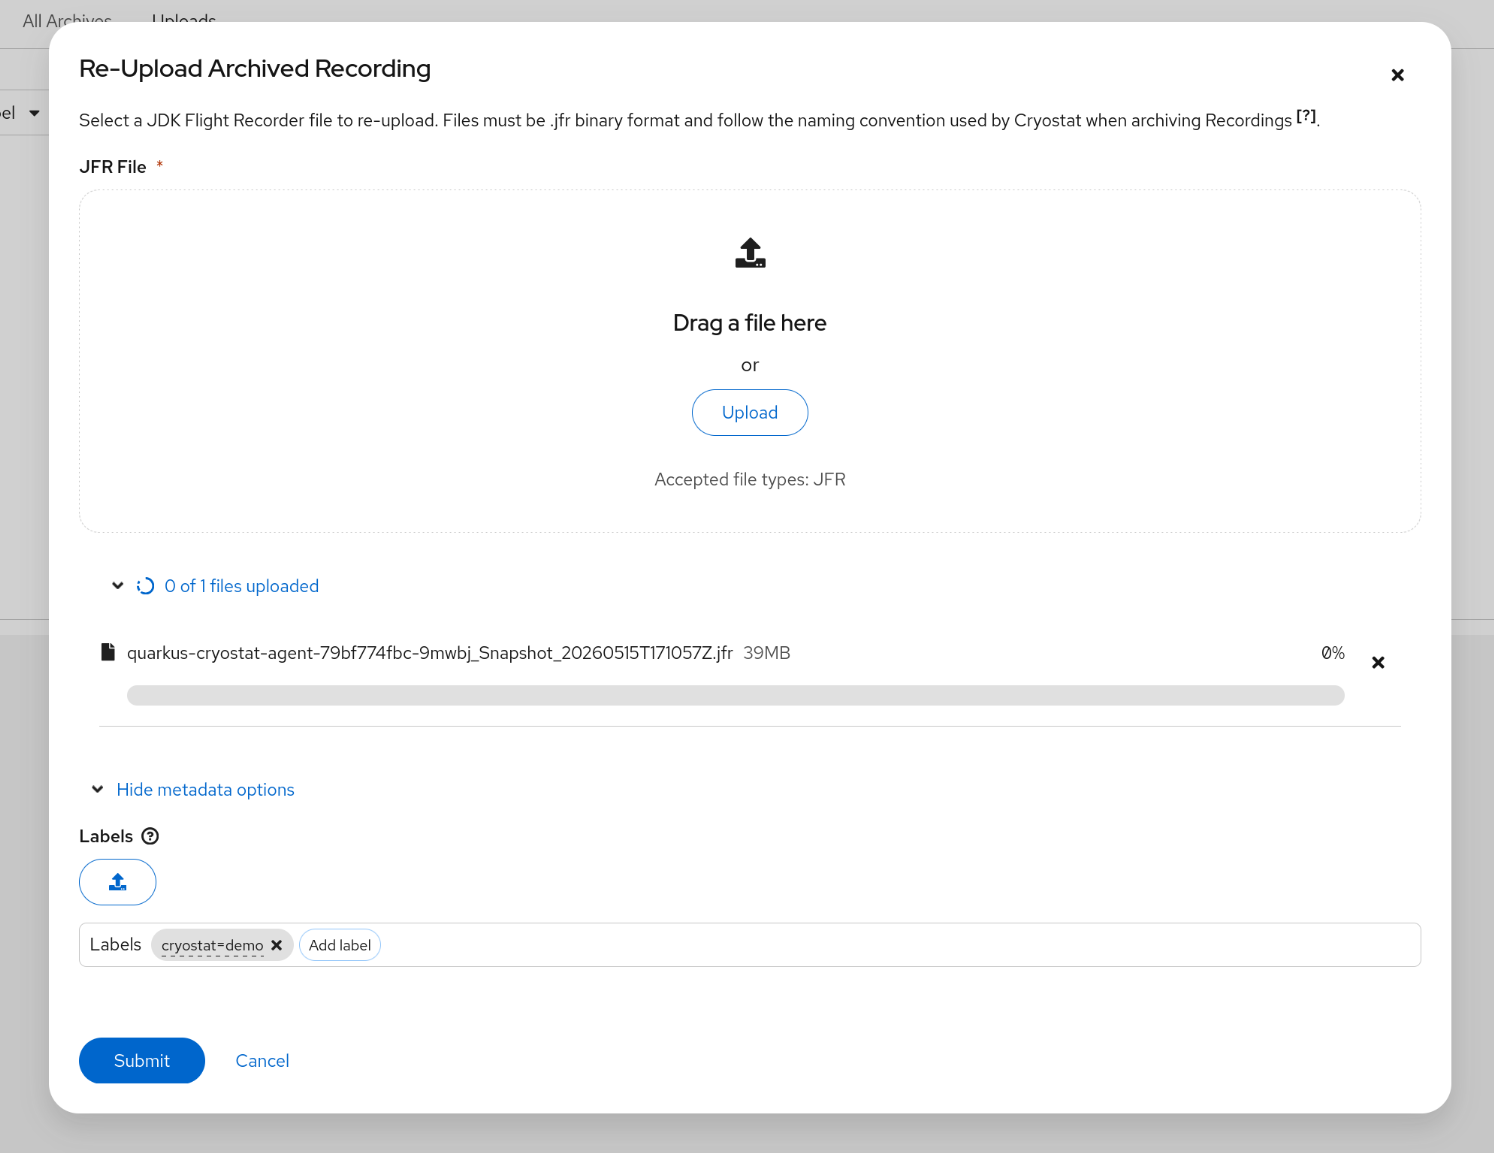
Select the Recording to Upload
Click the Upload Icon to bring up the upload prompt. Then click Upload and select the
.jfr file to upload. Note that the file must follow the CryostatArchive Recording
naming convention. Mouse over the [?] tooltip on the prompt for more information.
(Optional) Add Metadata Labels
Click Show metadata options to add optional Metadata Labels to a Recording.
You can either add Labels by clicking the Add Label button, or by uploading
a custom .jsonLabels file from your local storage. A custom Labels file
can be downloaded alongside downloading a Recording. To learn how to download a Recording
and any associated Labels, see Download an Active or Archived Recording.
and for more on CryostatMetadata Labels, see Add and Edit Recording Metadata Labels.
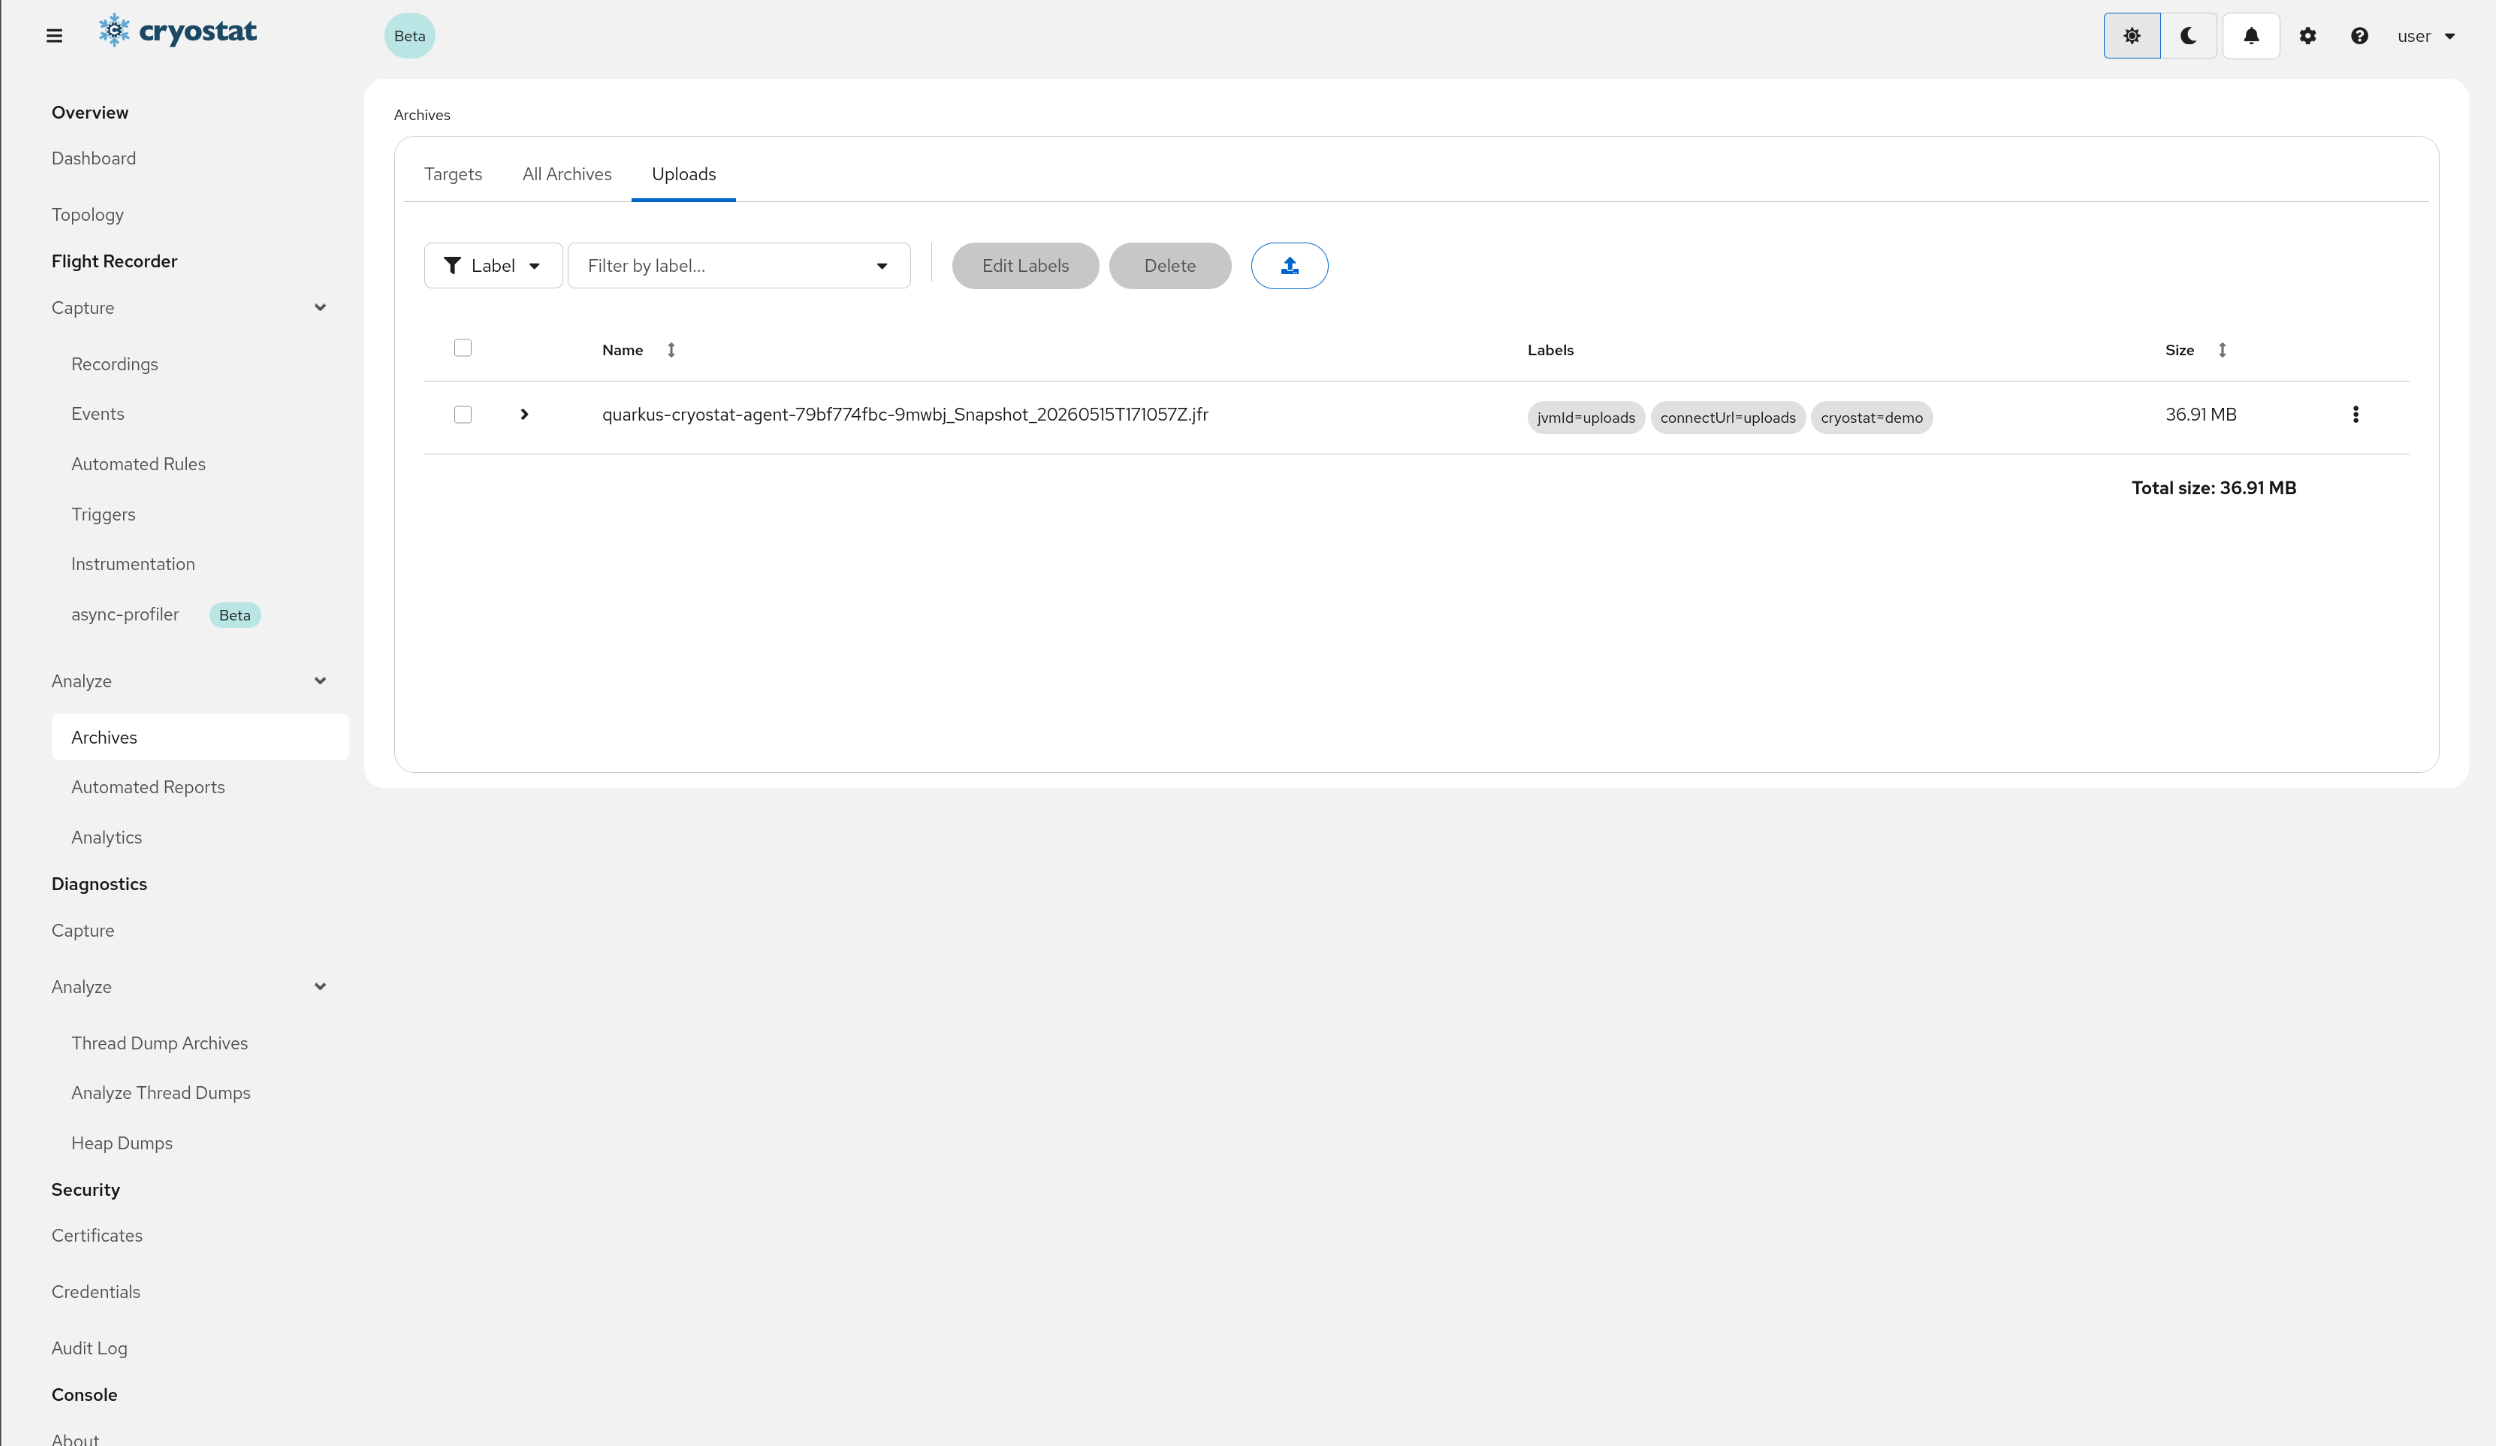
Upload the RecordingClick Upload and observe that the Recording is now present in
the Uploads tab of the Archives view.
The JVM comes with many built-in JDK Flight RecorderEvent Types out-of-the-box.
You can also register new event types at the framework- or application-level using the
jdk.jfr API. Cryostat can list out all of a TargetJVM’s registered event types
so you can see what kind of data may be captured by Flight Recordings.
Select the Target ApplicationClik the Dropdown arrow on the right side of Target prompt to select or create a target.
If you wish to create a Custom Target from here, click Create Target displayed at the bottom. Go to Create a Custom Target and proceed from step 3.
Also, see Using the Cryostat Agent section to help discover other targets.
The Target selected will provide the base Continuous and
Profiling template definitions to start from. Most target
applications will be interchangeable here.
Navigate to Flight Recorder/Capture/Events
Supply JMX credentials to authenticate to the target, if necessary. If
the target is not configured with JMX authentication then the
connection attempt will continue without prompting for credentials.
If the TargetJVM has SSL/TLS enabled on JMX connections then it may be
necessary to add the Target's certificate to Cryostat's trust store. Go
to Add a Trusted Certificate
and return to this section after completing that guide.
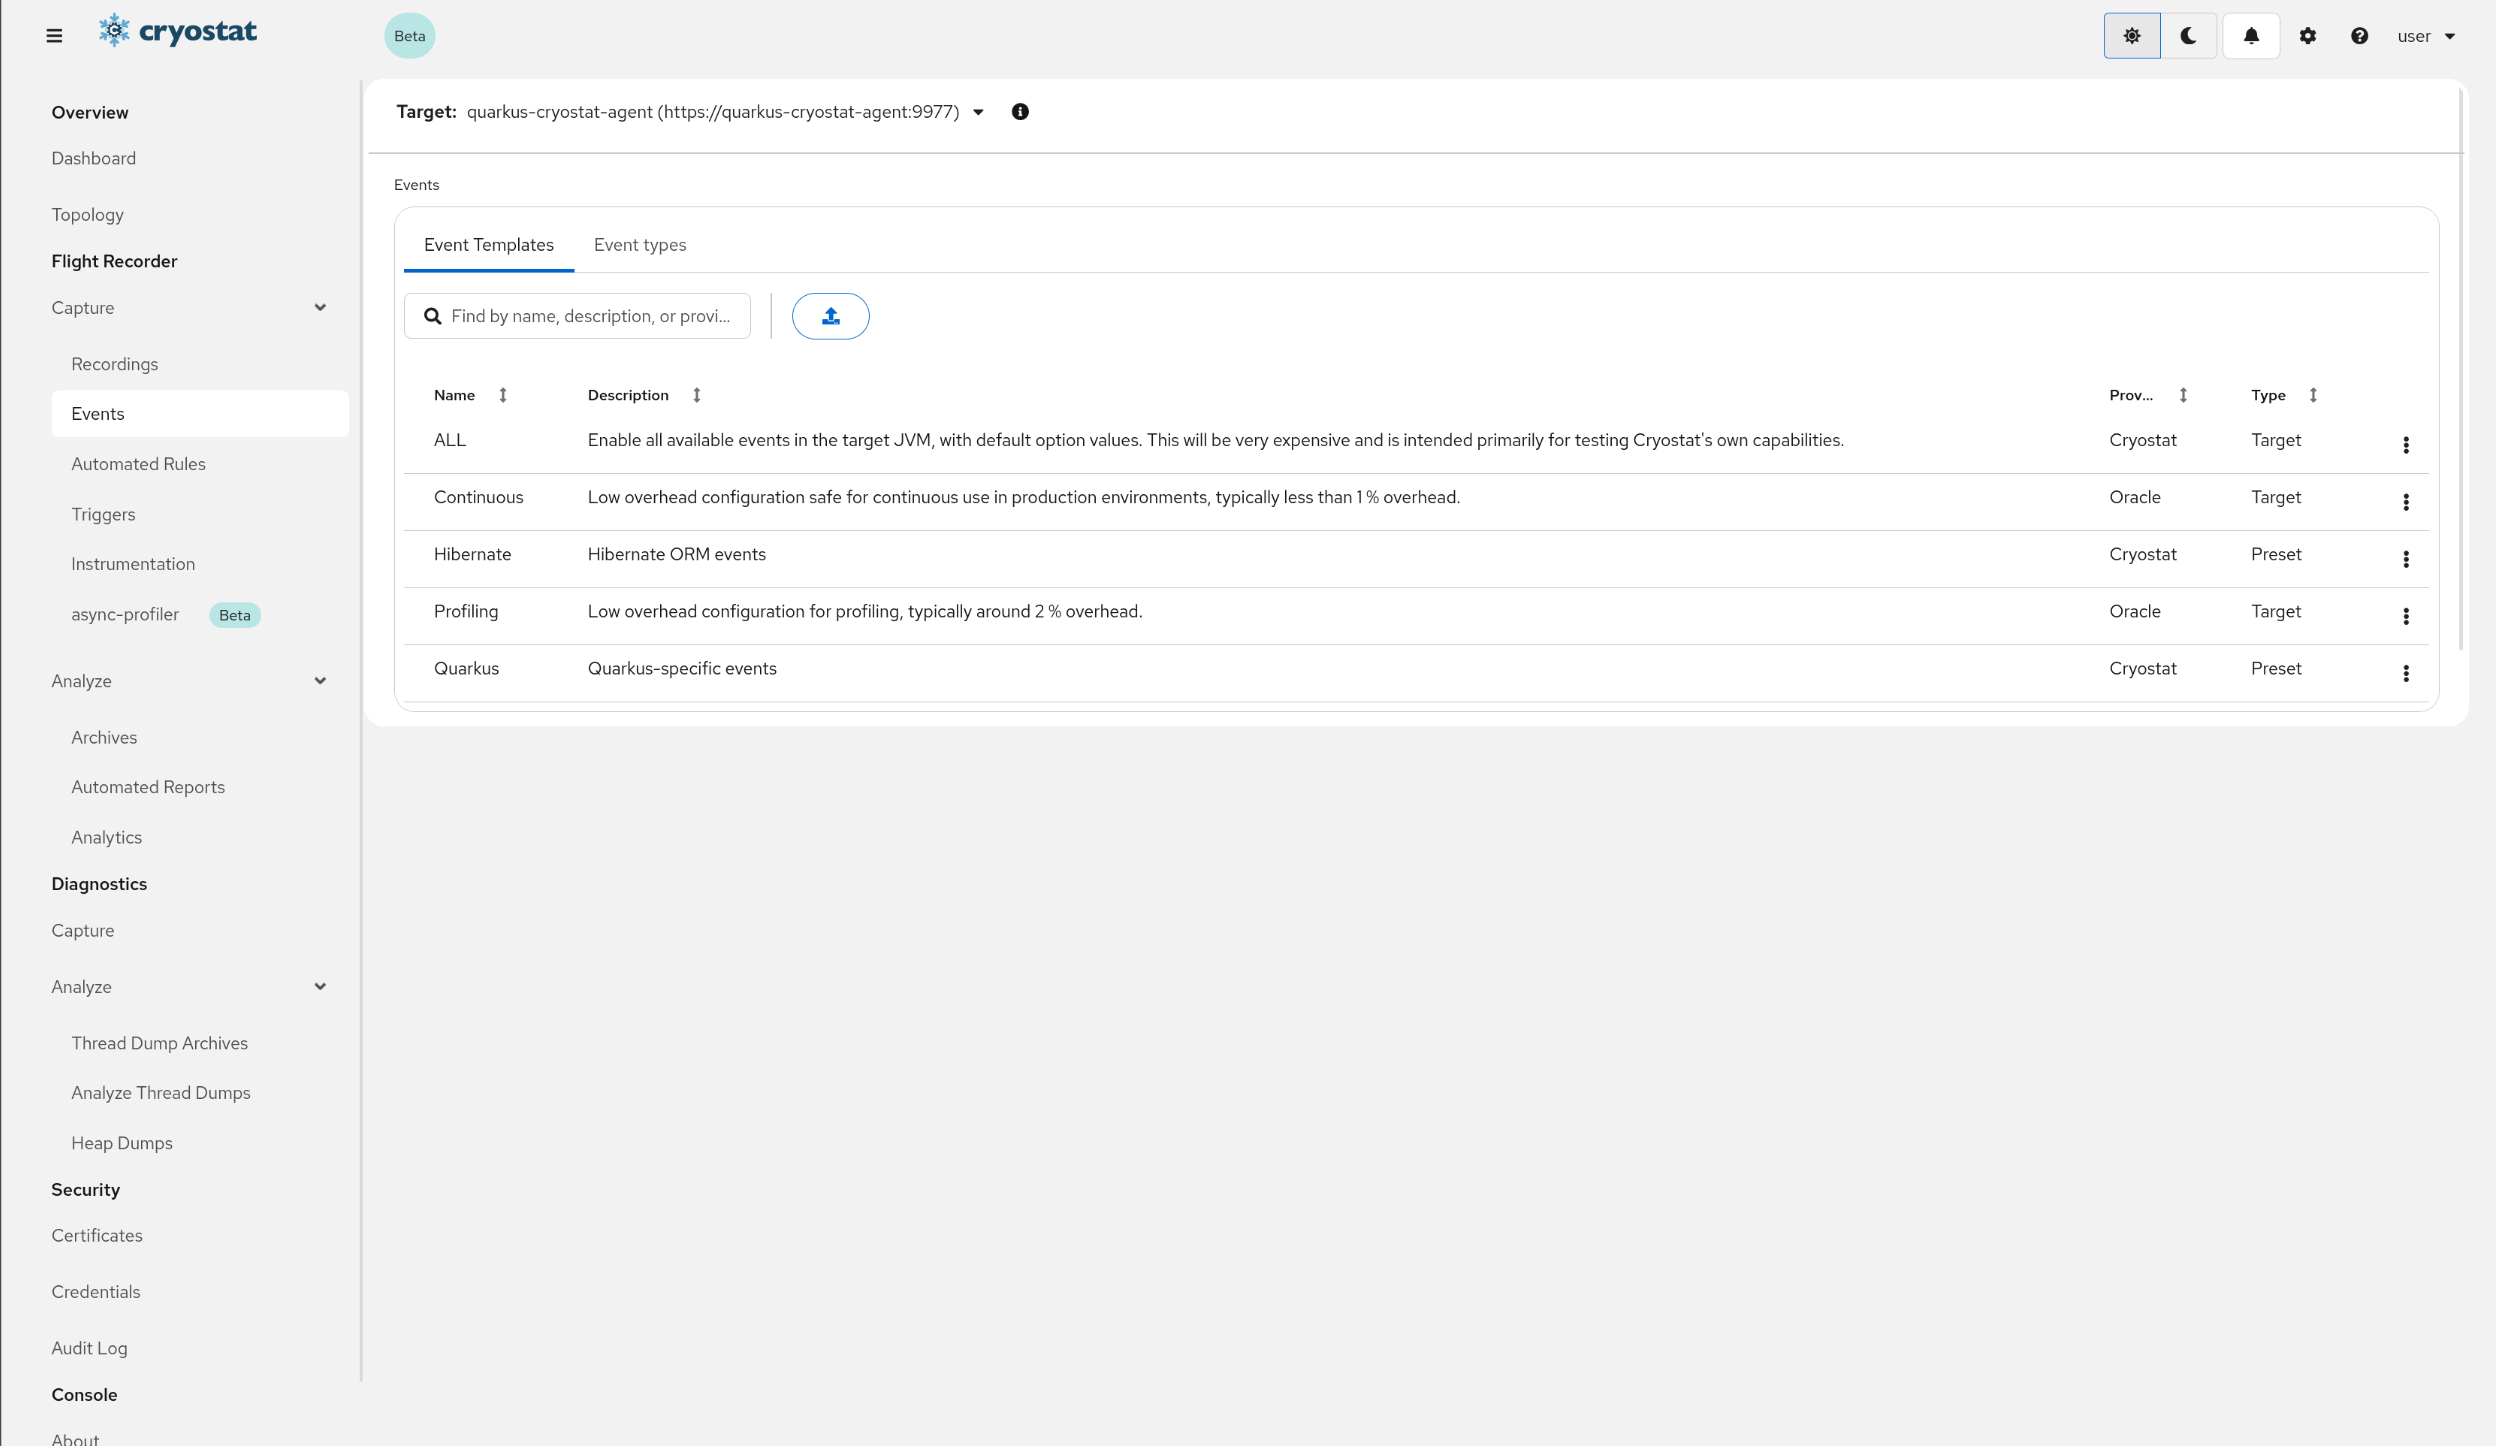
Navigate to Event Types
Select the Event Types tab to view a table listing of all the JDK Flight RecorderEvent Types registered in the Target JVM.
Most JVMs will come with at least two JFREvent Templates definitions included:
the Continuous and Profiling templates.
The Continuous template:
has very low runtime overhead
collects basic data
is intended to be left on at all times, even in production
The Profiling template:
may have some detectable runtime overhead
collects more in-depth data
should be used for a fixed duration when a specific problem is discovered at runtime
These two definitions will fit many monitoring and profiling workflows, but not
all. It may be useful to use either of these as a starting point and tailor it
to meet your specific monitoring/profiling needs by including/excluding events,
increasing/decreasing sample rates, raising/lowering thresholds, etc.
Of special note, JFR allows for the definition of application-specific or
framework-level custom events, which would not be captured in either of the default
templates above. You can view all of the JFREvent Types
for a Target application.
Cryostat also provides the ALL meta-template, which enables all
event types in the selected target application, with default values for each
event option. This is not a true Event Template and does not have an XML
definition to download.
Finally, Cryostat also includes some Preset Event Templates. These behave like
Custom Event Templates in that the event definition is stored by Cryostat, rather
than the target application, but are handled separately can cannot be deleted
like Custom Event Templates. Preset Event Templates can only be added to a Cryostat
instance by adding files to a specific configuration directory and restarting Cryostat.
The steps below assume that you have at least one Target discovered. If you select
a discovered Target then you can use its templates as starting points for your
customizations. If you do not first select a Target then you may still upload and
delete Custom Event Templates.
Select the Target ApplicationClik the Dropdown arrow on the right side of Target prompt to select or create a target.
If you wish to create a Custom Target from here, click Create Target displayed at the bottom. Go to Create a Custom Target and proceed from step 3.
Also, see Using the Cryostat Agent section to help discover other targets.
The Target selected will provide the base Continuous and
Profiling template definitions to start from. Most target
applications will be interchangeable here.
Navigate to Flight Recorder/Capture/Events
Supply JMX credentials to authenticate to the target, if necessary. If
the target is not configured with JMX authentication then the
connection attempt will continue without prompting for credentials.
If the TargetJVM has SSL/TLS enabled on JMX connections then it may be
necessary to add the Target's certificate to Cryostat's trust store. Go
to Add a Trusted Certificate
and return to this section after completing that guide.
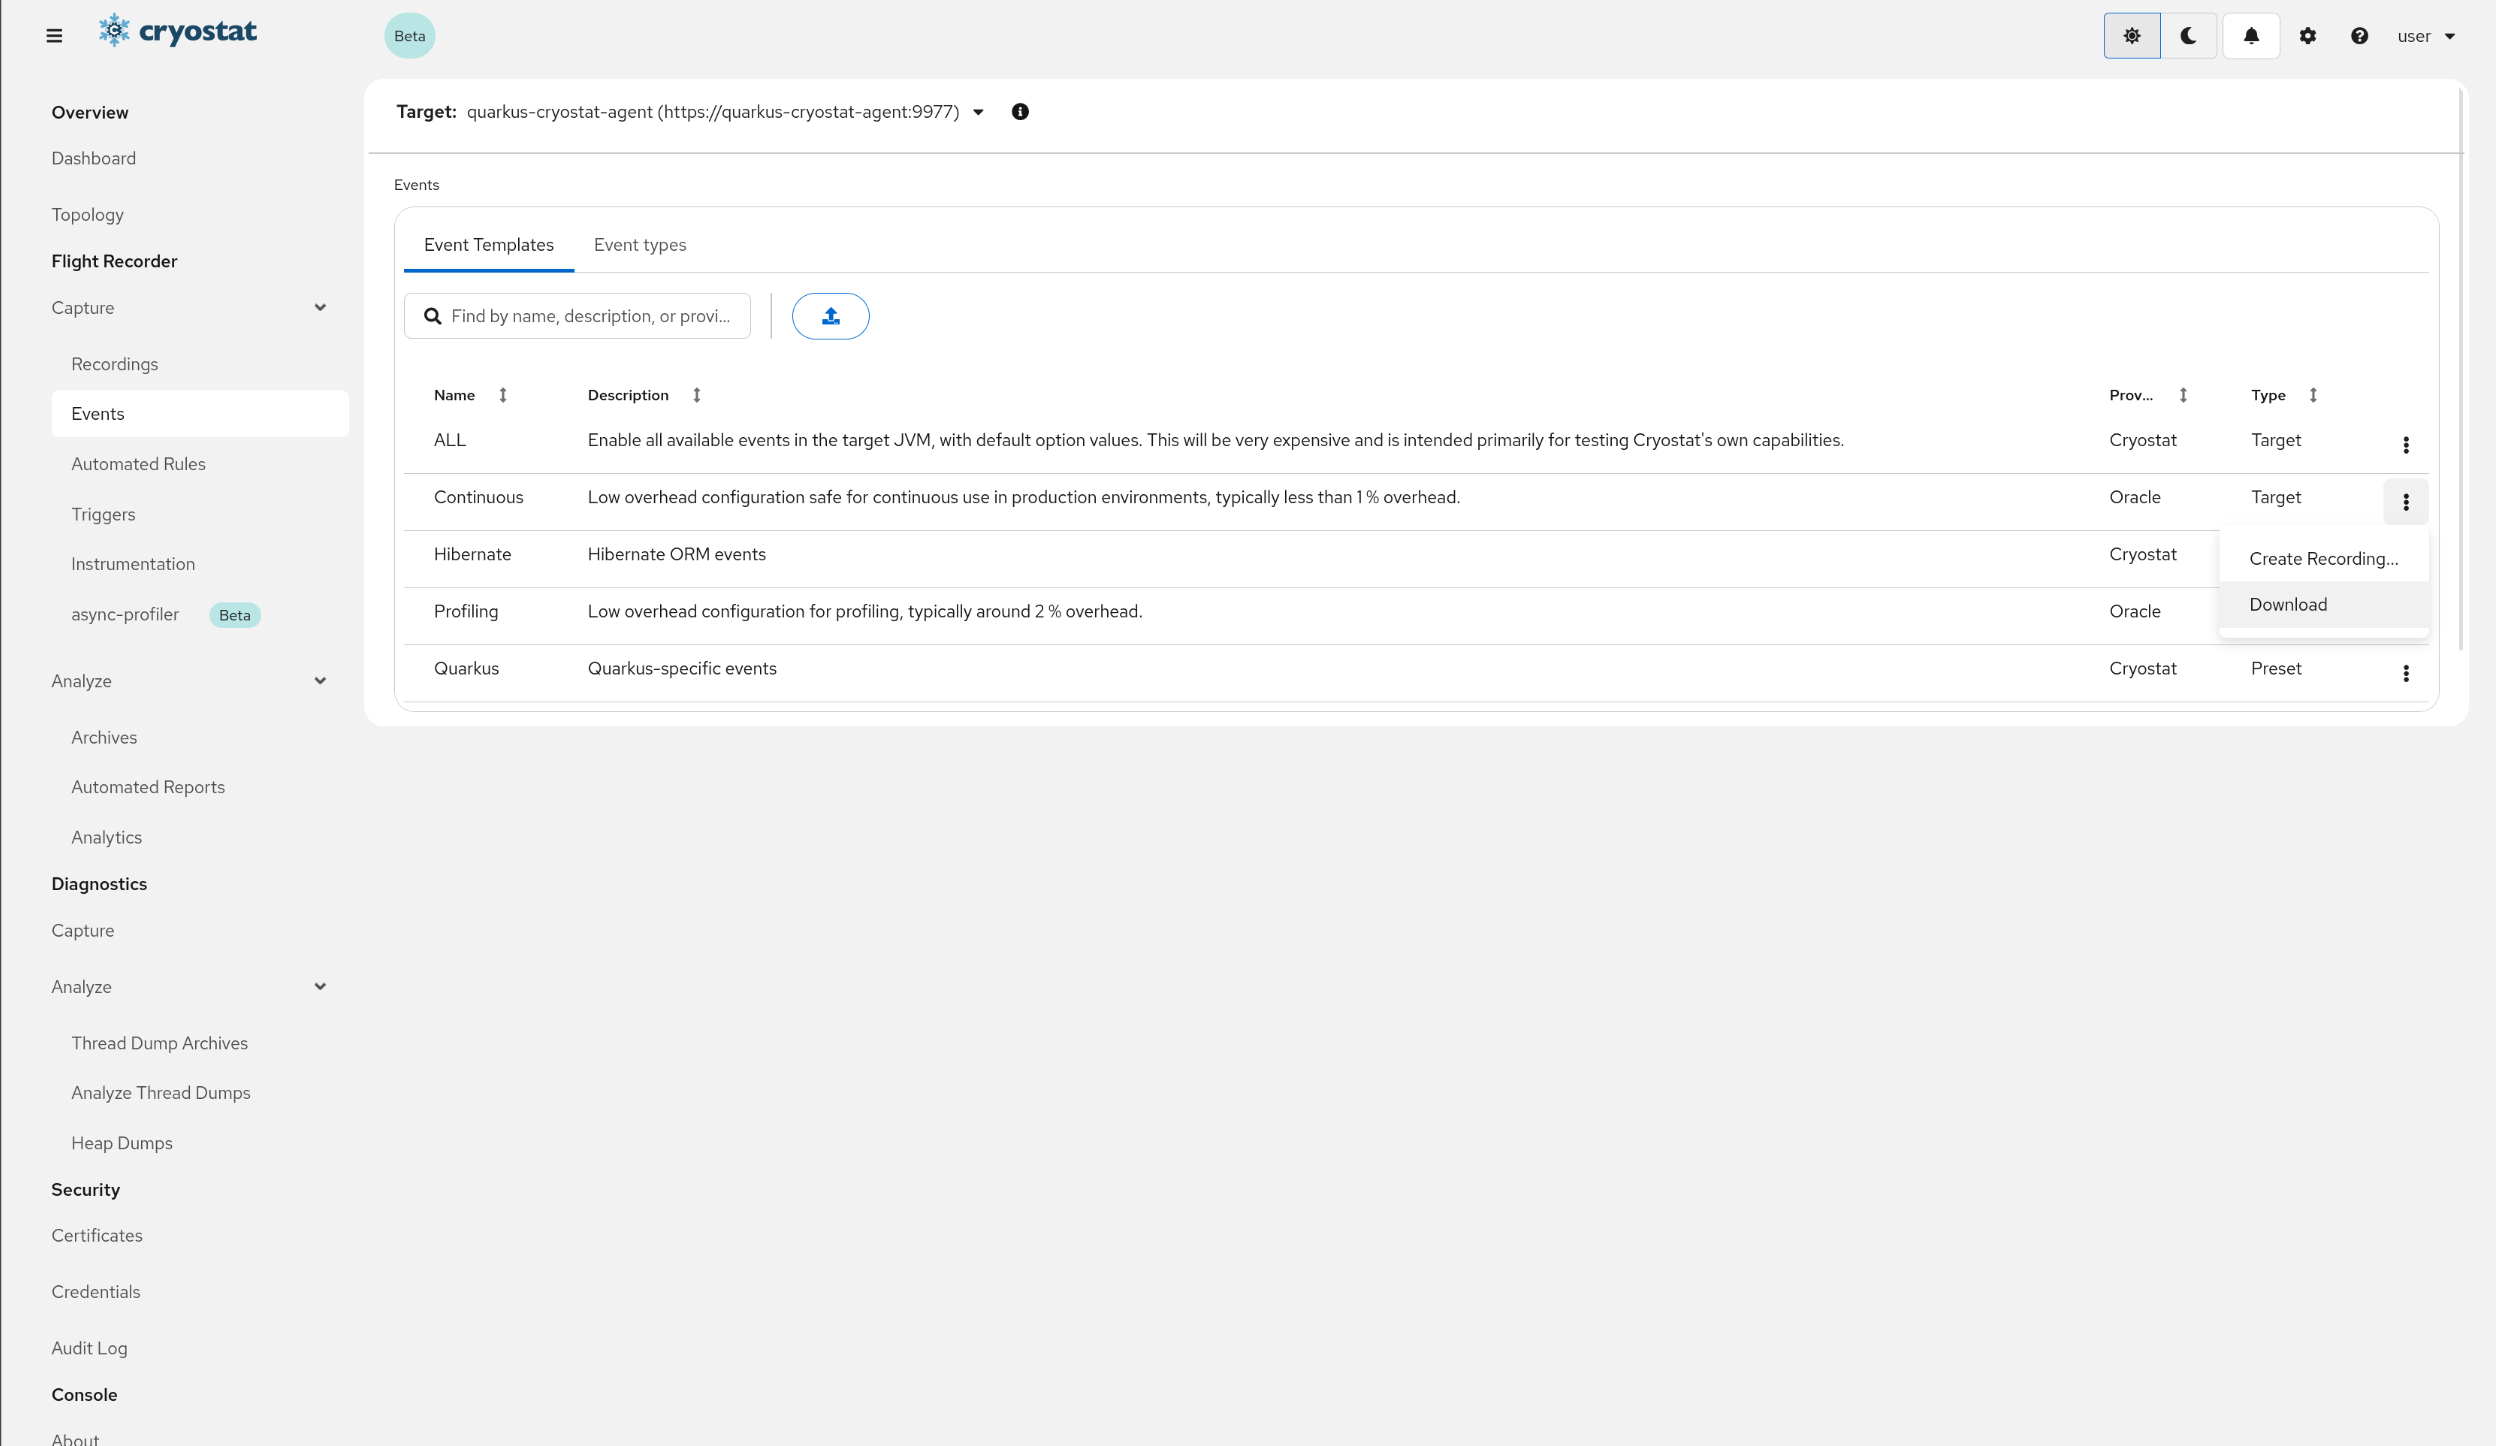
Download the Template
Click the action overflow "︙" three-dot menu on the right side of the
template entry in the table, then click Download. Rename this file to custom-template.xml.
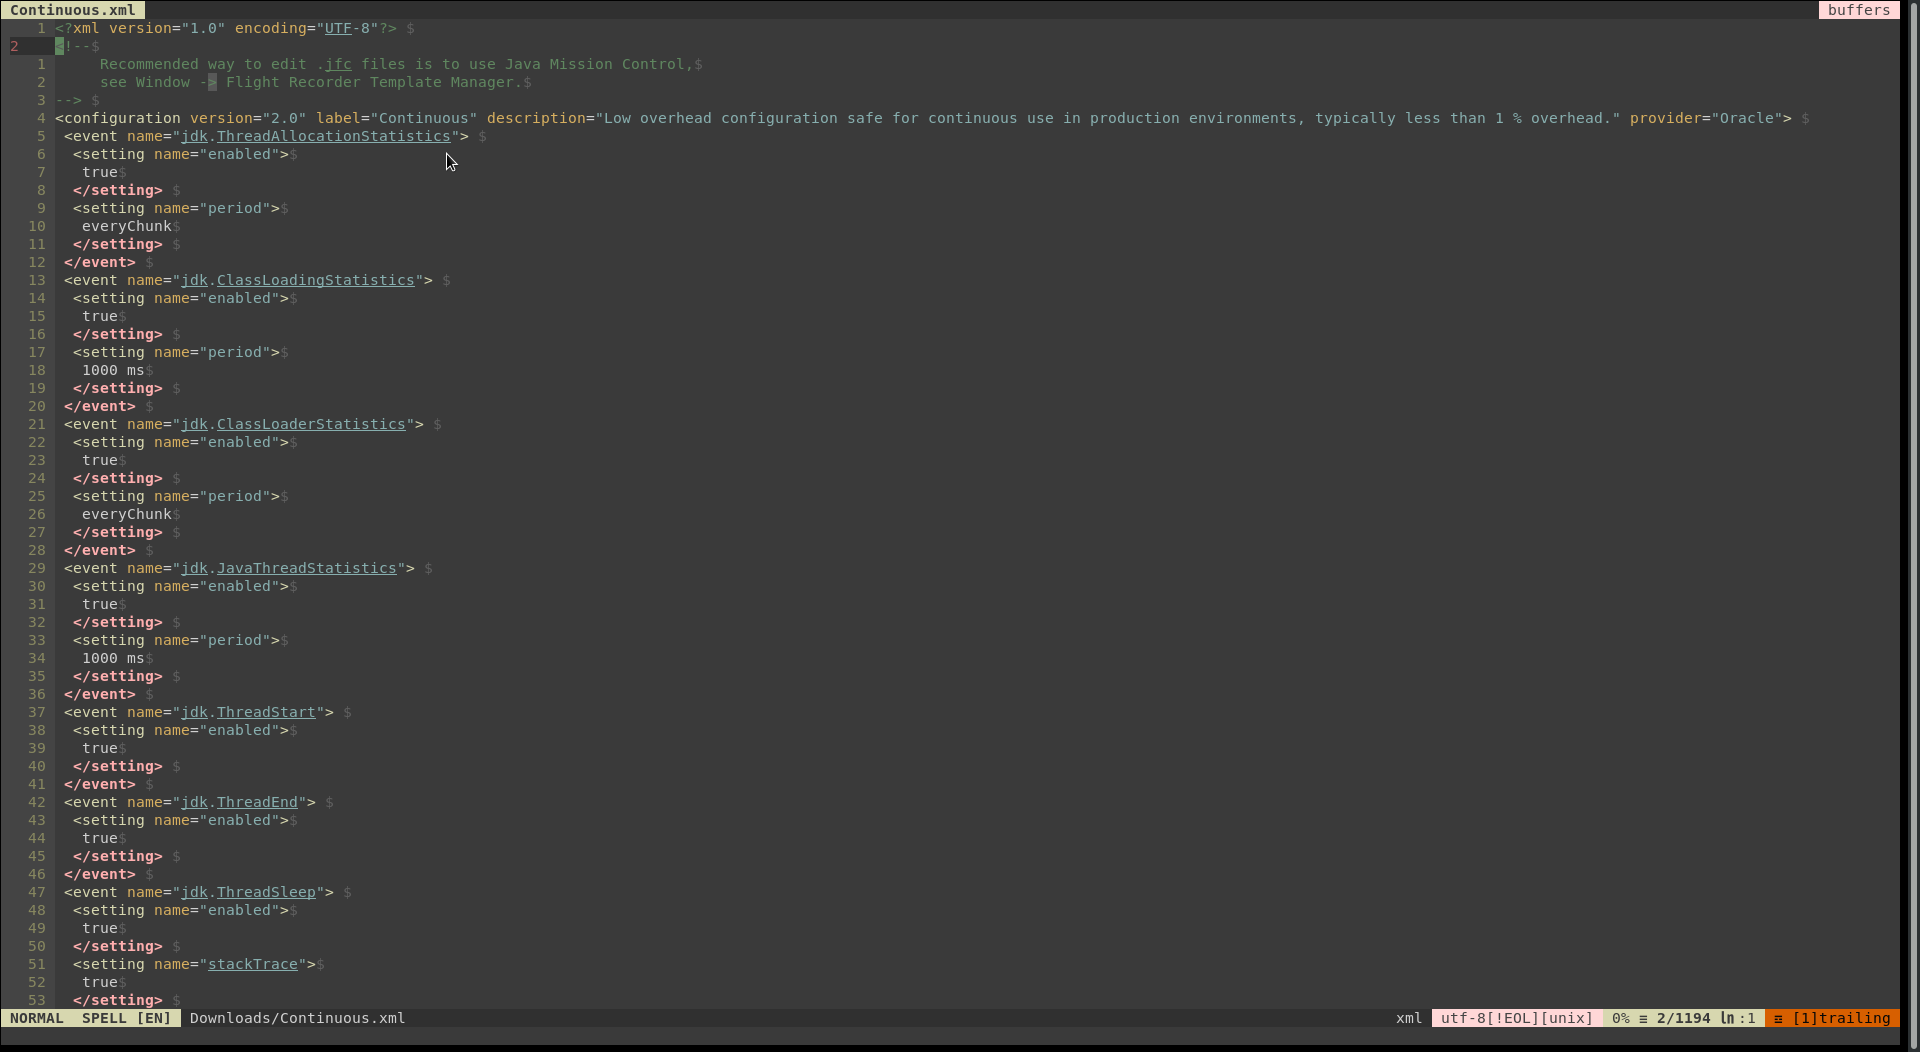
Edit the Template
The Template definition is an XML file, so you may open and edit it
with your favourite text editor or XML document editor. The JMC
Template Manager can also be used for this purpose, as described in
Edit Template With JMC
.
Edit the Template definition to suit your requirements. When you are
satisfied with the new configuration, give your new Template a
meaningful and recognizable tag by editing the
<configuration> element at the top of the file and
setting the label= attribute to the desired name. You
should also save the file according to this new name, but this is not
strictly necessary. The description and
provider attributes can also be used to help identify this
Template later and to explain its goals and purpose.
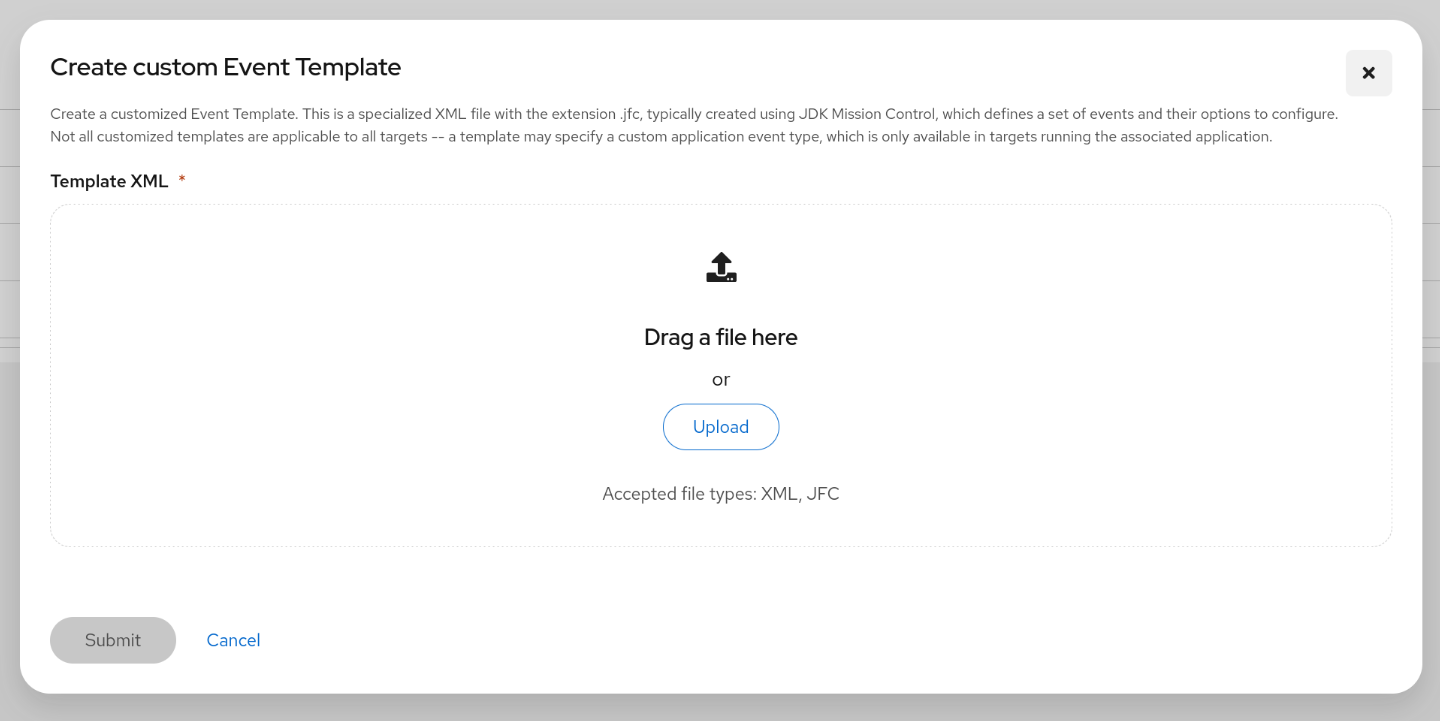
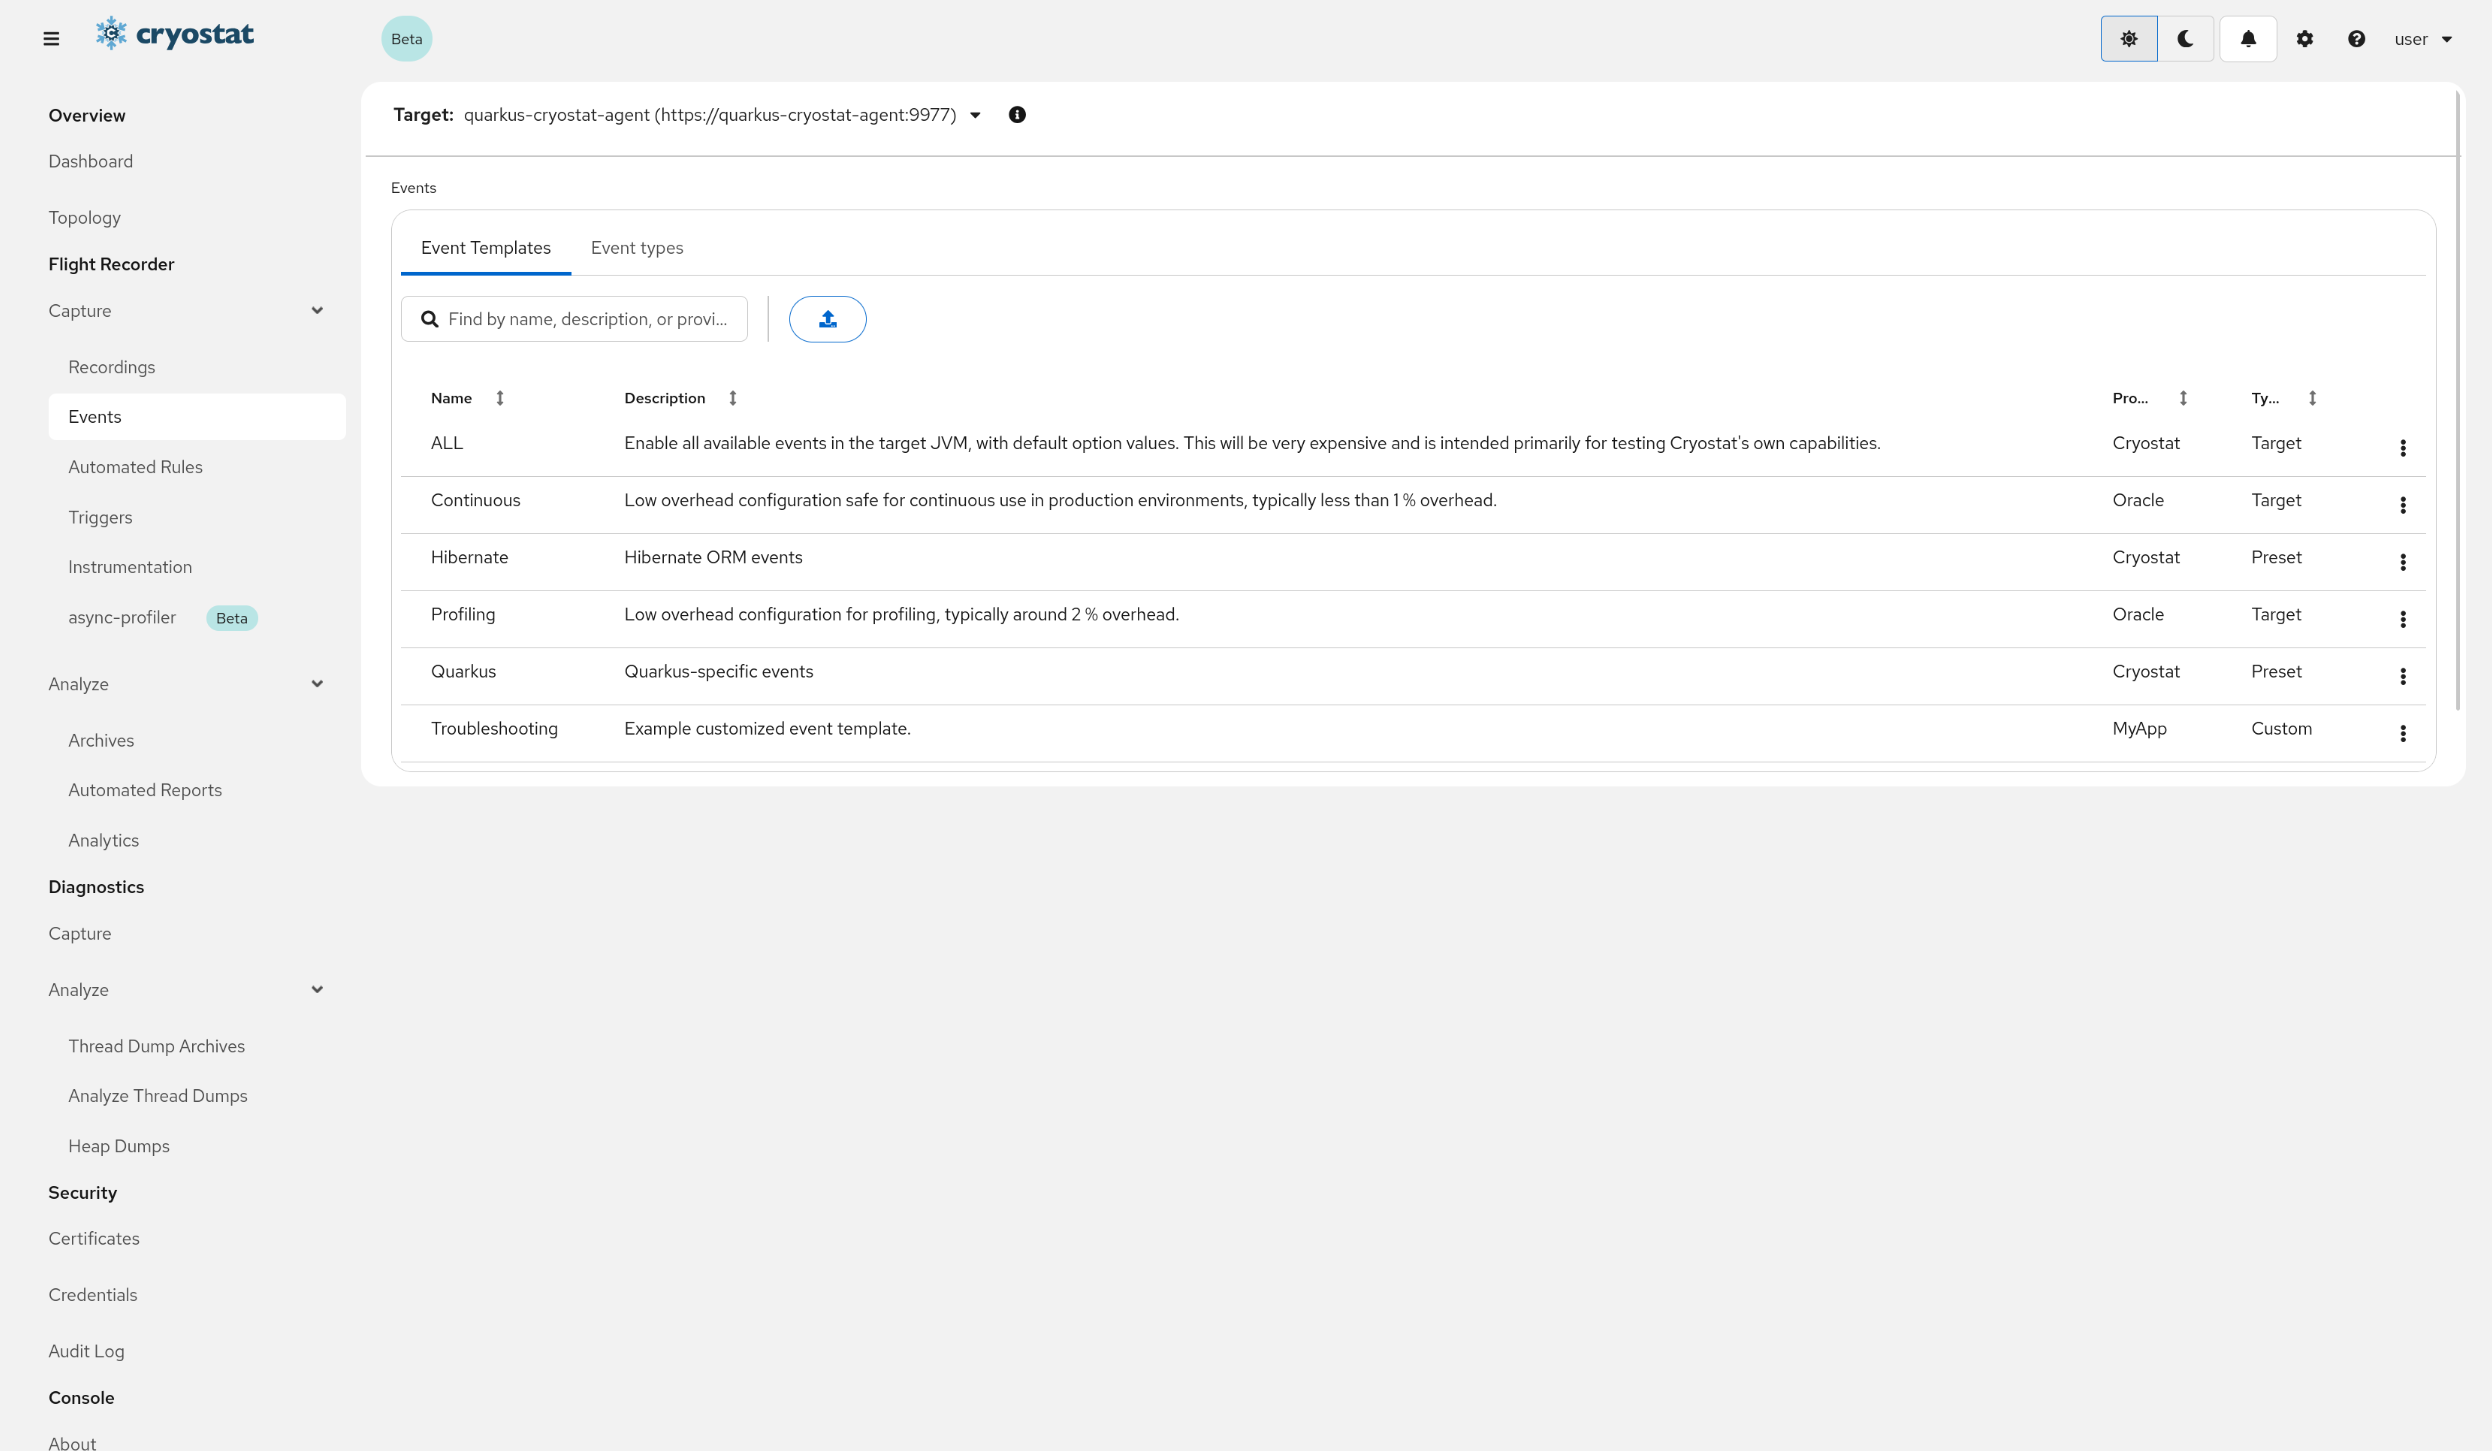
Open the Template Upload Dialog
Back on the Events Templates tab, click the Upload Icon
in the toolbar. A dialog will appear.
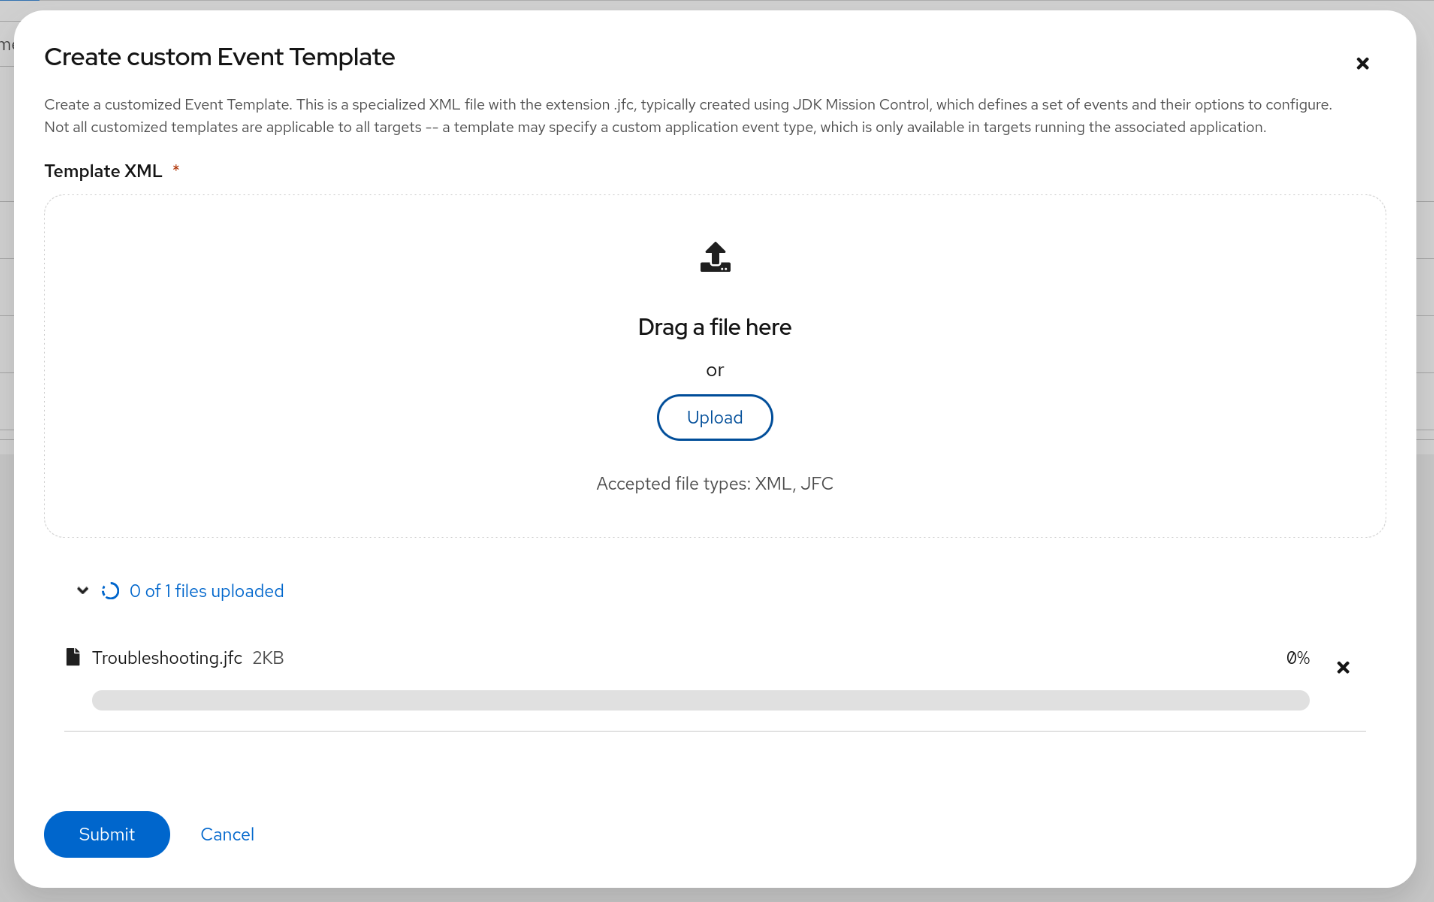
Upload the Template
Click the Browse button. Your browser will present its
native file chooser dialog to select the file to upload. Browse and
select the Template file, then click
OK/Select/Continue/Open. Click Submit on the
Cryostat dialog.
Observe the new Template
Once the Template has been uploaded you will be returned to the
Events View, and your template will be present in the
table.
Now that this configMap has been created, when creating the Cryostat Custom Resource we can specify it, either through the Red Hat Openshift console under Event Templates while creating the Cryostat Custom Resource, or through the Custom Resource YAML:
Once the Custom Resource has been created, the event template will be pre-loaded into Cryostat and be available from startup without any further configuration needed.
JDK Mission Control has a Template Manager
functionality which also contains a graphical wizard for editing .jfcEvent
Template files. This may be preferred to editing the templates directly as XML
plaintext or using XML document editors, which do not have .jfc-specific XSD
validation or any hinting for event types and options.
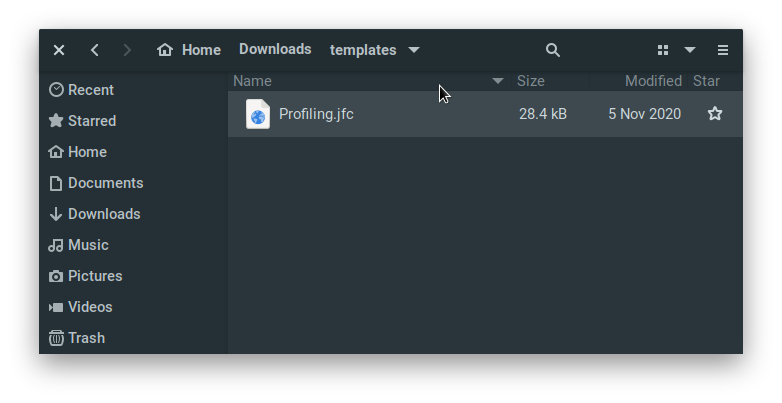
Acquire an Event Template
Ensure that you have an event template definition.jfc file
somewhere on your local workstation, with read/write permissions.
If you do not have an event template definition then you can visit
Download, Edit, and Upload a Customized Event Template
and follow the first few steps to retrieve one from a remote target
application accessible by Cryostat. Otherwise, if you have the JDK
installed locally, you can find templates at
$JAVA_HOME/lib/jfr.
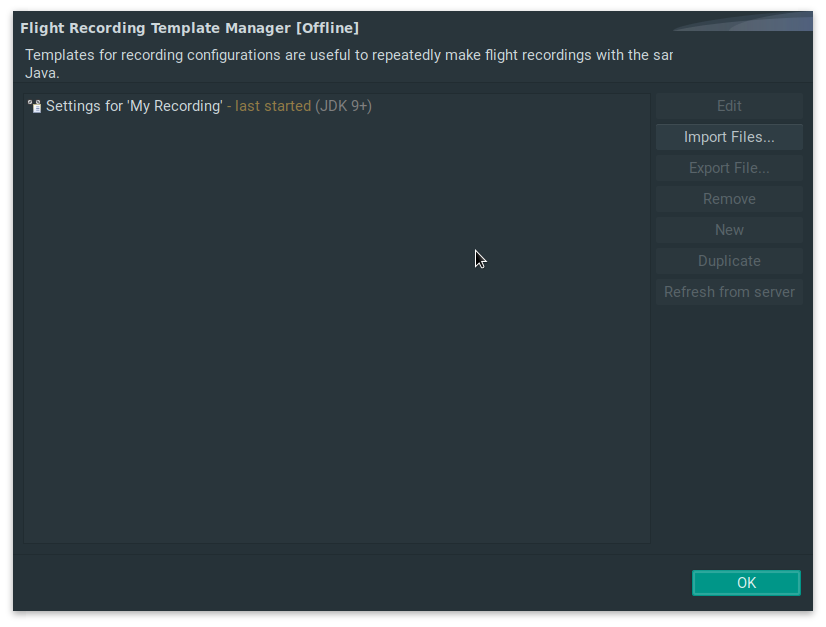
Launch JDK Mission ControlThe main JMC window after launch
Open the Template ManagerSelect Window > Flight Recording Template Manager
Import the Base Template
Click Import Files..., then browse to and select the
Template from Step 1.
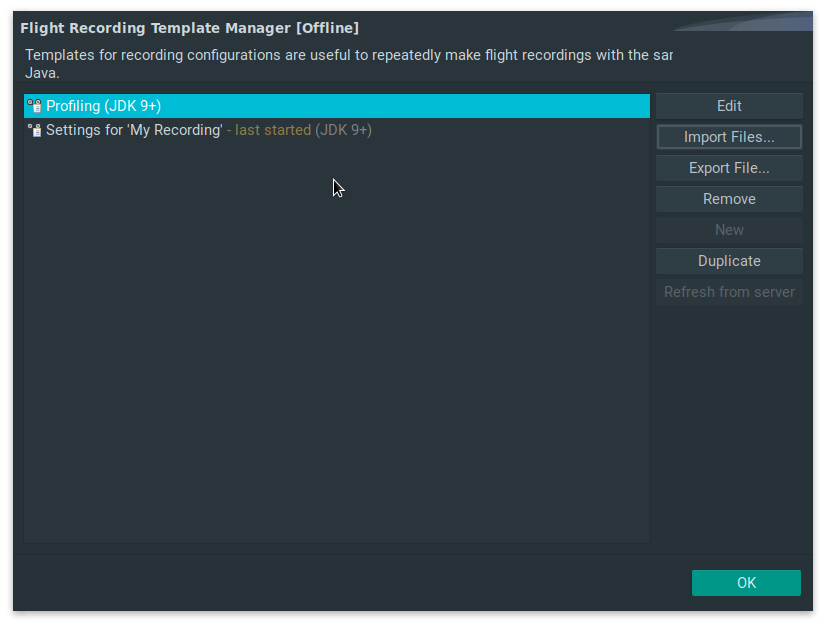
Edit the Template
Select the imported Template, then click Edit and make your
desired changes. Before making changes you may also click
Duplicate to create an identical copy of the Template as a base
to iterate upon.
Export the Template
Click Export File... to save the event template to a .jfc
file on your local workstation.
Once your edited Template is saved to a file on your local workstation
it can be used when starting new Flight Recordings. To do this using
Cryostat, see
Download, Edit, and Upload a Customized Event Template
for instructions on how to upload the new template to Cryostat and
Start/Stop a Recording
for instructions on how to create a new Recording using this Template.
Cryostat provides integration with Grafana to plot curated time series
metrics from a Recording. By selecting View in Grafana on either an
Active or Archived Recording, Cryostat uploads your Recording to
a custom Grafana Data Source, and launches Grafana in a new browser
tab. If Cryostat was installed to a Kubernetes/OpenShift cluster using the
Cryostat Operator or Cryostat Helm Chart, your browser should reuse the
same login credentials (if any) as for the Cryostat UI itself. If you are
greeted by a login page then simply log in again using your same account credentials
which you use to log in to Cryostat.
Select the Target ApplicationClik the Dropdown arrow on the right side of Target prompt to select or create a target.
If you wish to create a Custom Target from here, click Create Target displayed at the bottom. Go to Create a Custom Target and proceed from step 3.
Also, see Using the Cryostat Agent section to help discover other targets.
Navigate to Flight Recorder/Capture/Recordings
Supply JMX credentials to authenticate to the target, if necessary. If
the target is not configured with JMX authentication then the
connection attempt will continue without prompting for credentials.
If the targetJVM has SSL/TLS enabled on JMX connections, it may be
necessary to add the target's certificate to Cryostat's trust store. Go
to Add a Trusted Certificate
and return to this section after completing that guide.
Select a Recording
If you do not have any Recordings present in the Active Recordings
view, follow
Start/Stop a Recording
to create one, or select a different Target application.
You may also select an Archived Recording to view in Grafana.
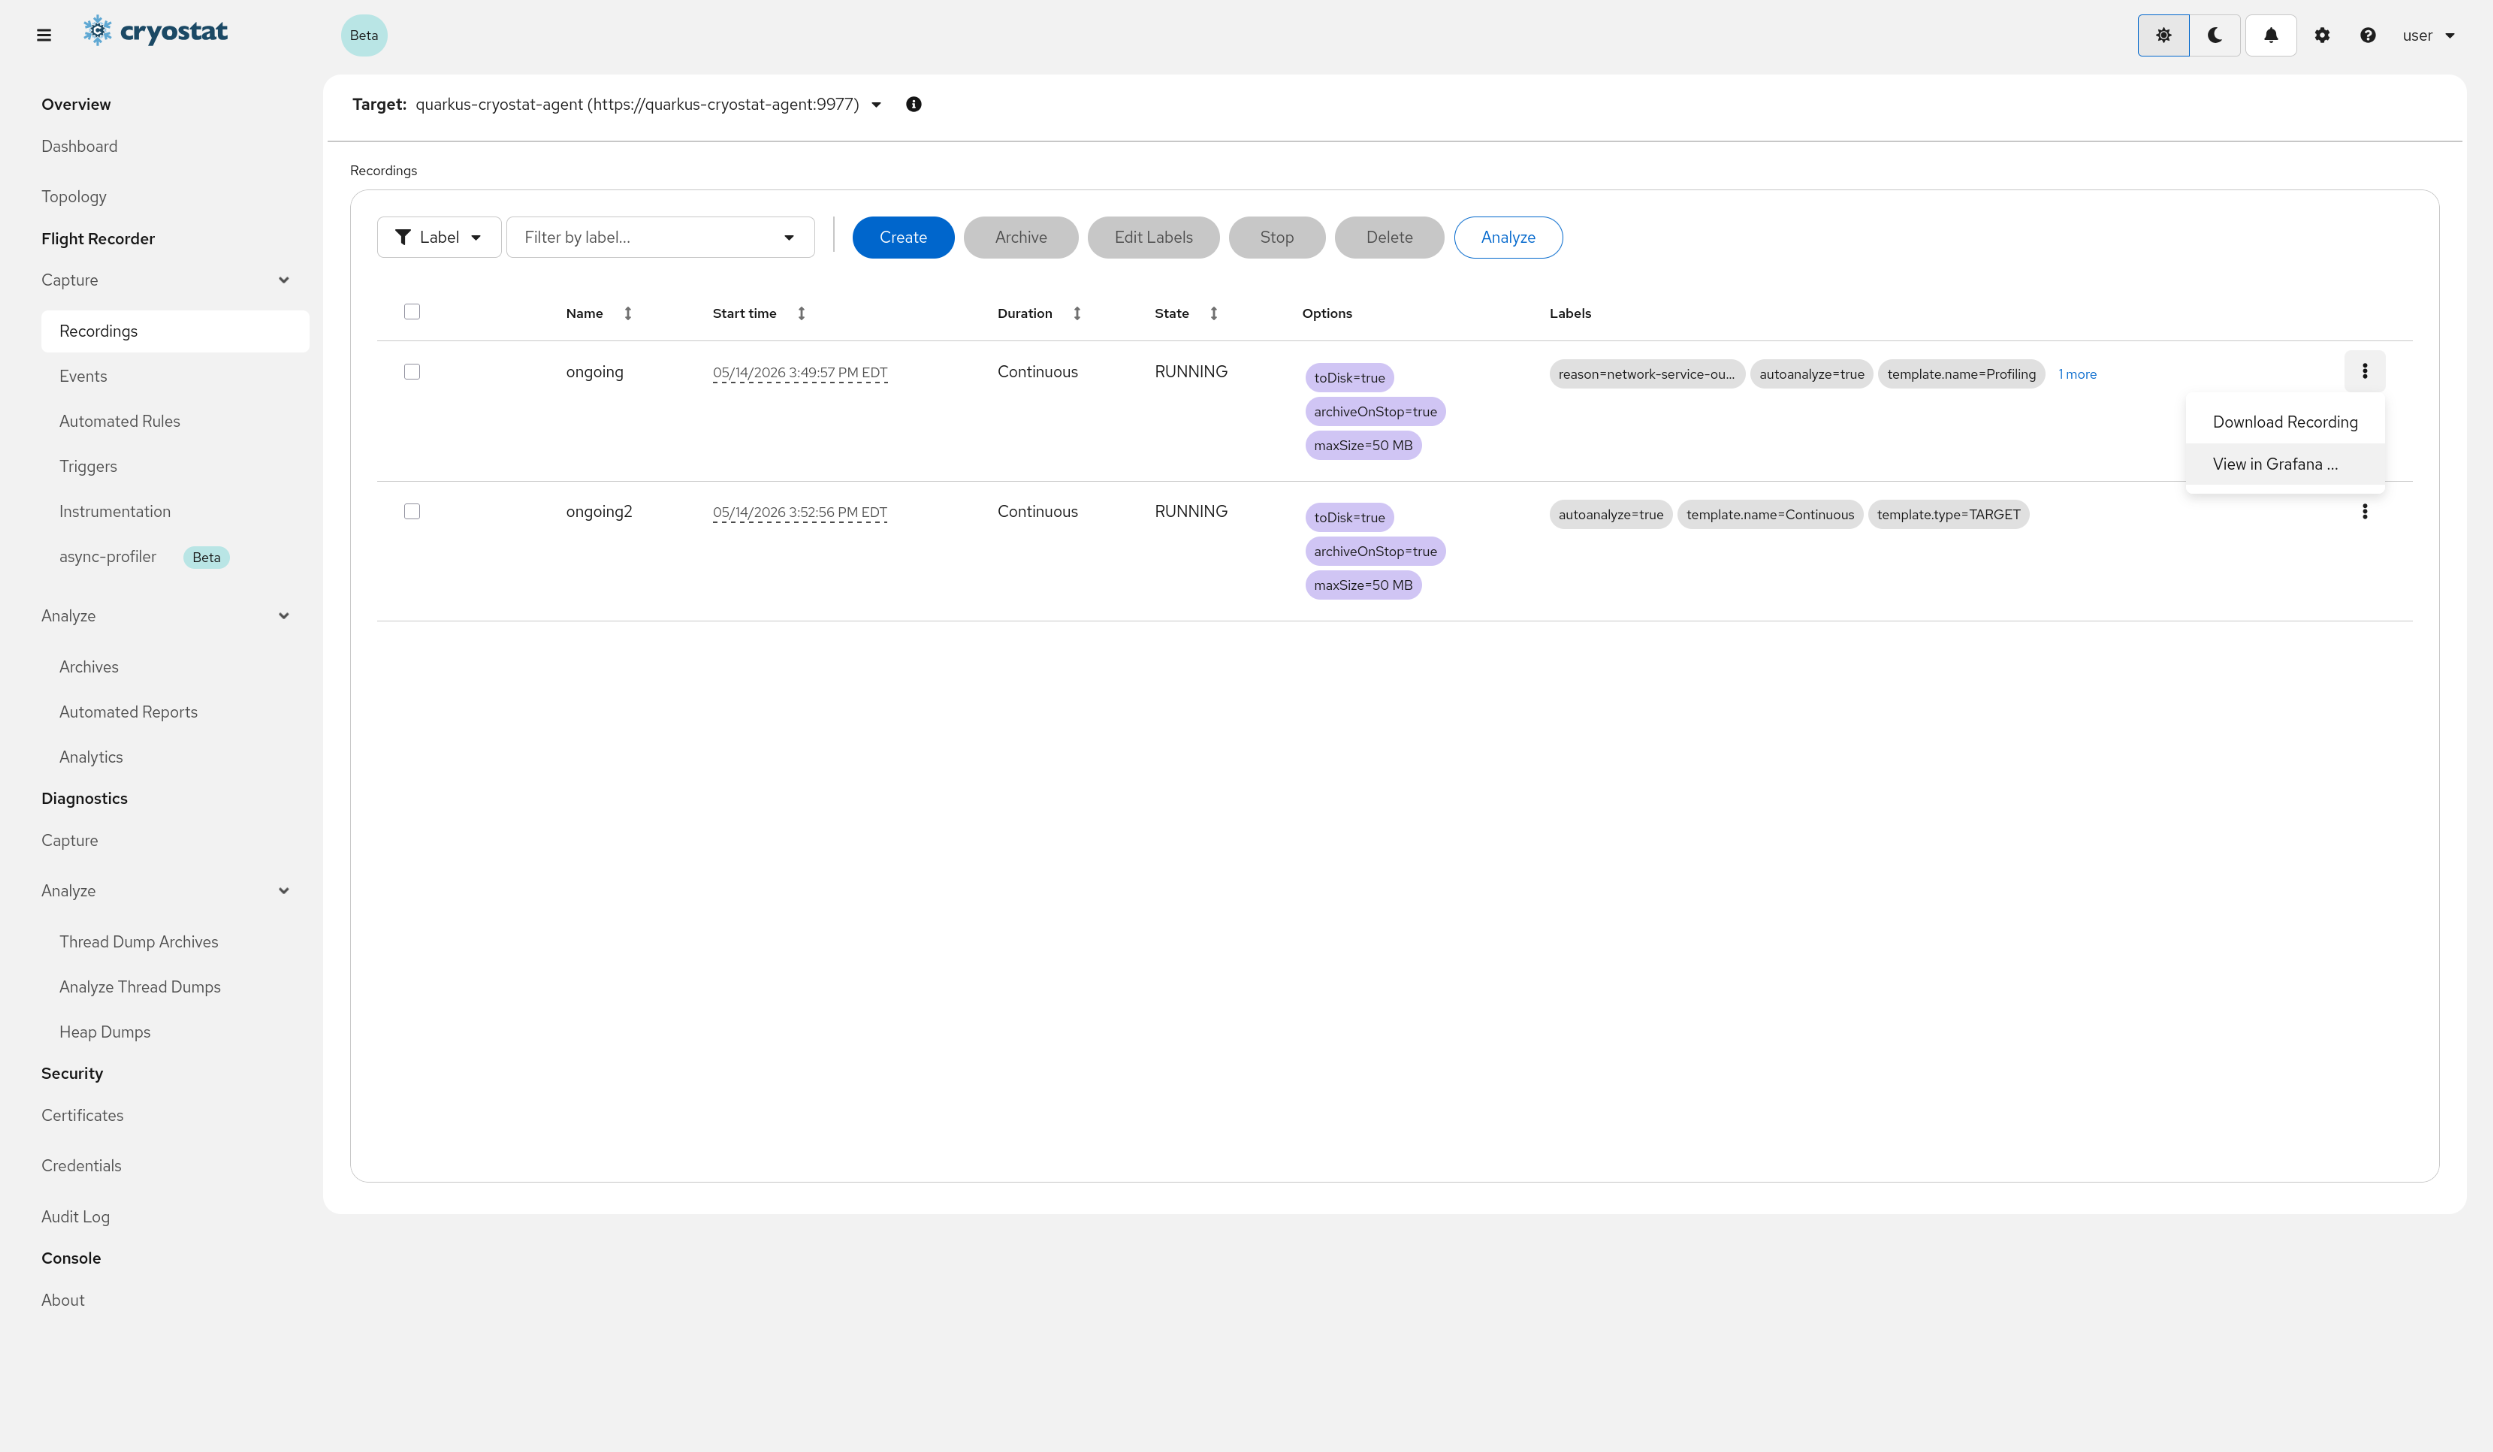
Select View in Grafana...
Select View in Grafana... from the Recording's overflow
menu.
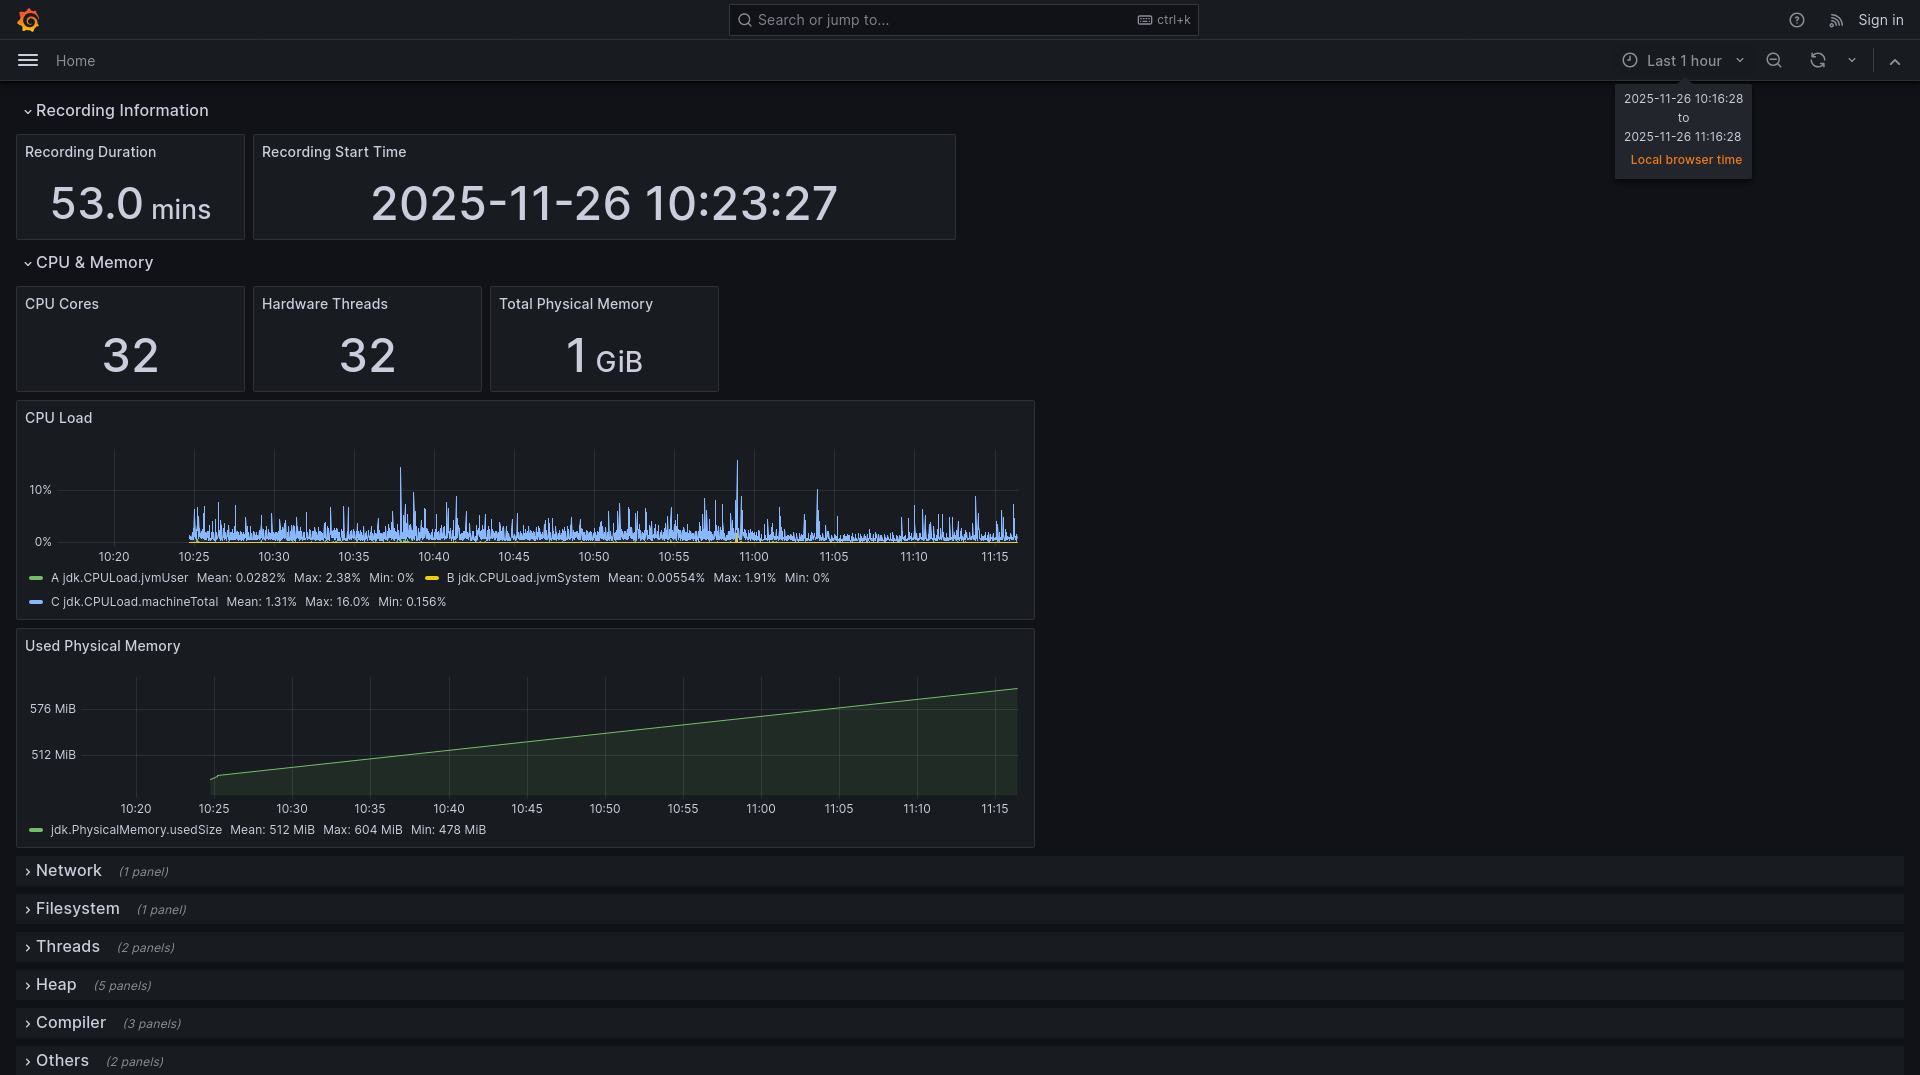
View and Interact With Data From Your Recording
Observe the plotted time series data from curated metrics in your
Recording. Select time ranges to zoom into the data.
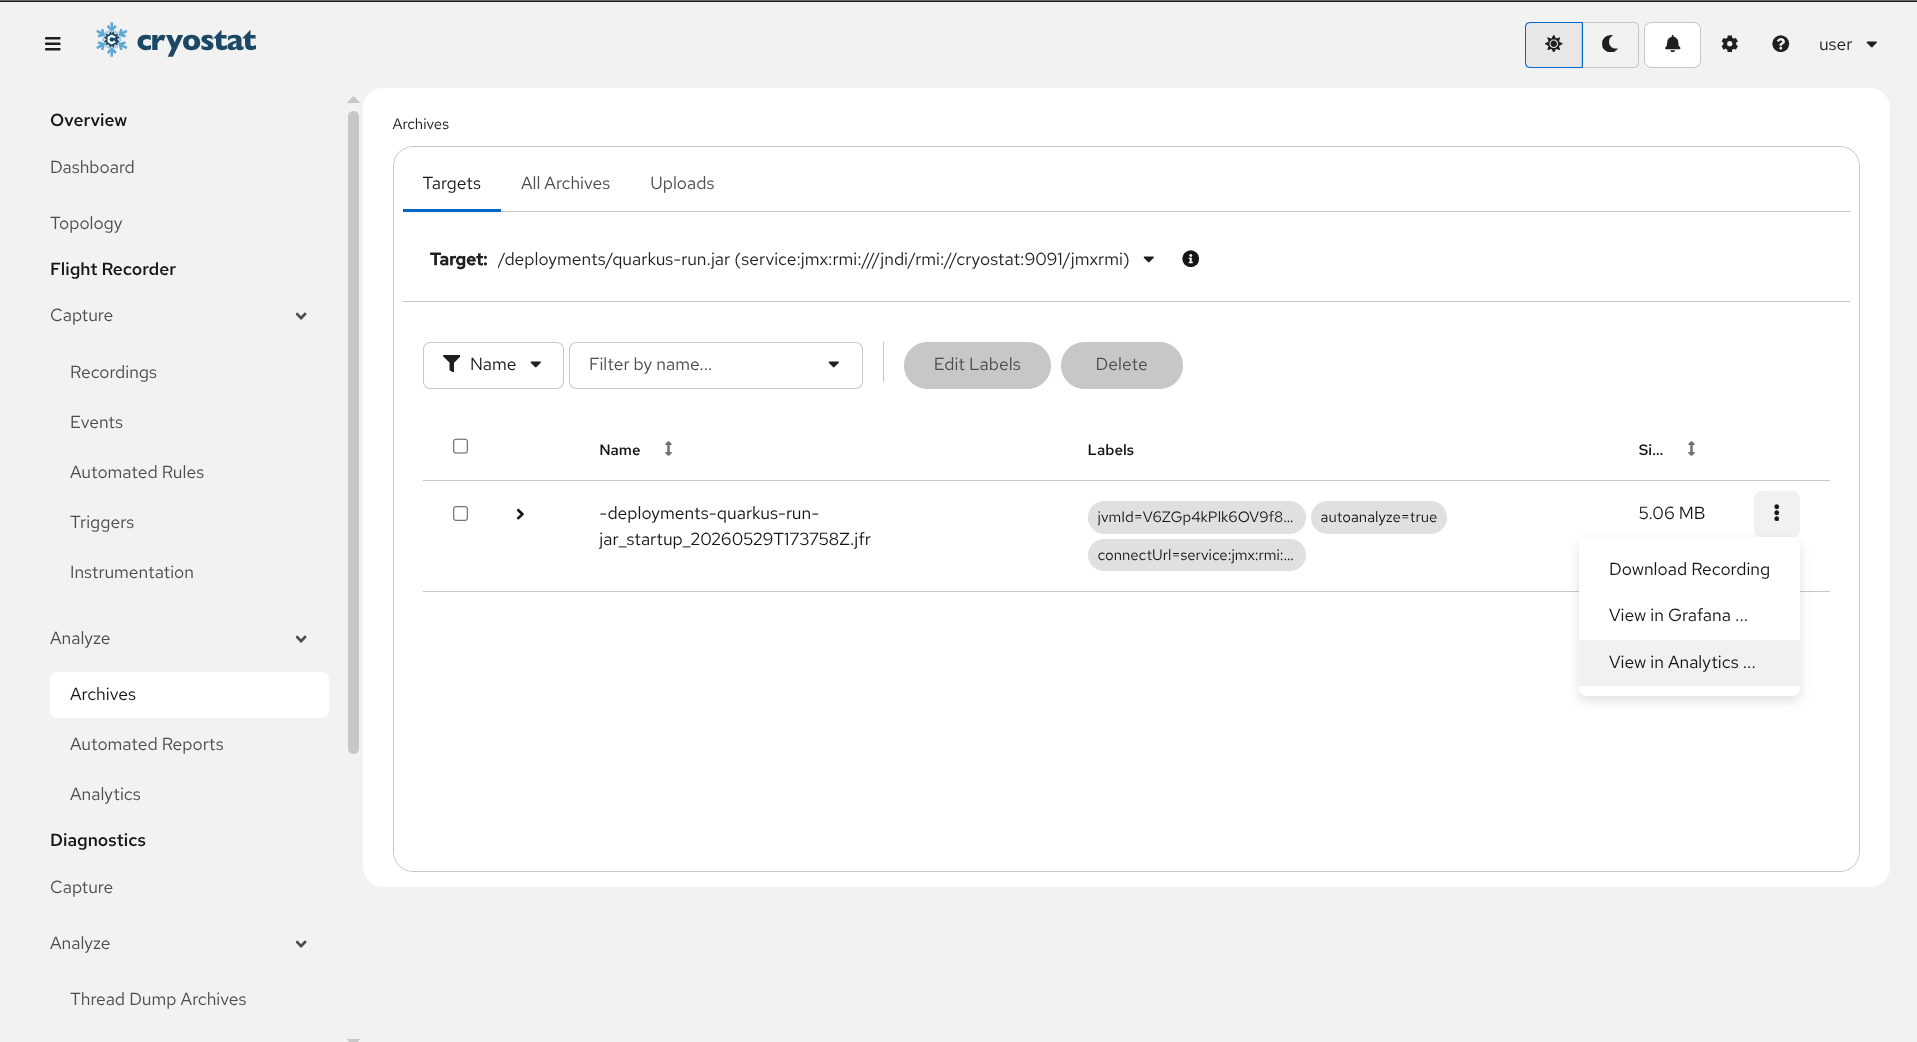
Cryostat integrates jfr-analytics
and enables clients to perform SQL queries against Archived Recordings to
inspect their contents. Select the View in Analytics … menu action item from
the Archives view to jump to the Flight Recorder > Analyze > Analytics
view with the selected recording pre-filled.
This feature enables users to analyze Archived Recording data with in-depth and
highly specific queries to suit their own individual use cases and needs.
When an Archived Recording is loaded for analysis, Cryostat retains a local
copy of that data for some time to avoid re-loading the data from object storage
for each SQL query. This reduces the request latency of follow-up queries and may
reduce the operational costs of object storage requests and data transfers if
using external commercial object storage.
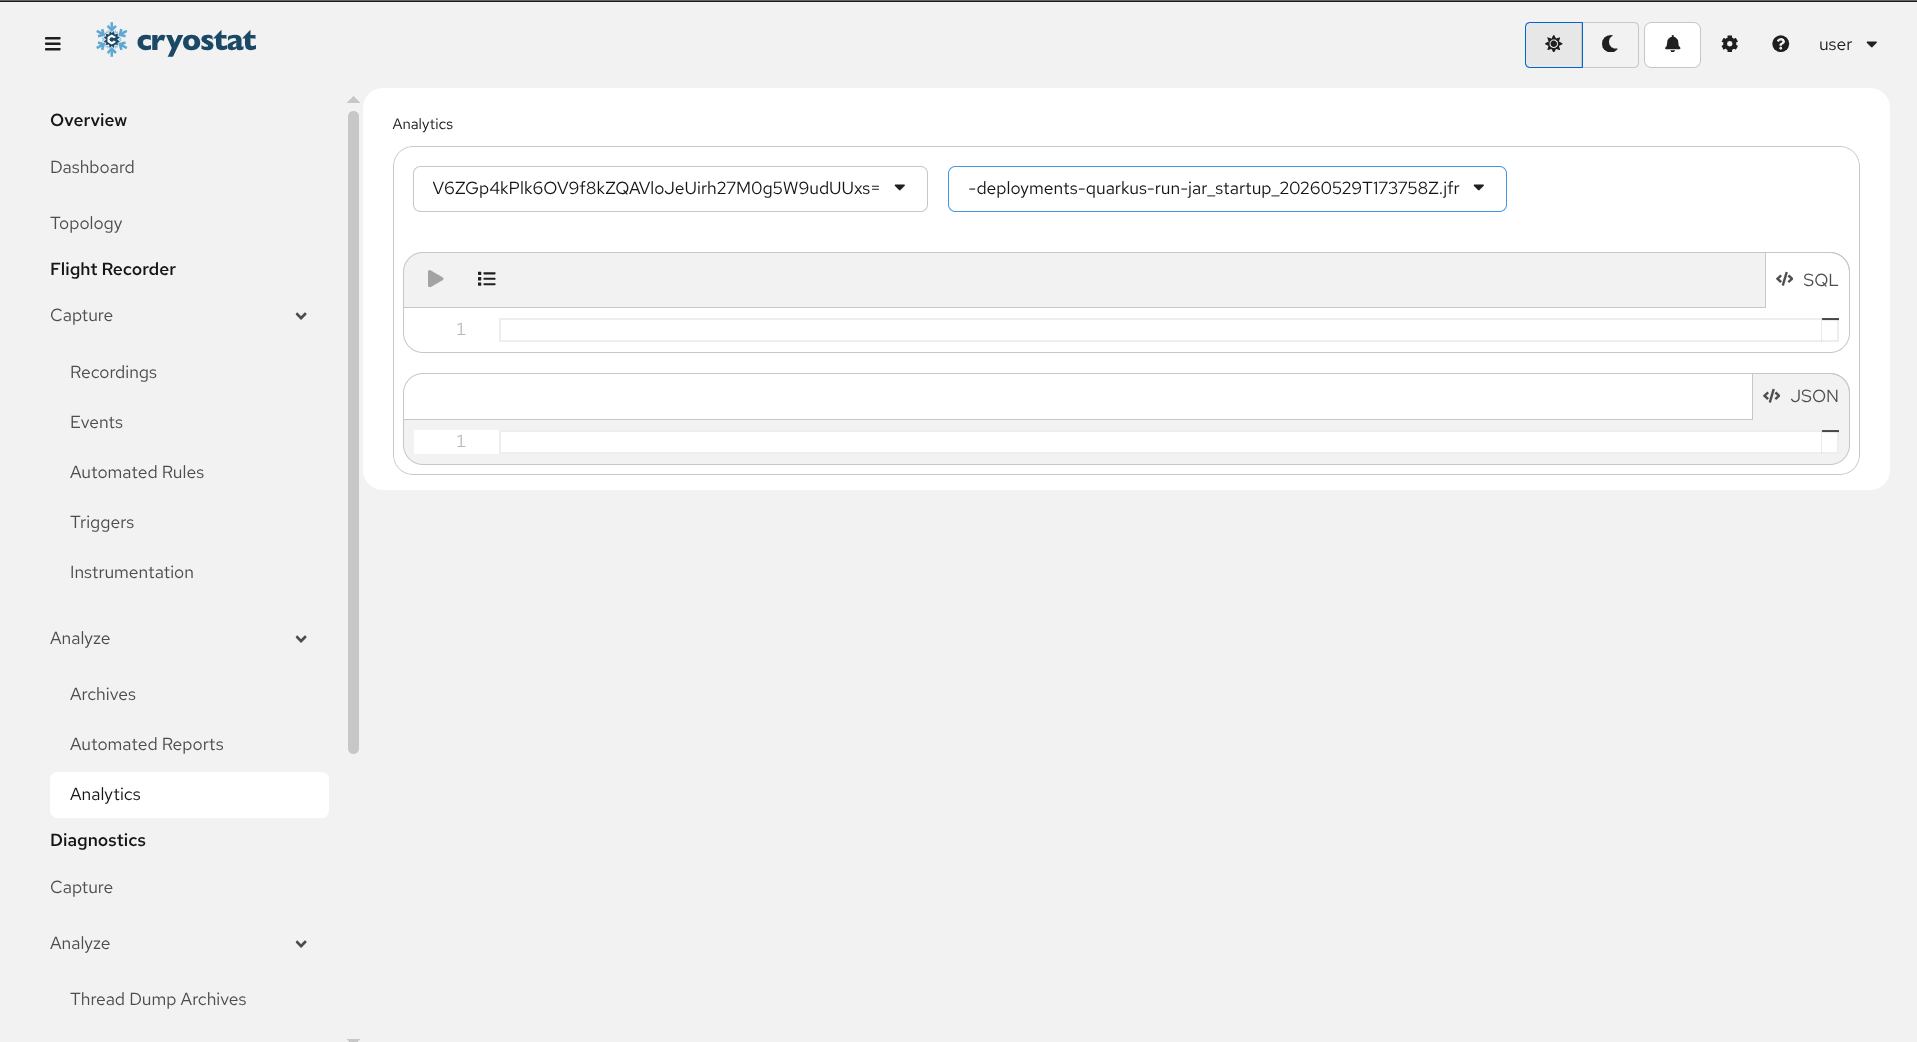
Select View in Analytics...
Select View in Analytics... from the Archived Recording's
overflow menu.
Choose a sample query or enter your own query
The upper text input area allows you to choose from a supplied list of example
queries or to write your own free-form SQL queries. The text input provides SQL
syntax highlighting. When you are ready to execute your query, click the
triangular 'Play' icon button.
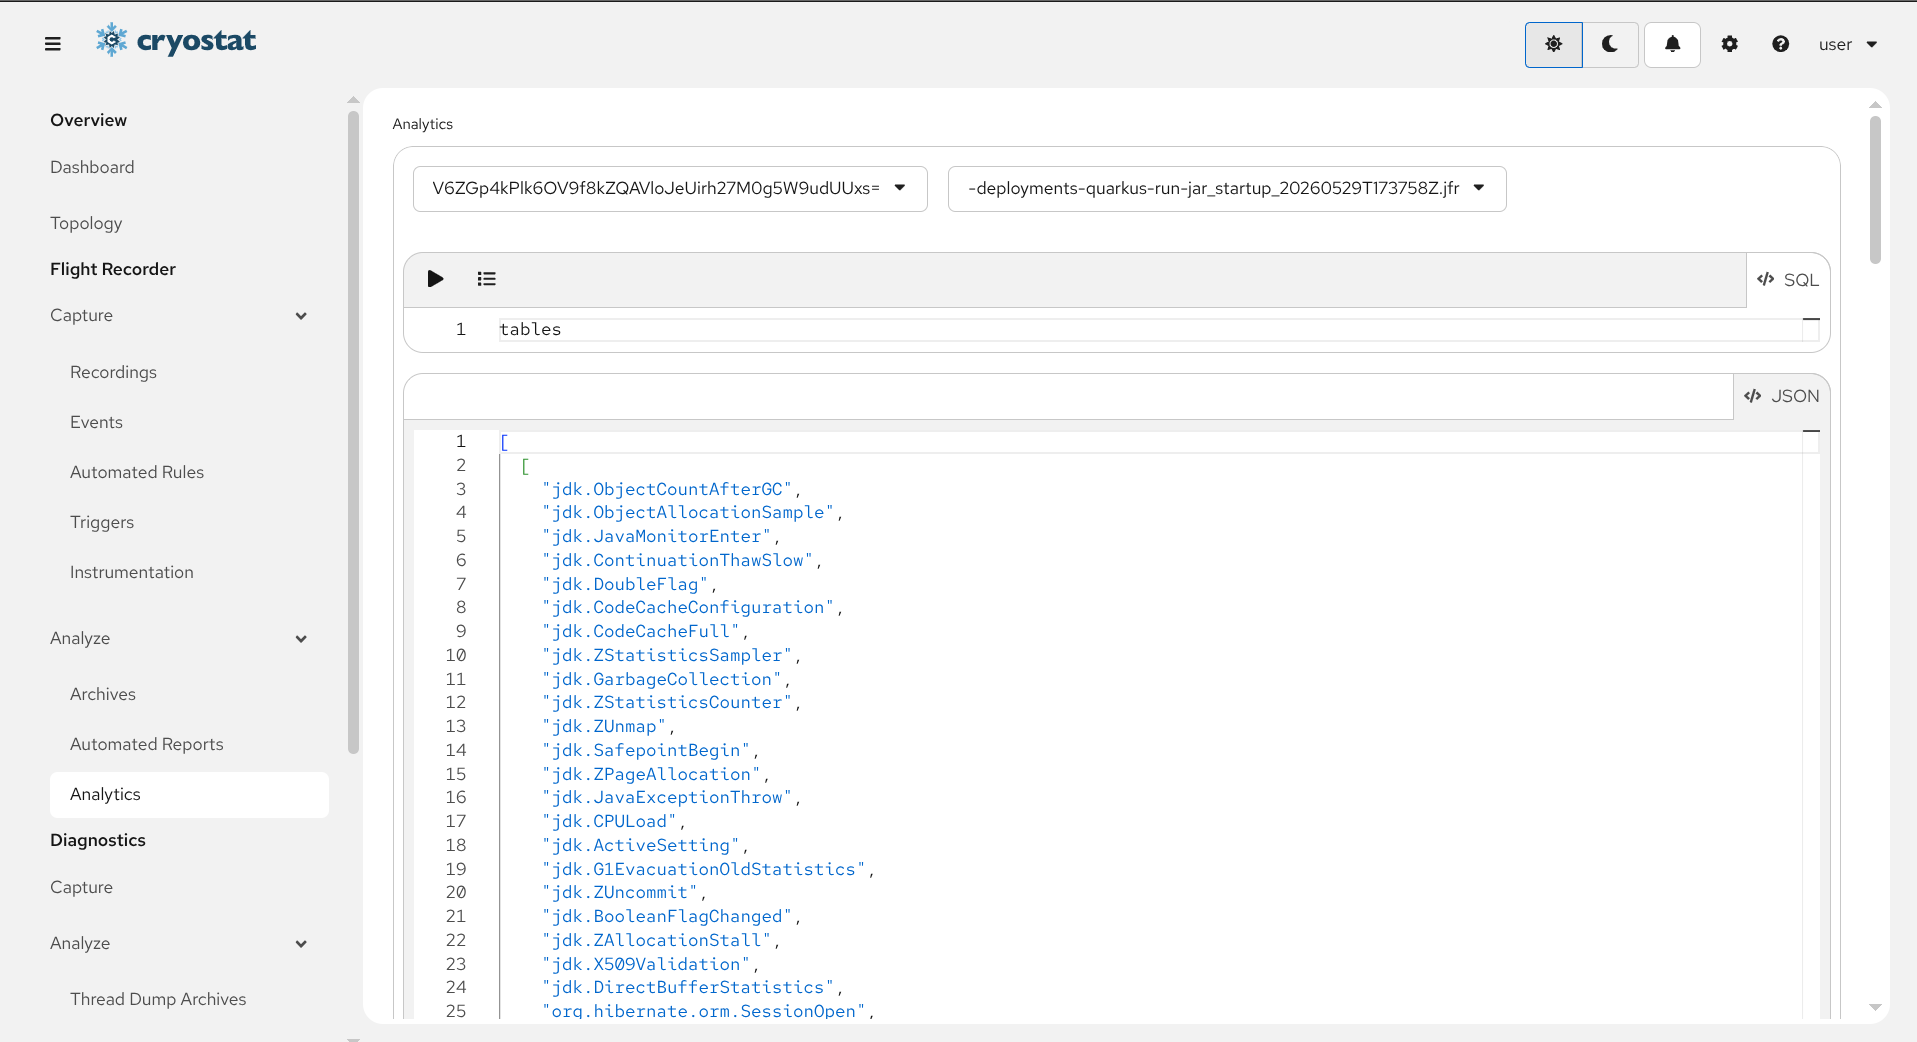
Test the 'tables' sample meta-query
The first sample meta-query is simply 'tables'. This meta-query lists all of the
tables present in the database view of the recording. Each Flight Recorder event
type is represented as a table.
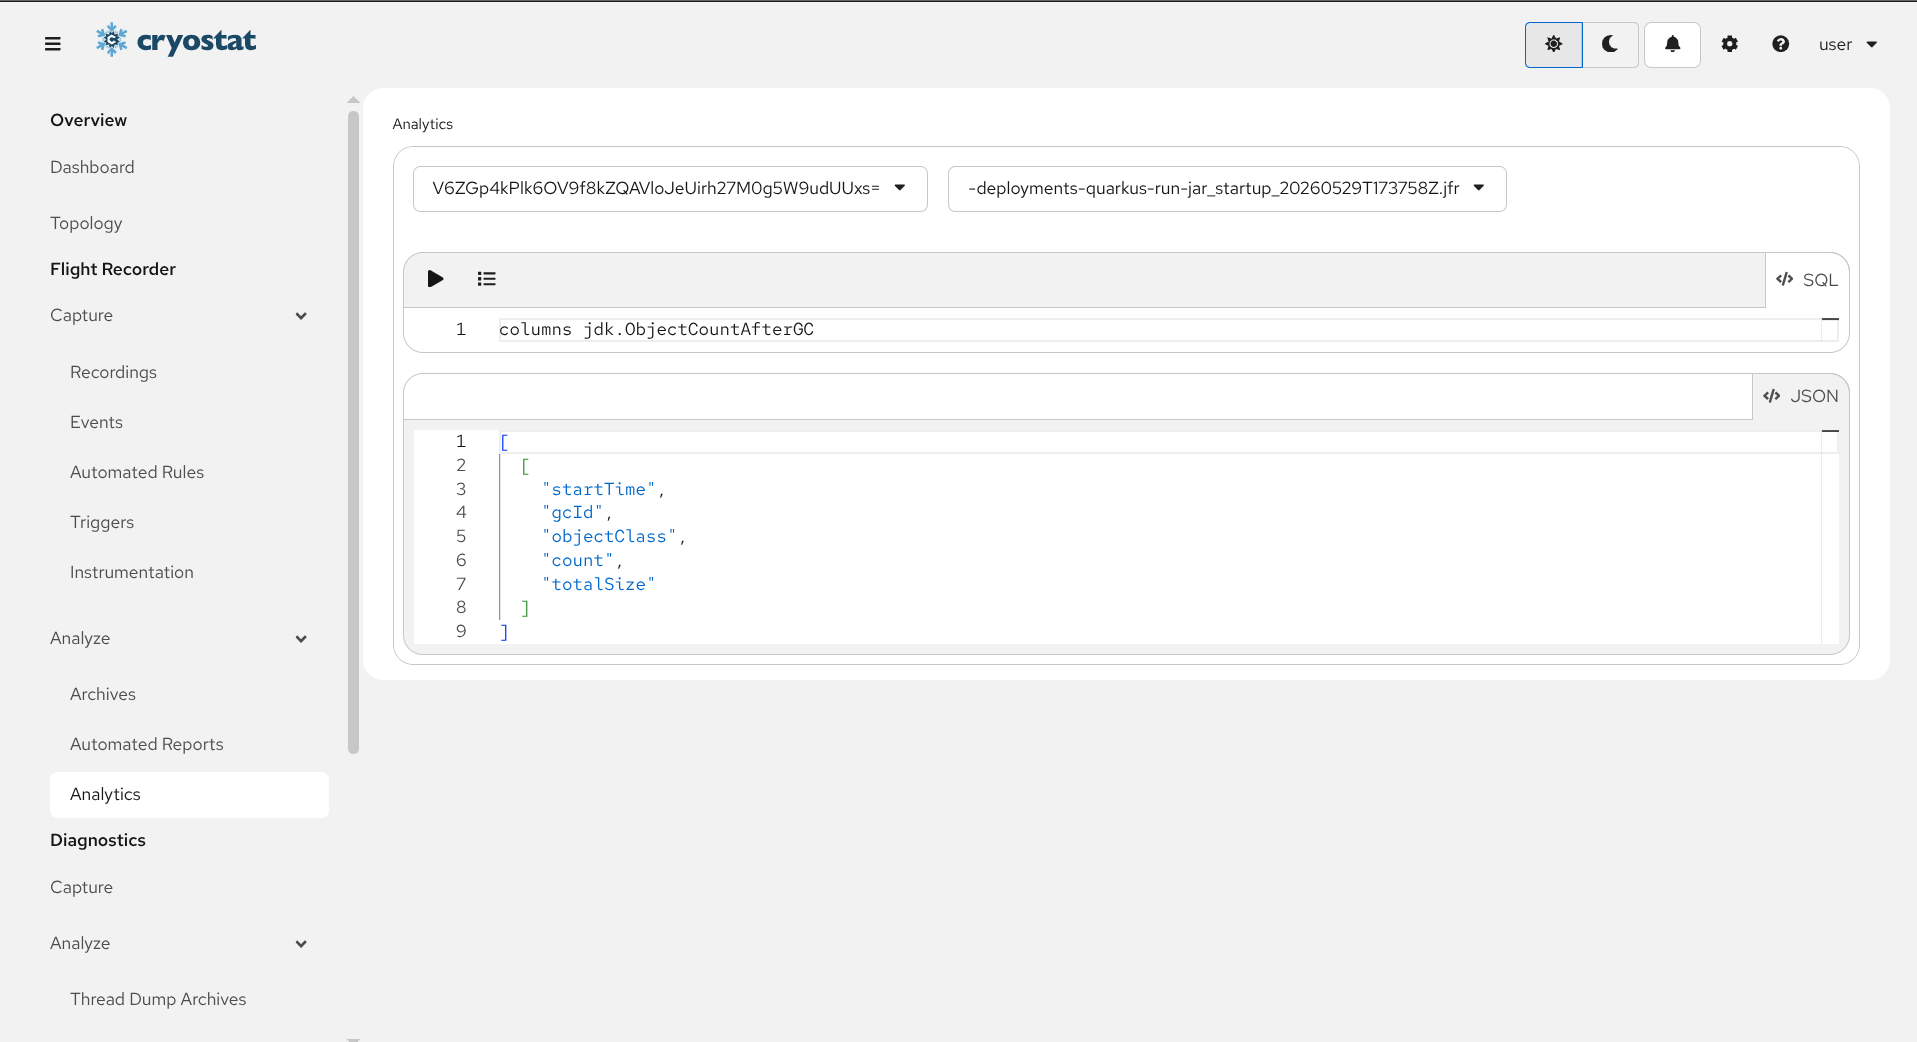
Test the 'columns $TABLE_NAME' sample meta-query
The second sample meta-query is 'columns $TABLE_NAME', where `$TABLE_NAME` is
a placeholder that you must replace with the name of a table you are interested
in. The query result is the list of column names on that table, or in other words
the Flight Recorder event attribute names that can be queried.
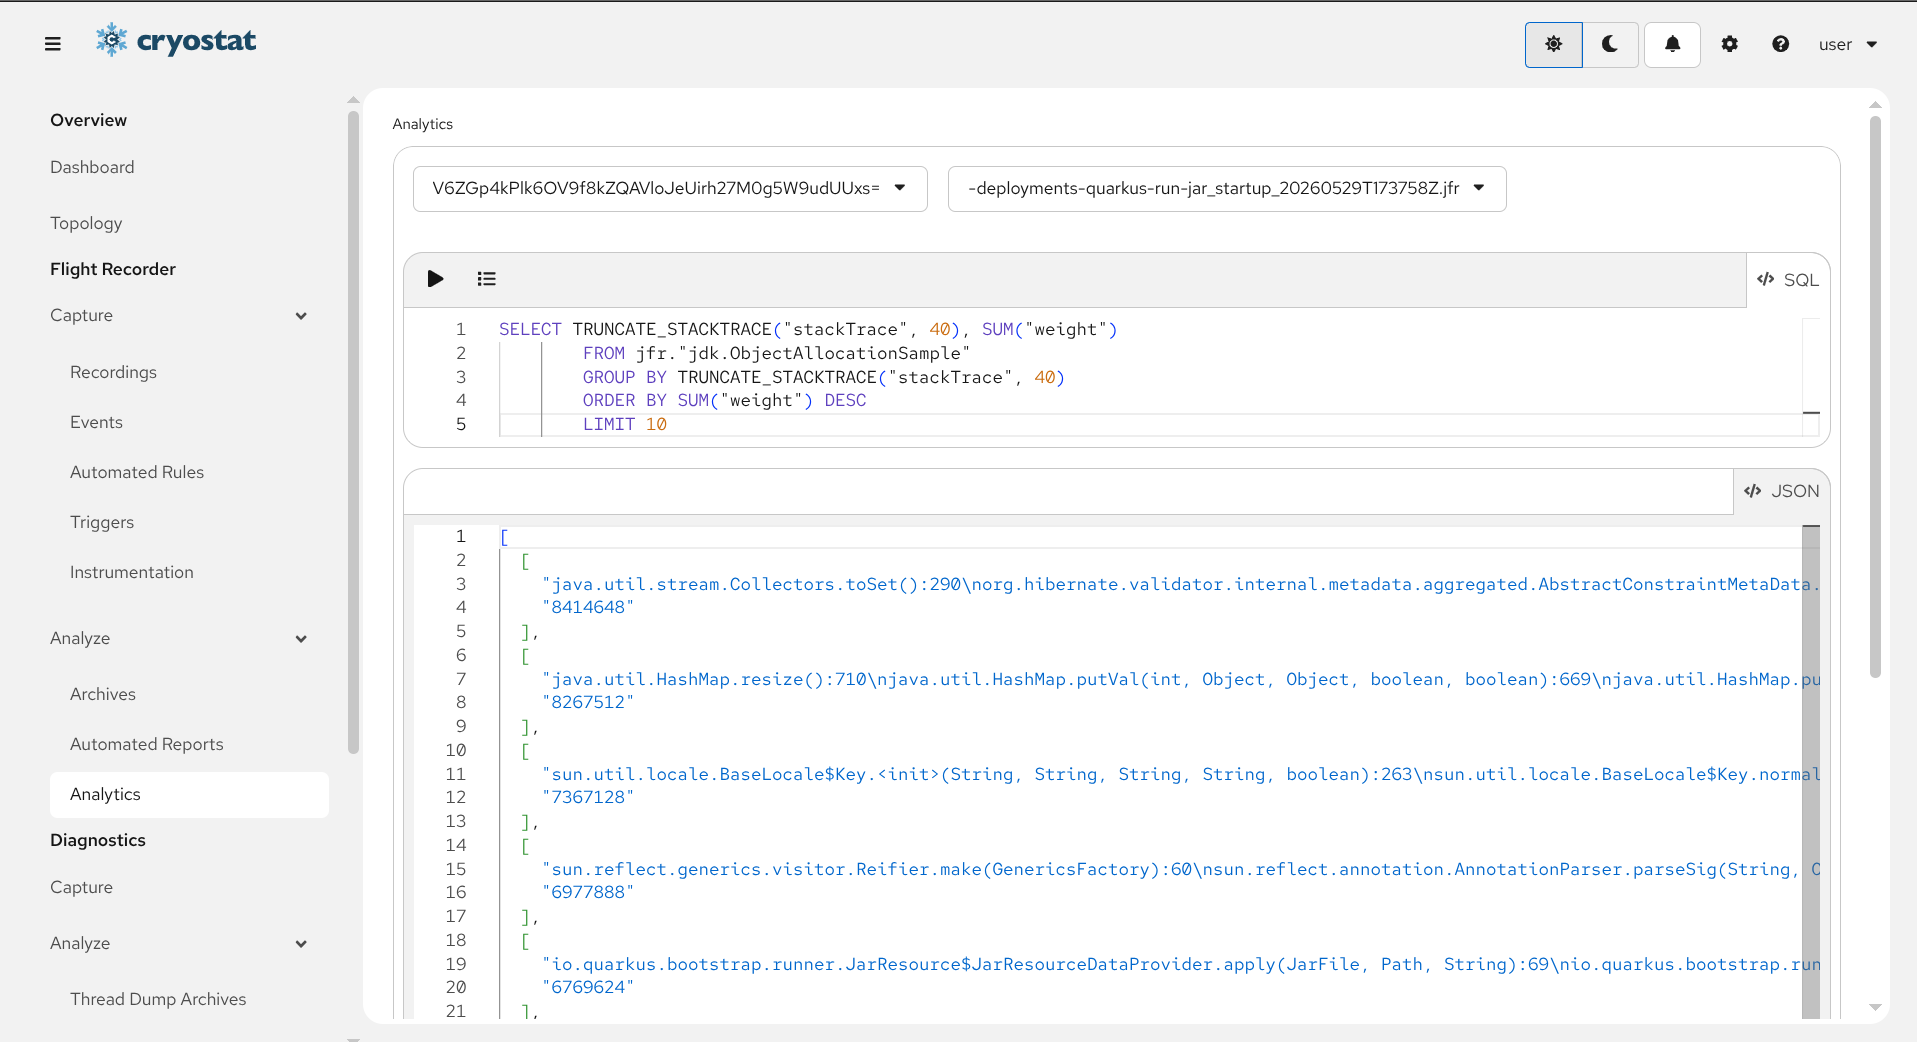
Test a complex sample query or write your own
Select another sample query which performs a more complex operation against
the recording's database view, or write your own SQL query, and execute it
to view the result.
Cryostat integrates the same Automated Analysis reports that you would
find in JDK Mission Control (“JMC”). The
JMC rules engine analyzes your Recording and looks for common problems,
assigning a severity score from 0 (no problem) to 100 (potentially
severe problem) to each potential problem type.
Cryostat also provides an Automated Analysis Card that is able to display
the same information. The Card is available for use in the Dashboard.
Read the section on the Automated Analysis Card for more information.
Select the Target ApplicationClik the Dropdown arrow on the right side of Target prompt to select or create a target.
If you wish to create a Custom Target from here, click Create Target displayed at the bottom. Go to Create a Custom Target and proceed from step 3.
Also, see Using the Cryostat Agent section to help discover other targets.
Navigate to Flight Recorder/Capture/Recordings
Supply JMX credentials to authenticate to the target, if necessary. If
the target is not configured with JMX authentication then the
connection attempt will continue without prompting for credentials.
If the targetJVM has SSL/TLS enabled on JMX connections, it may be
necessary to add the target's certificate to Cryostat's trust store. Go
to Add a Trusted Certificate
and return to this section after completing that guide.
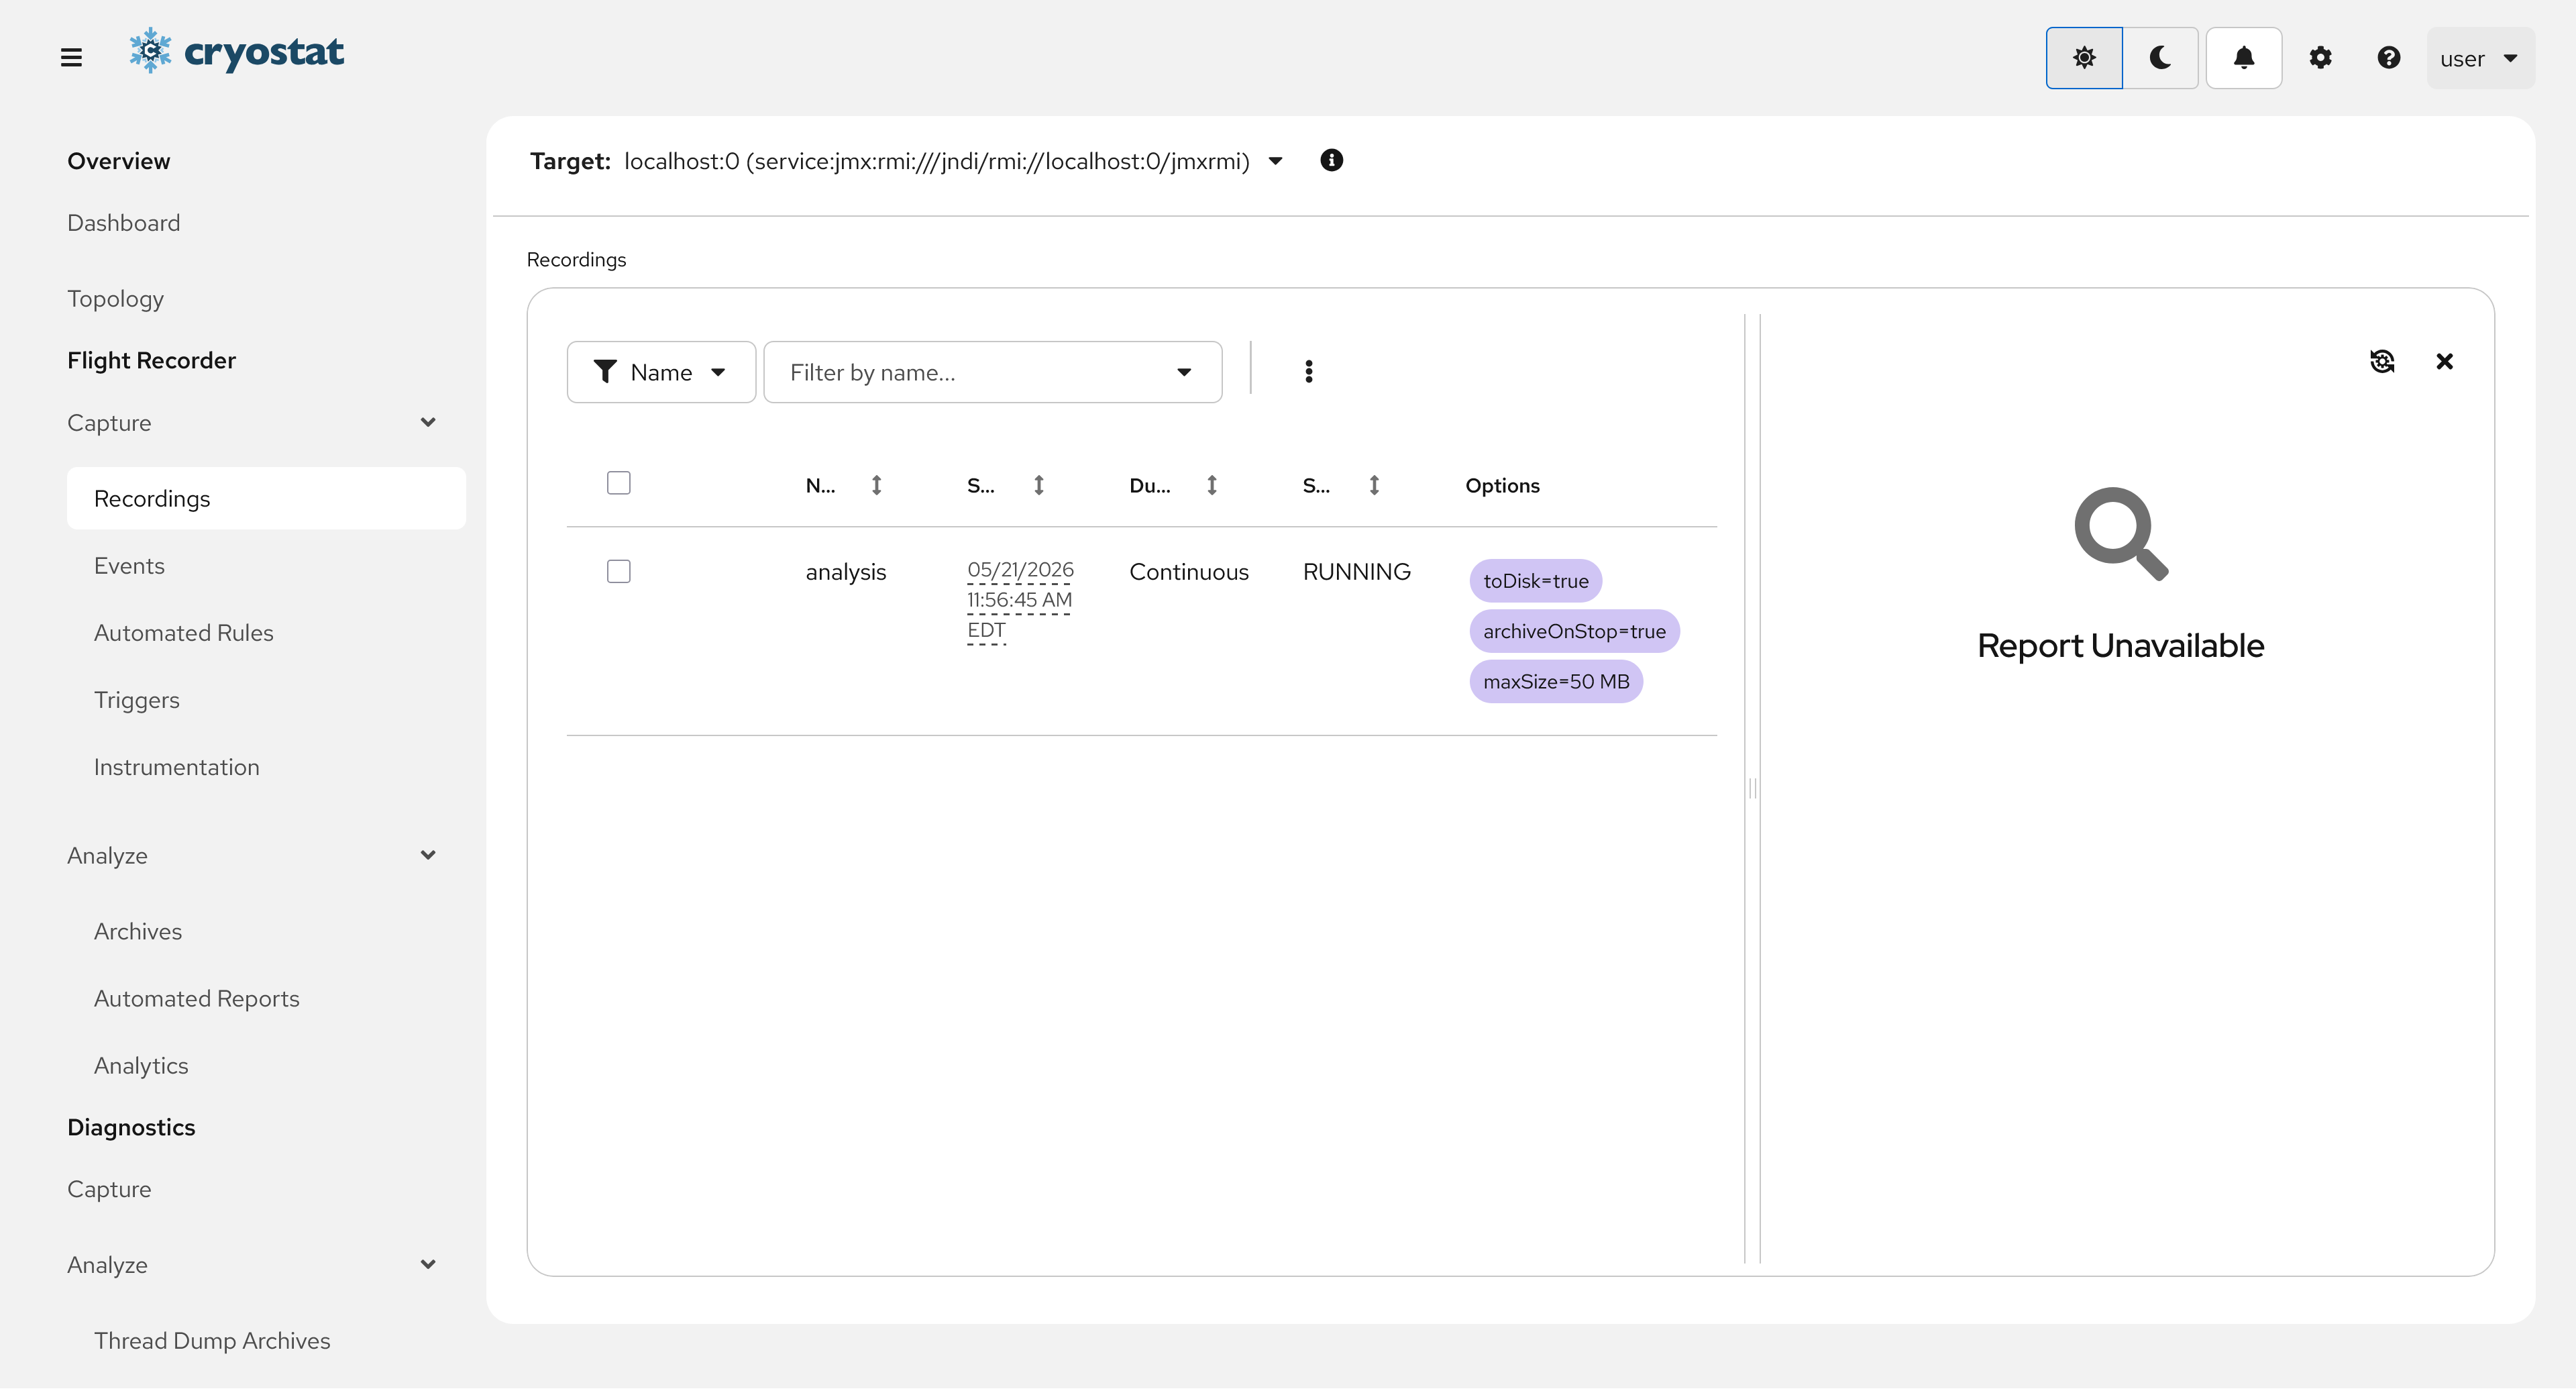
Click the Analyze toolbar button
The analysis drawer will appear from the side. If Cryostat has already analyzed recording data from
this target recently then content will appear in the drawer. If there are no Active Recordings
to source data from, click the Create a Recording call to action to be guided through
Recording creation, then return back to this view.
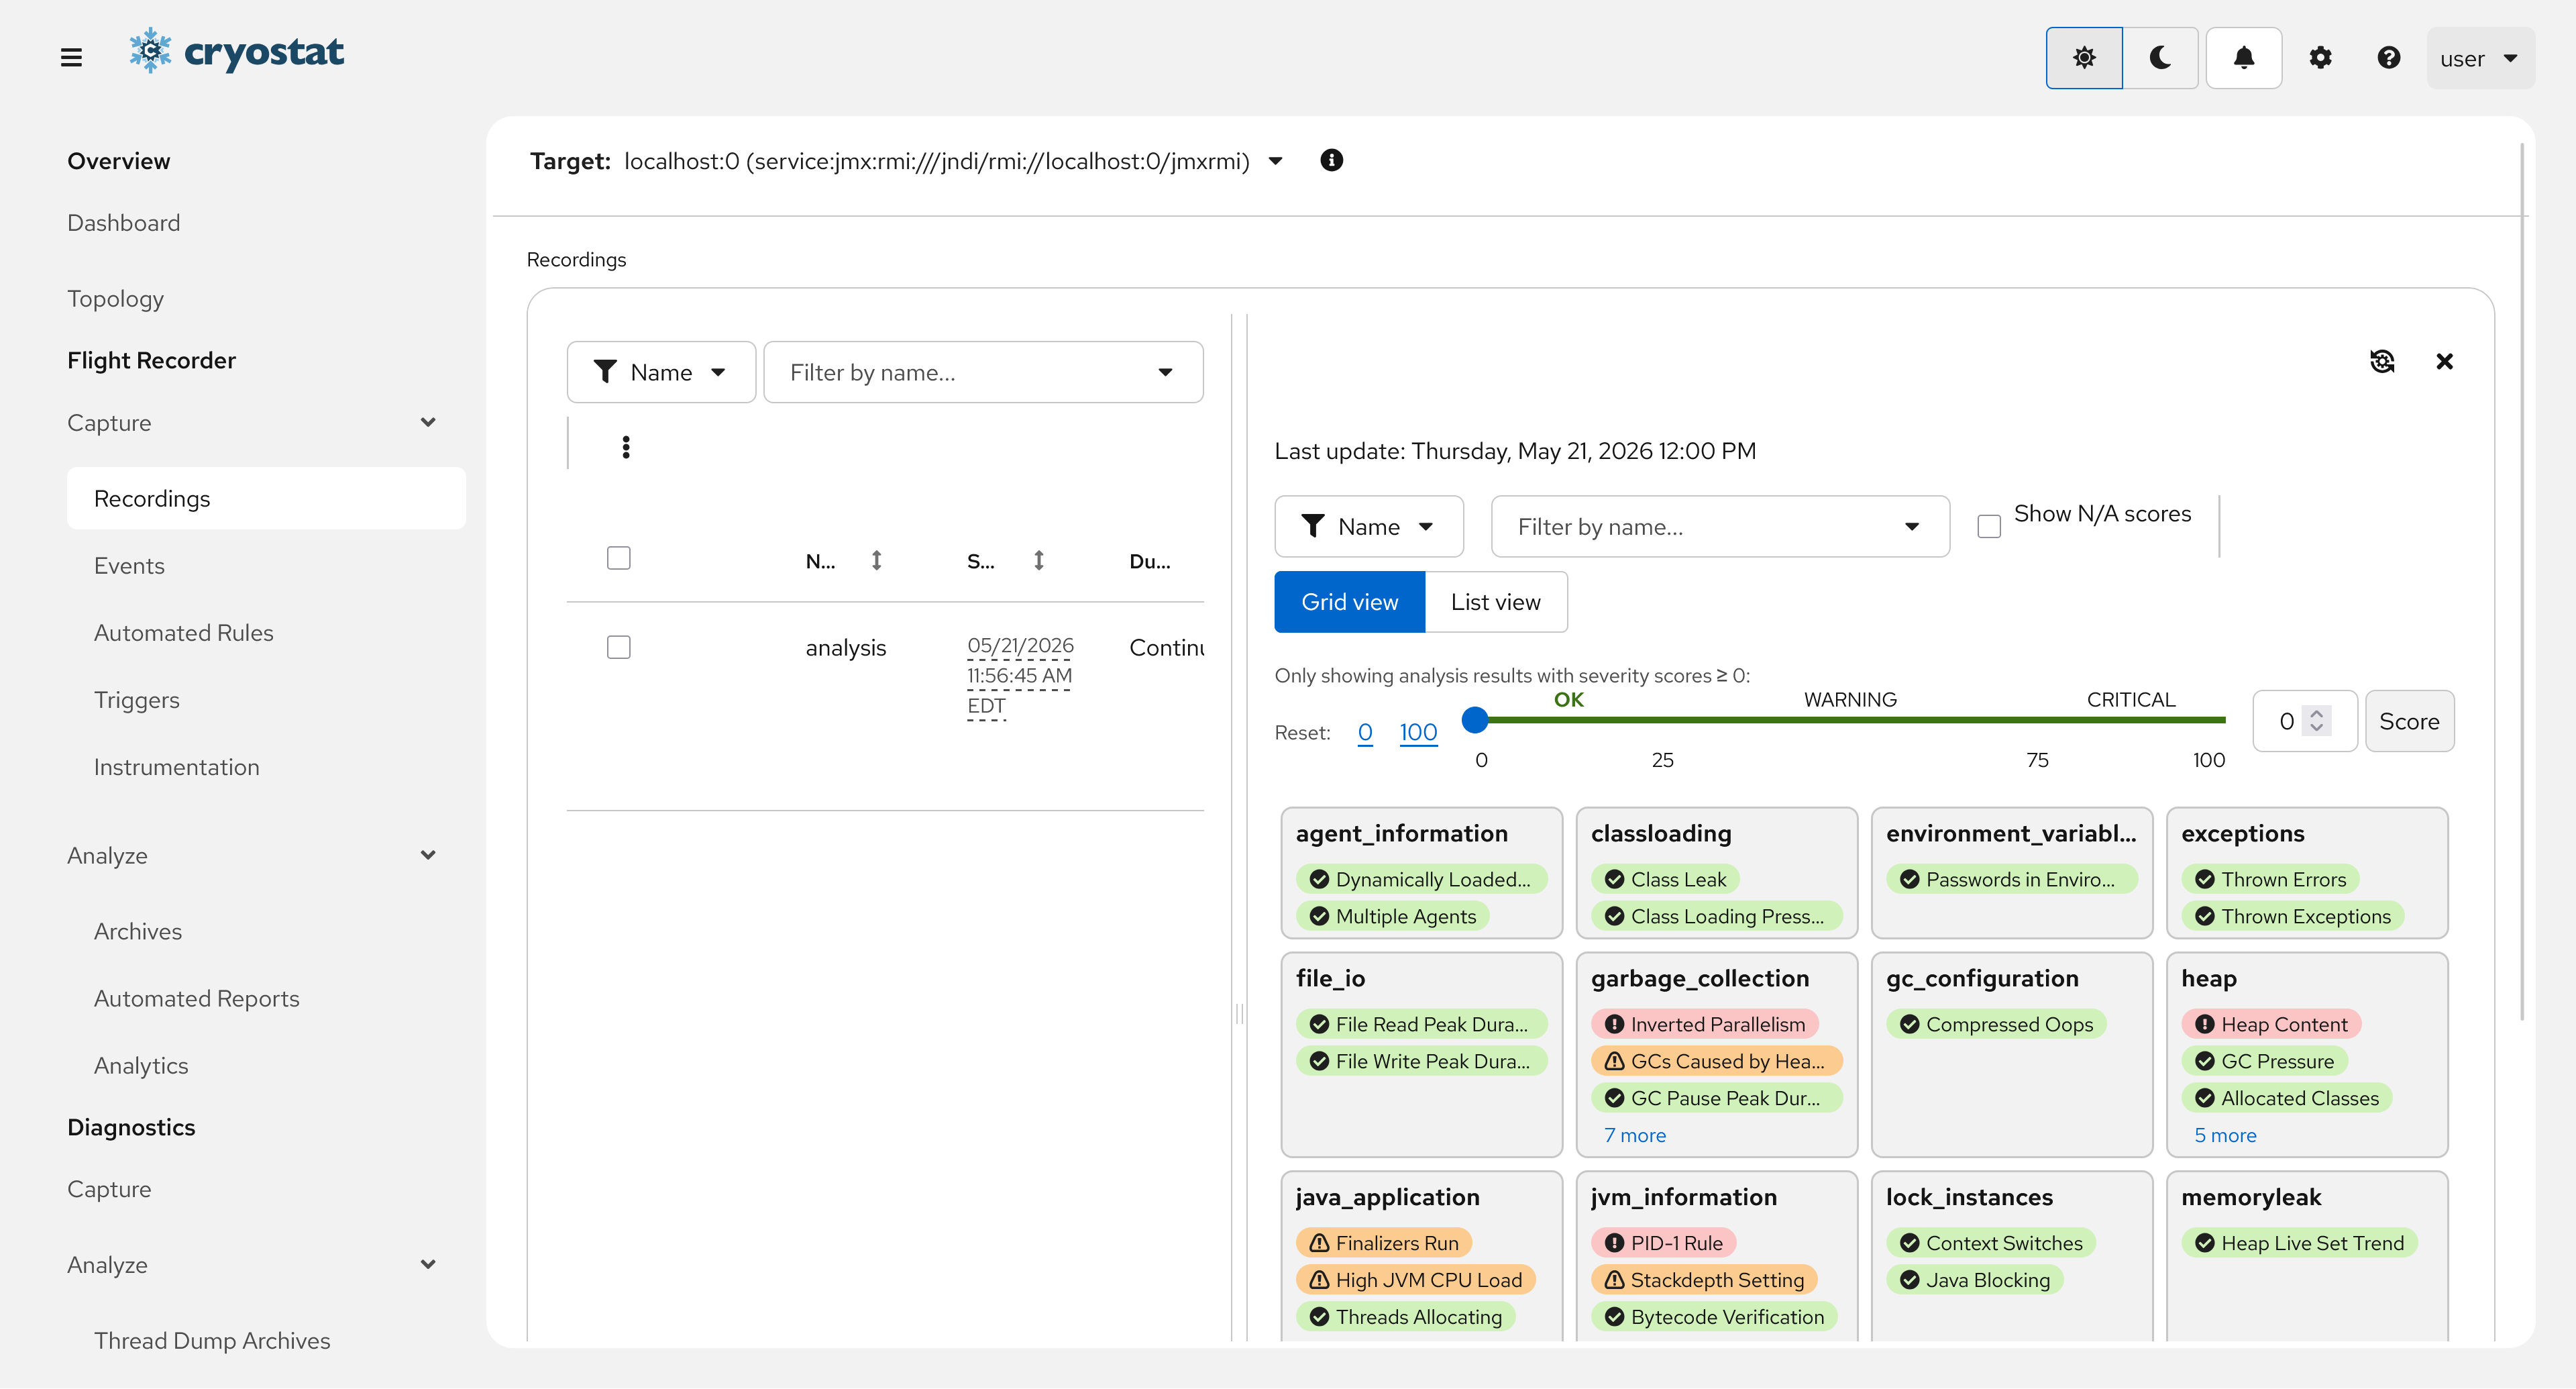
Request analysis
Click the analysis process button in the corner of the drawer panel.
View Details and Suggestions for Results
Click on each result to view specifics on what the result means and possible suggestions to fix
the potential problem.
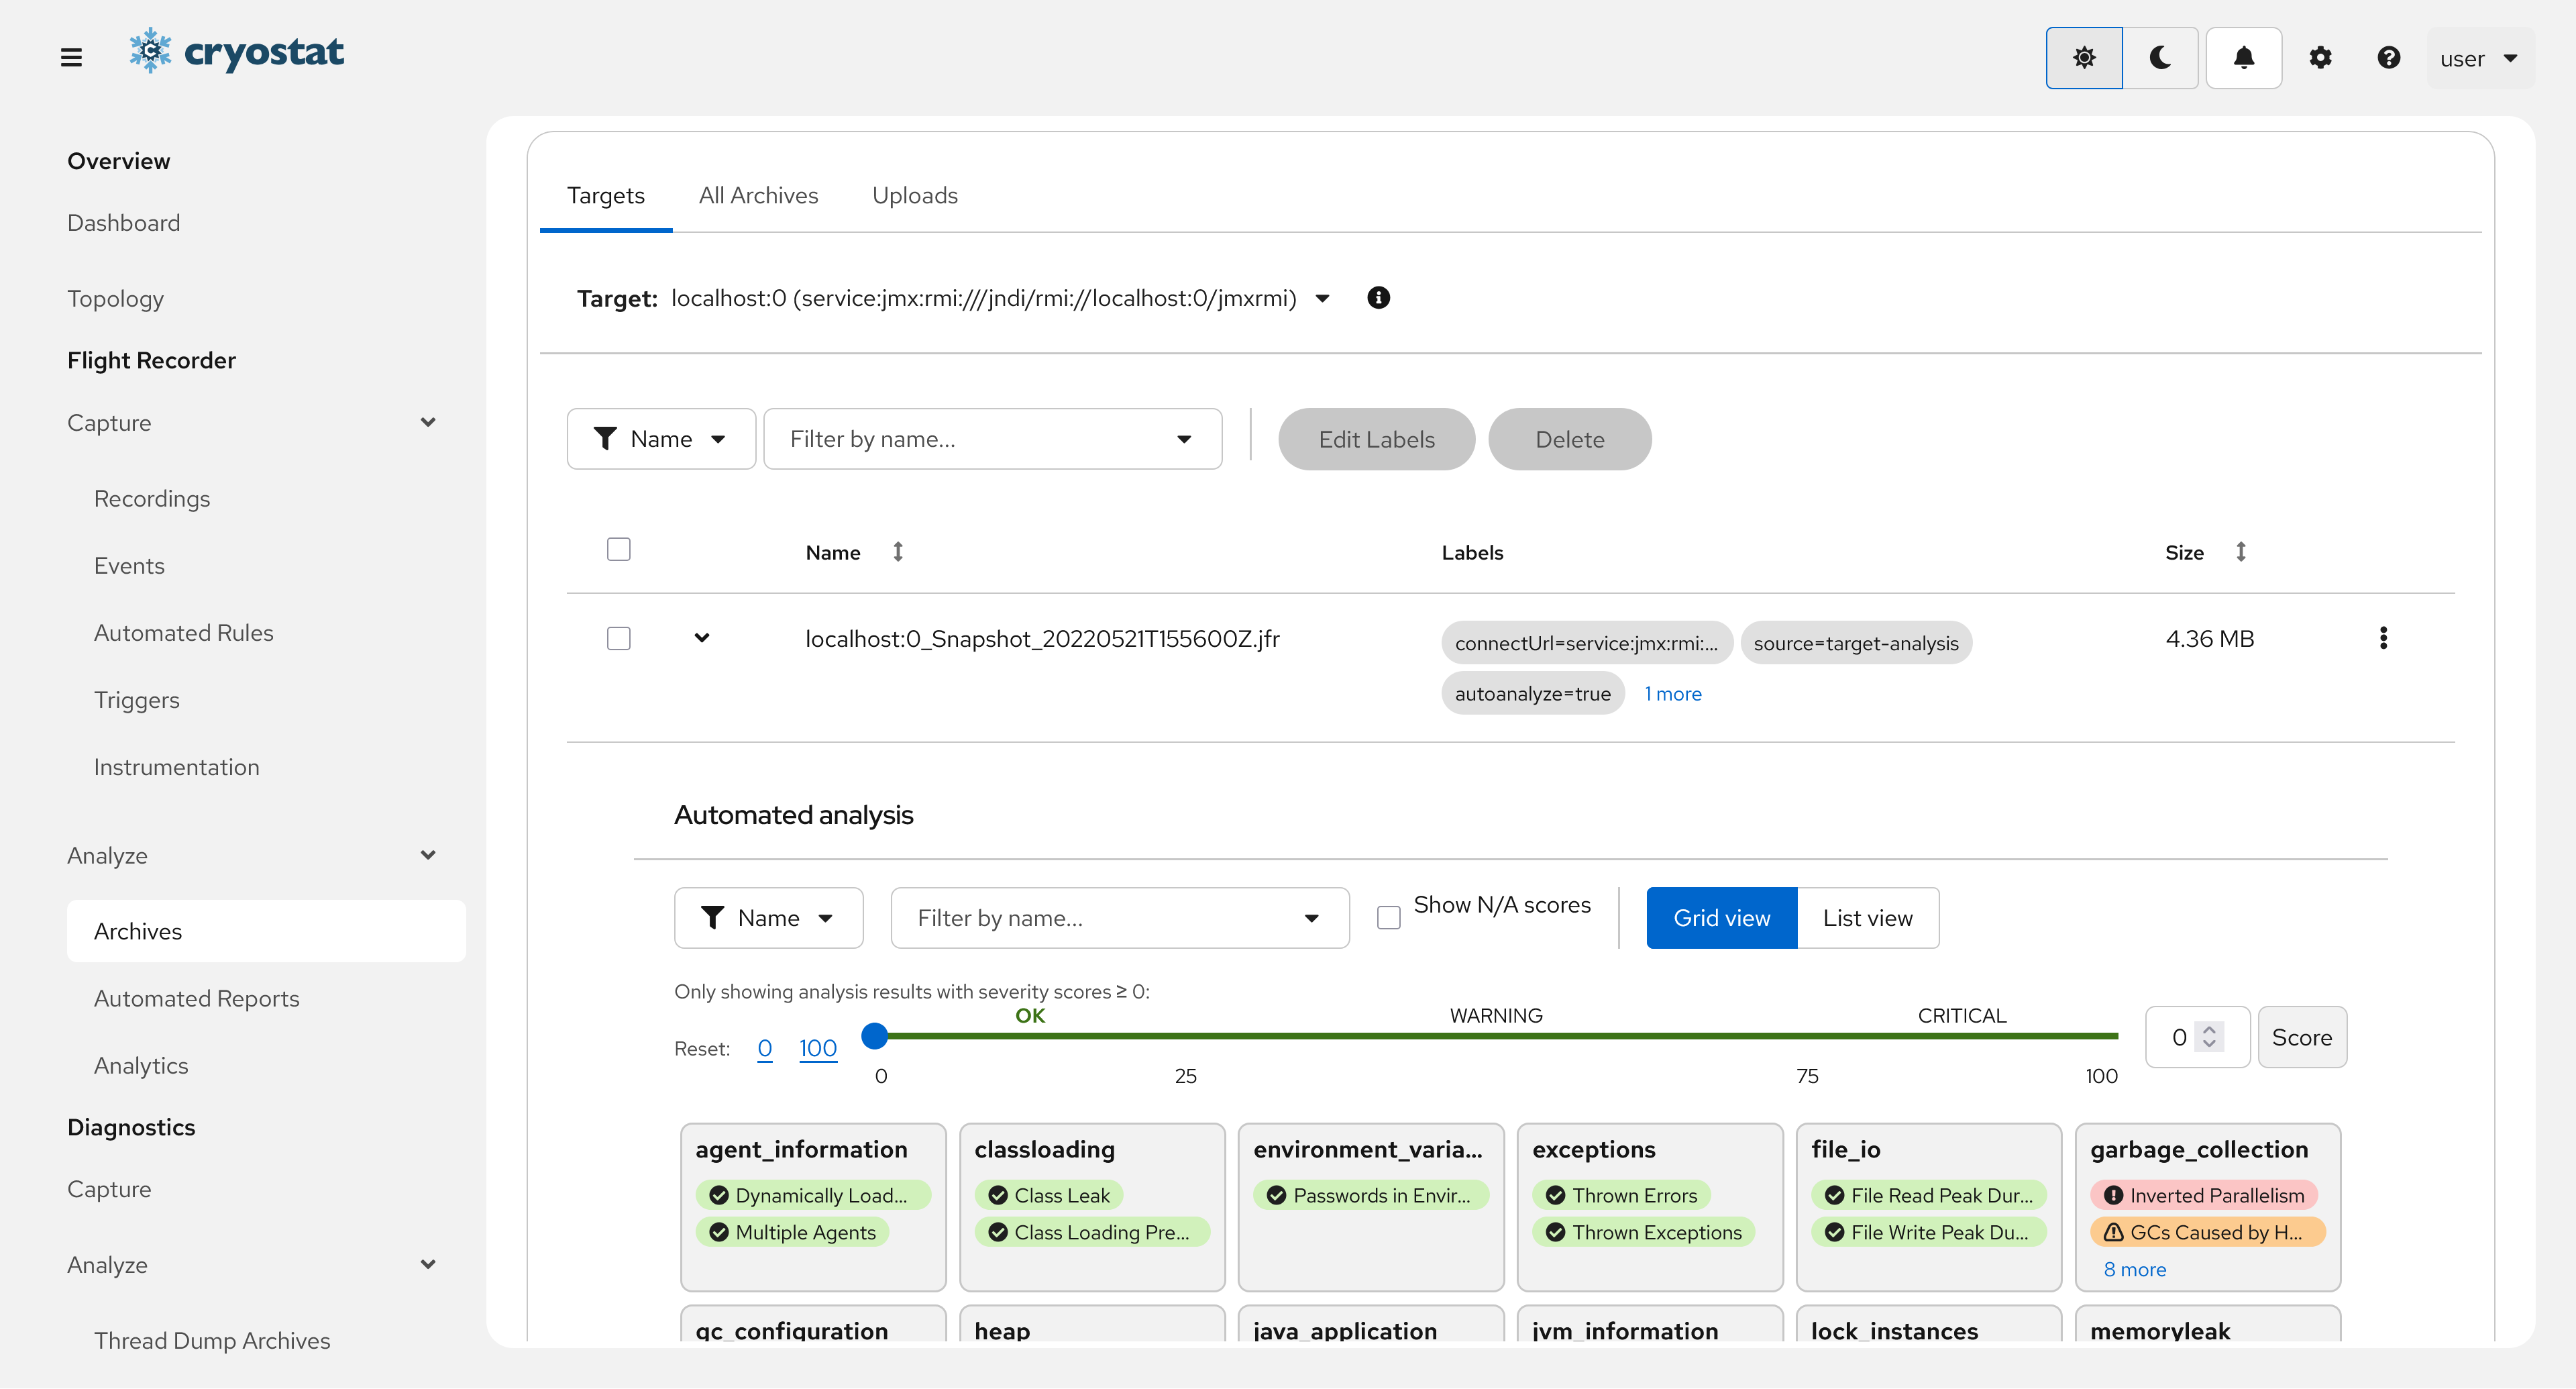
View analysis of an archived recording
Automated analysis results for individual Archived Recordings are also available.
Follow the Archived Recordings
guide to find an Archived Recording you are interested in. Click the chevron icon
beside a recording item to expand the row and view analysis results.
Users can attach Metadata or Custom Labels to JDKFlight Recordings managed by Cryostat. Recording Labels can be used to identify Recordings during queries or perform actions on multiple Recordings containing the same Labels. Here’s how to Add and EditMetadata Labels on your JDKFlight Recordings.
Navigate to Flight Recorder/Capture/Recordings
Supply JMX credentials to authenticate to the target, if necessary. If
the target is not configured with JMX authentication then the
connection attempt will continue without prompting for credentials.
If the targetJVM has SSL/TLS enabled on JMX connections, it may be
necessary to add the target's certificate to Cryostat's trust store. Go
to Add a Trusted Certificate
and return to this section after completing that guide.
Click Create
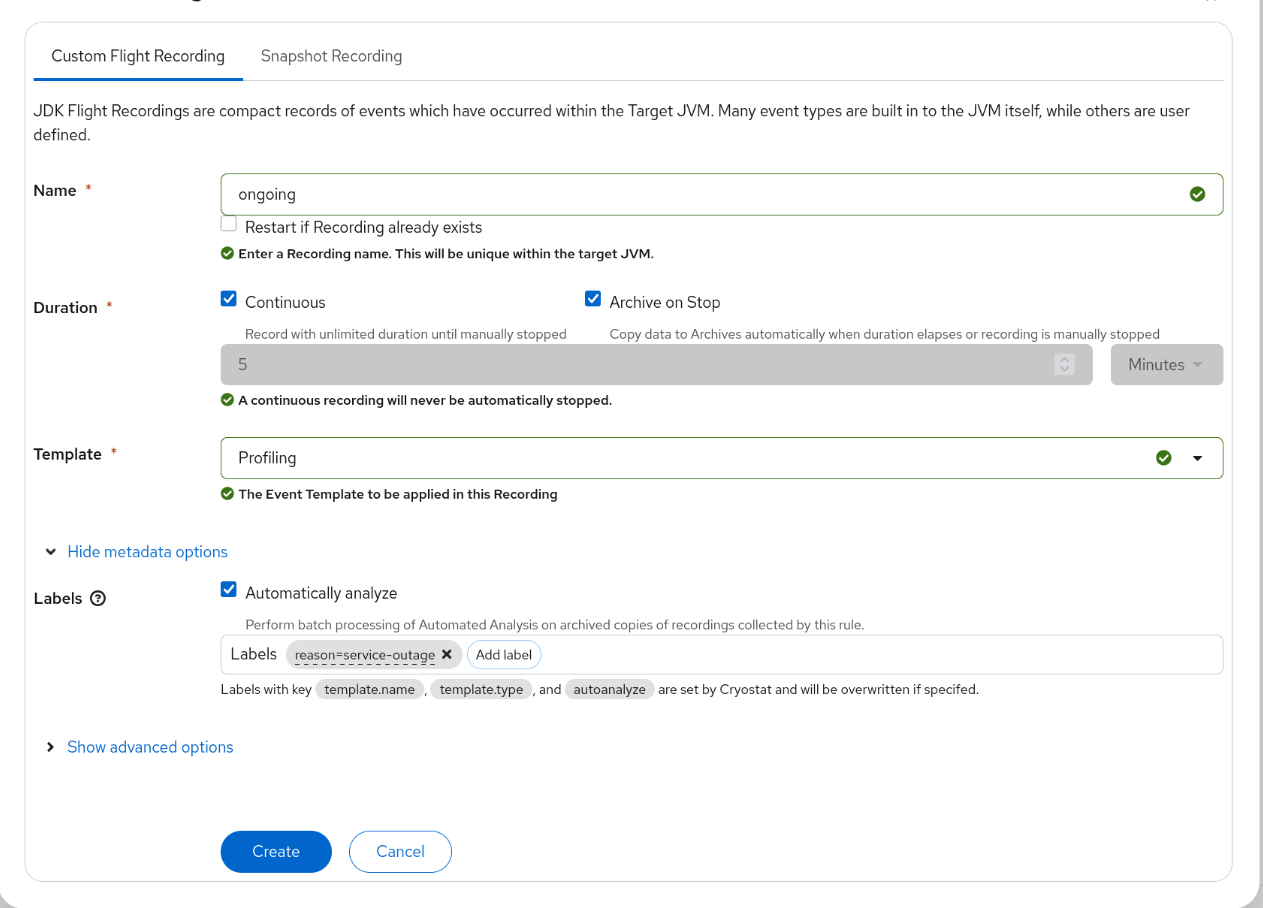
Add Metadata Labels to the Create Recording form
When creating a custom Flight Recording with Cryostat, expand the form section Show metadata options. Click Add Label and add key-ValueLabel pairs to the form. Finally, click Create to attach the Labels and create the Recording.
View your Labels on the Active Recordings Table
The new Recording will appear in the Recordings Tab with your Custom Label as well as default Labels containing information about the selected Recording template.
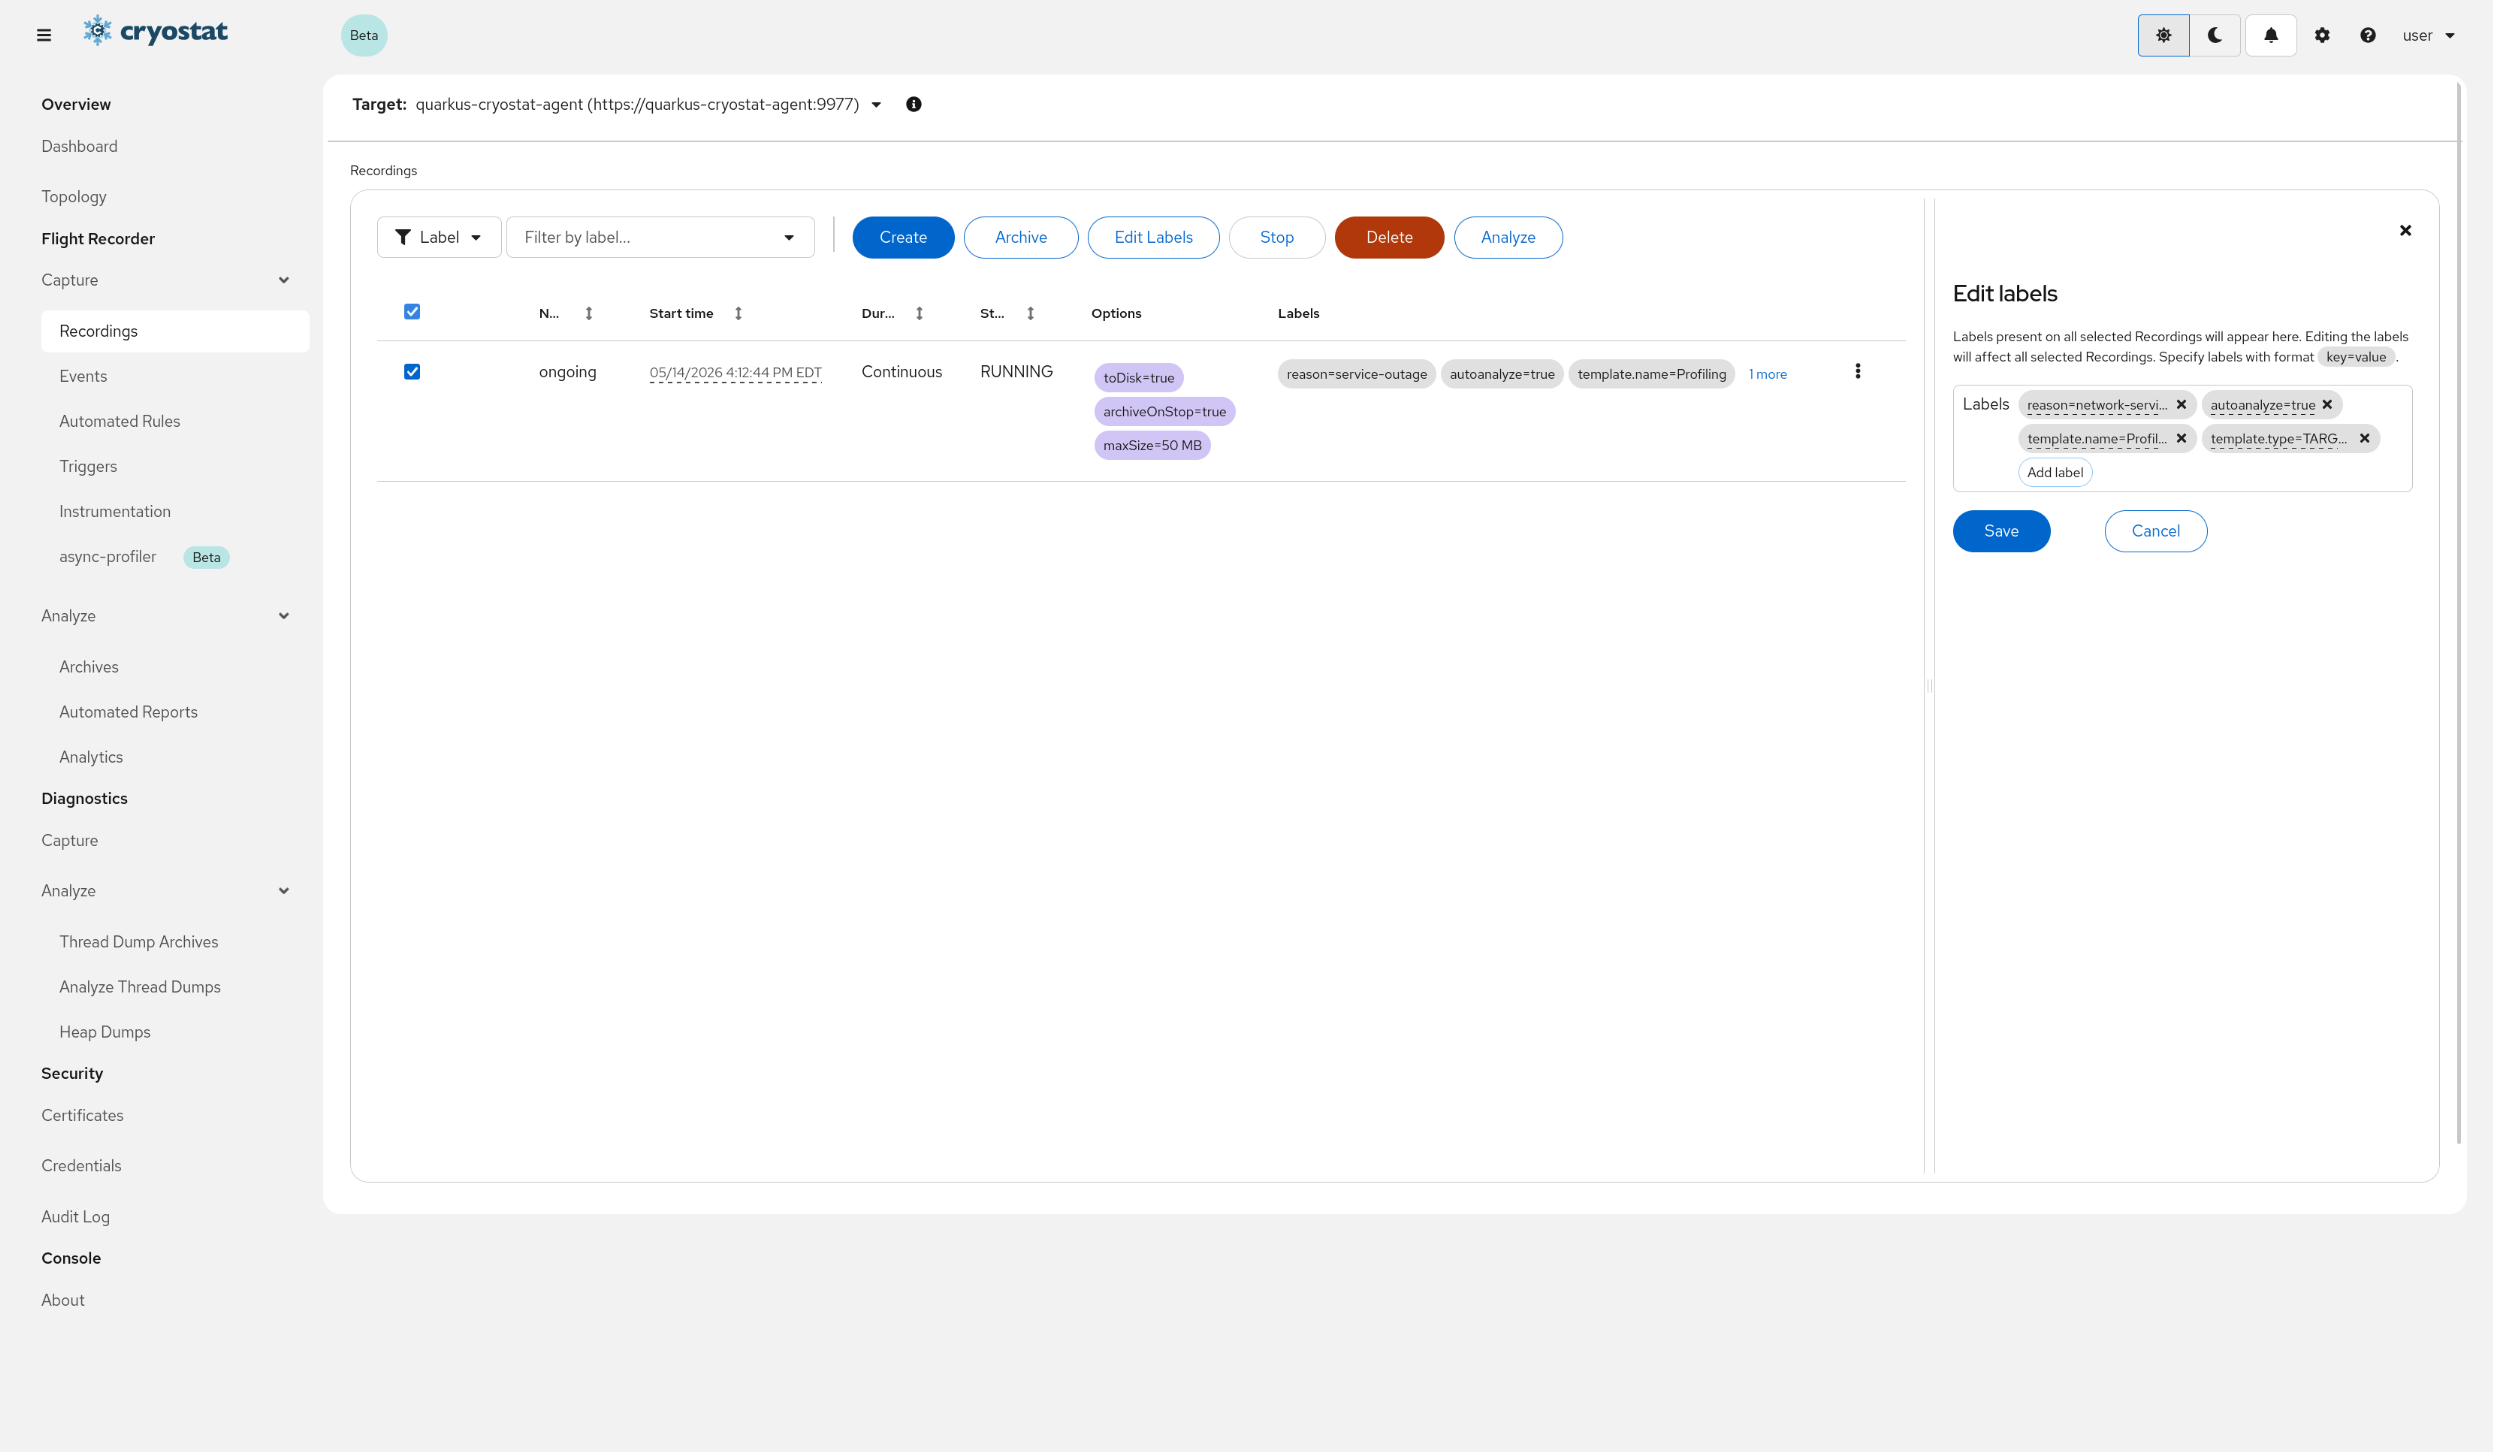
Edit an Existing Label
Recording Labels can also be edited after Recordings have been created or re-uploaded to archives. It looks like the Custom Label in our example contains a typo - we can fix the typo by editing the Label. First select a Recording from the table with the 🗹 checkbox. Then, click the Edit Labels button to bring up the label drawer. Finally, edit the label content and click Save.
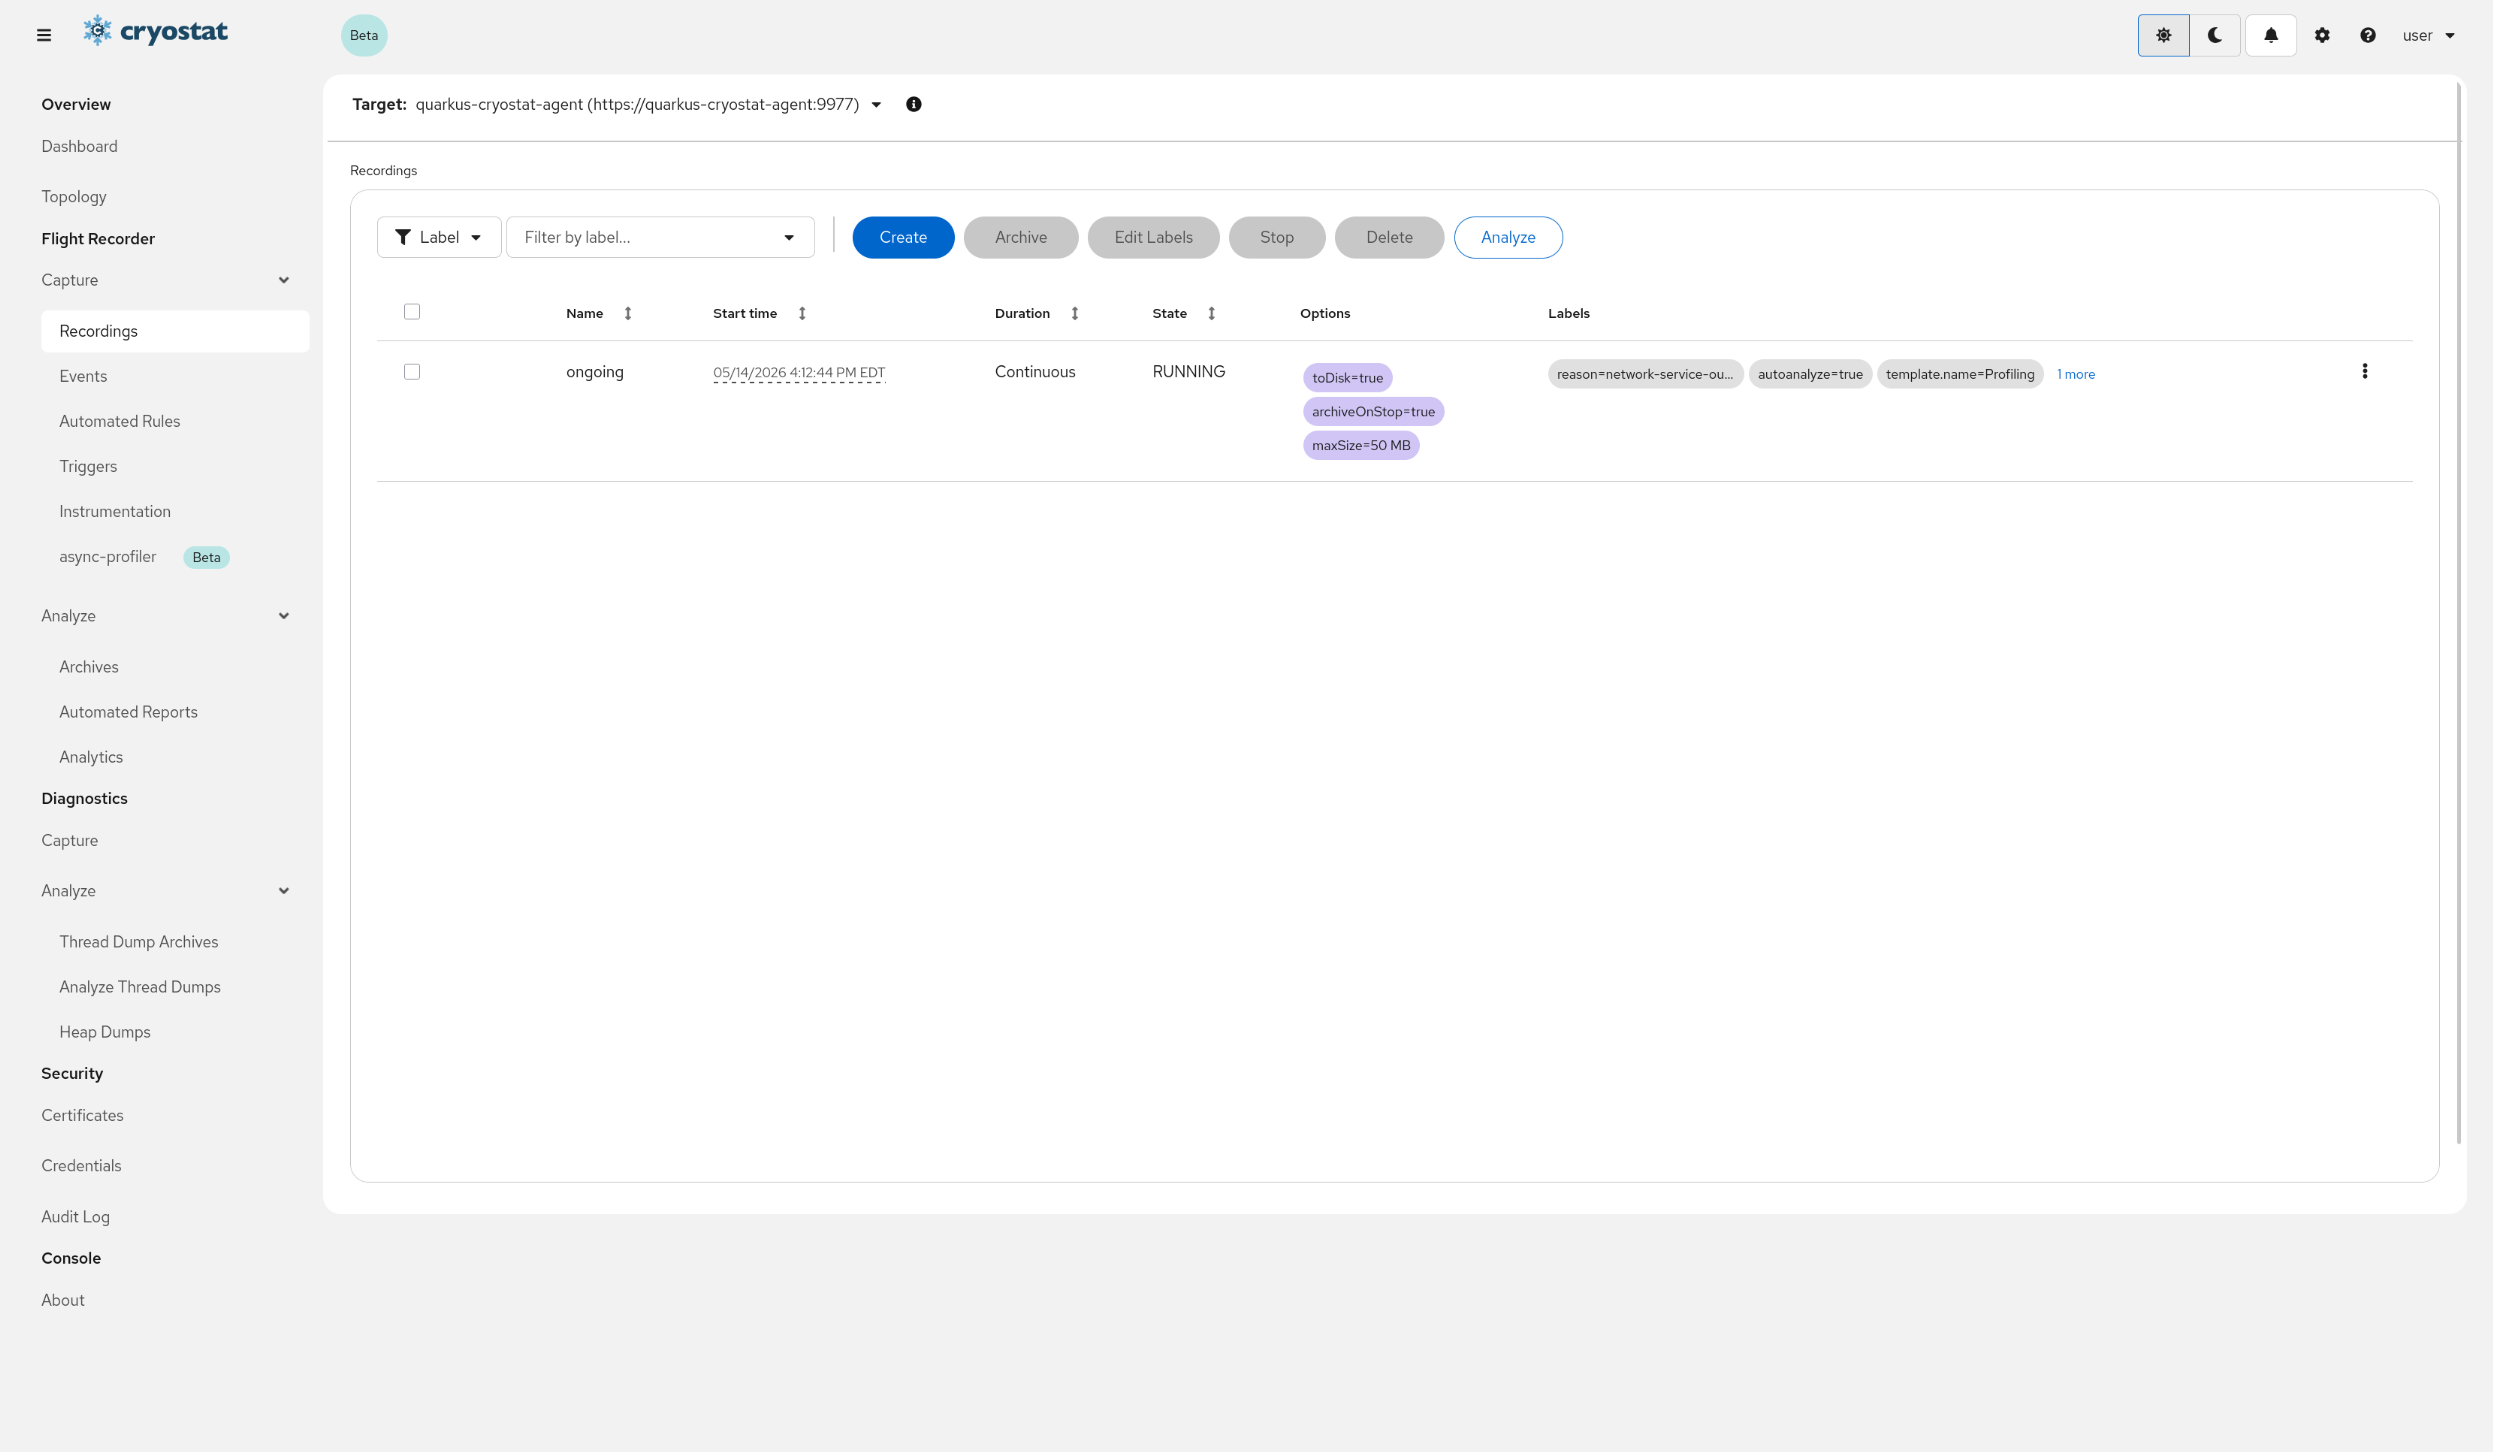
View your edited Labels
The Recording Labels should be updated in the Active Recordings table.
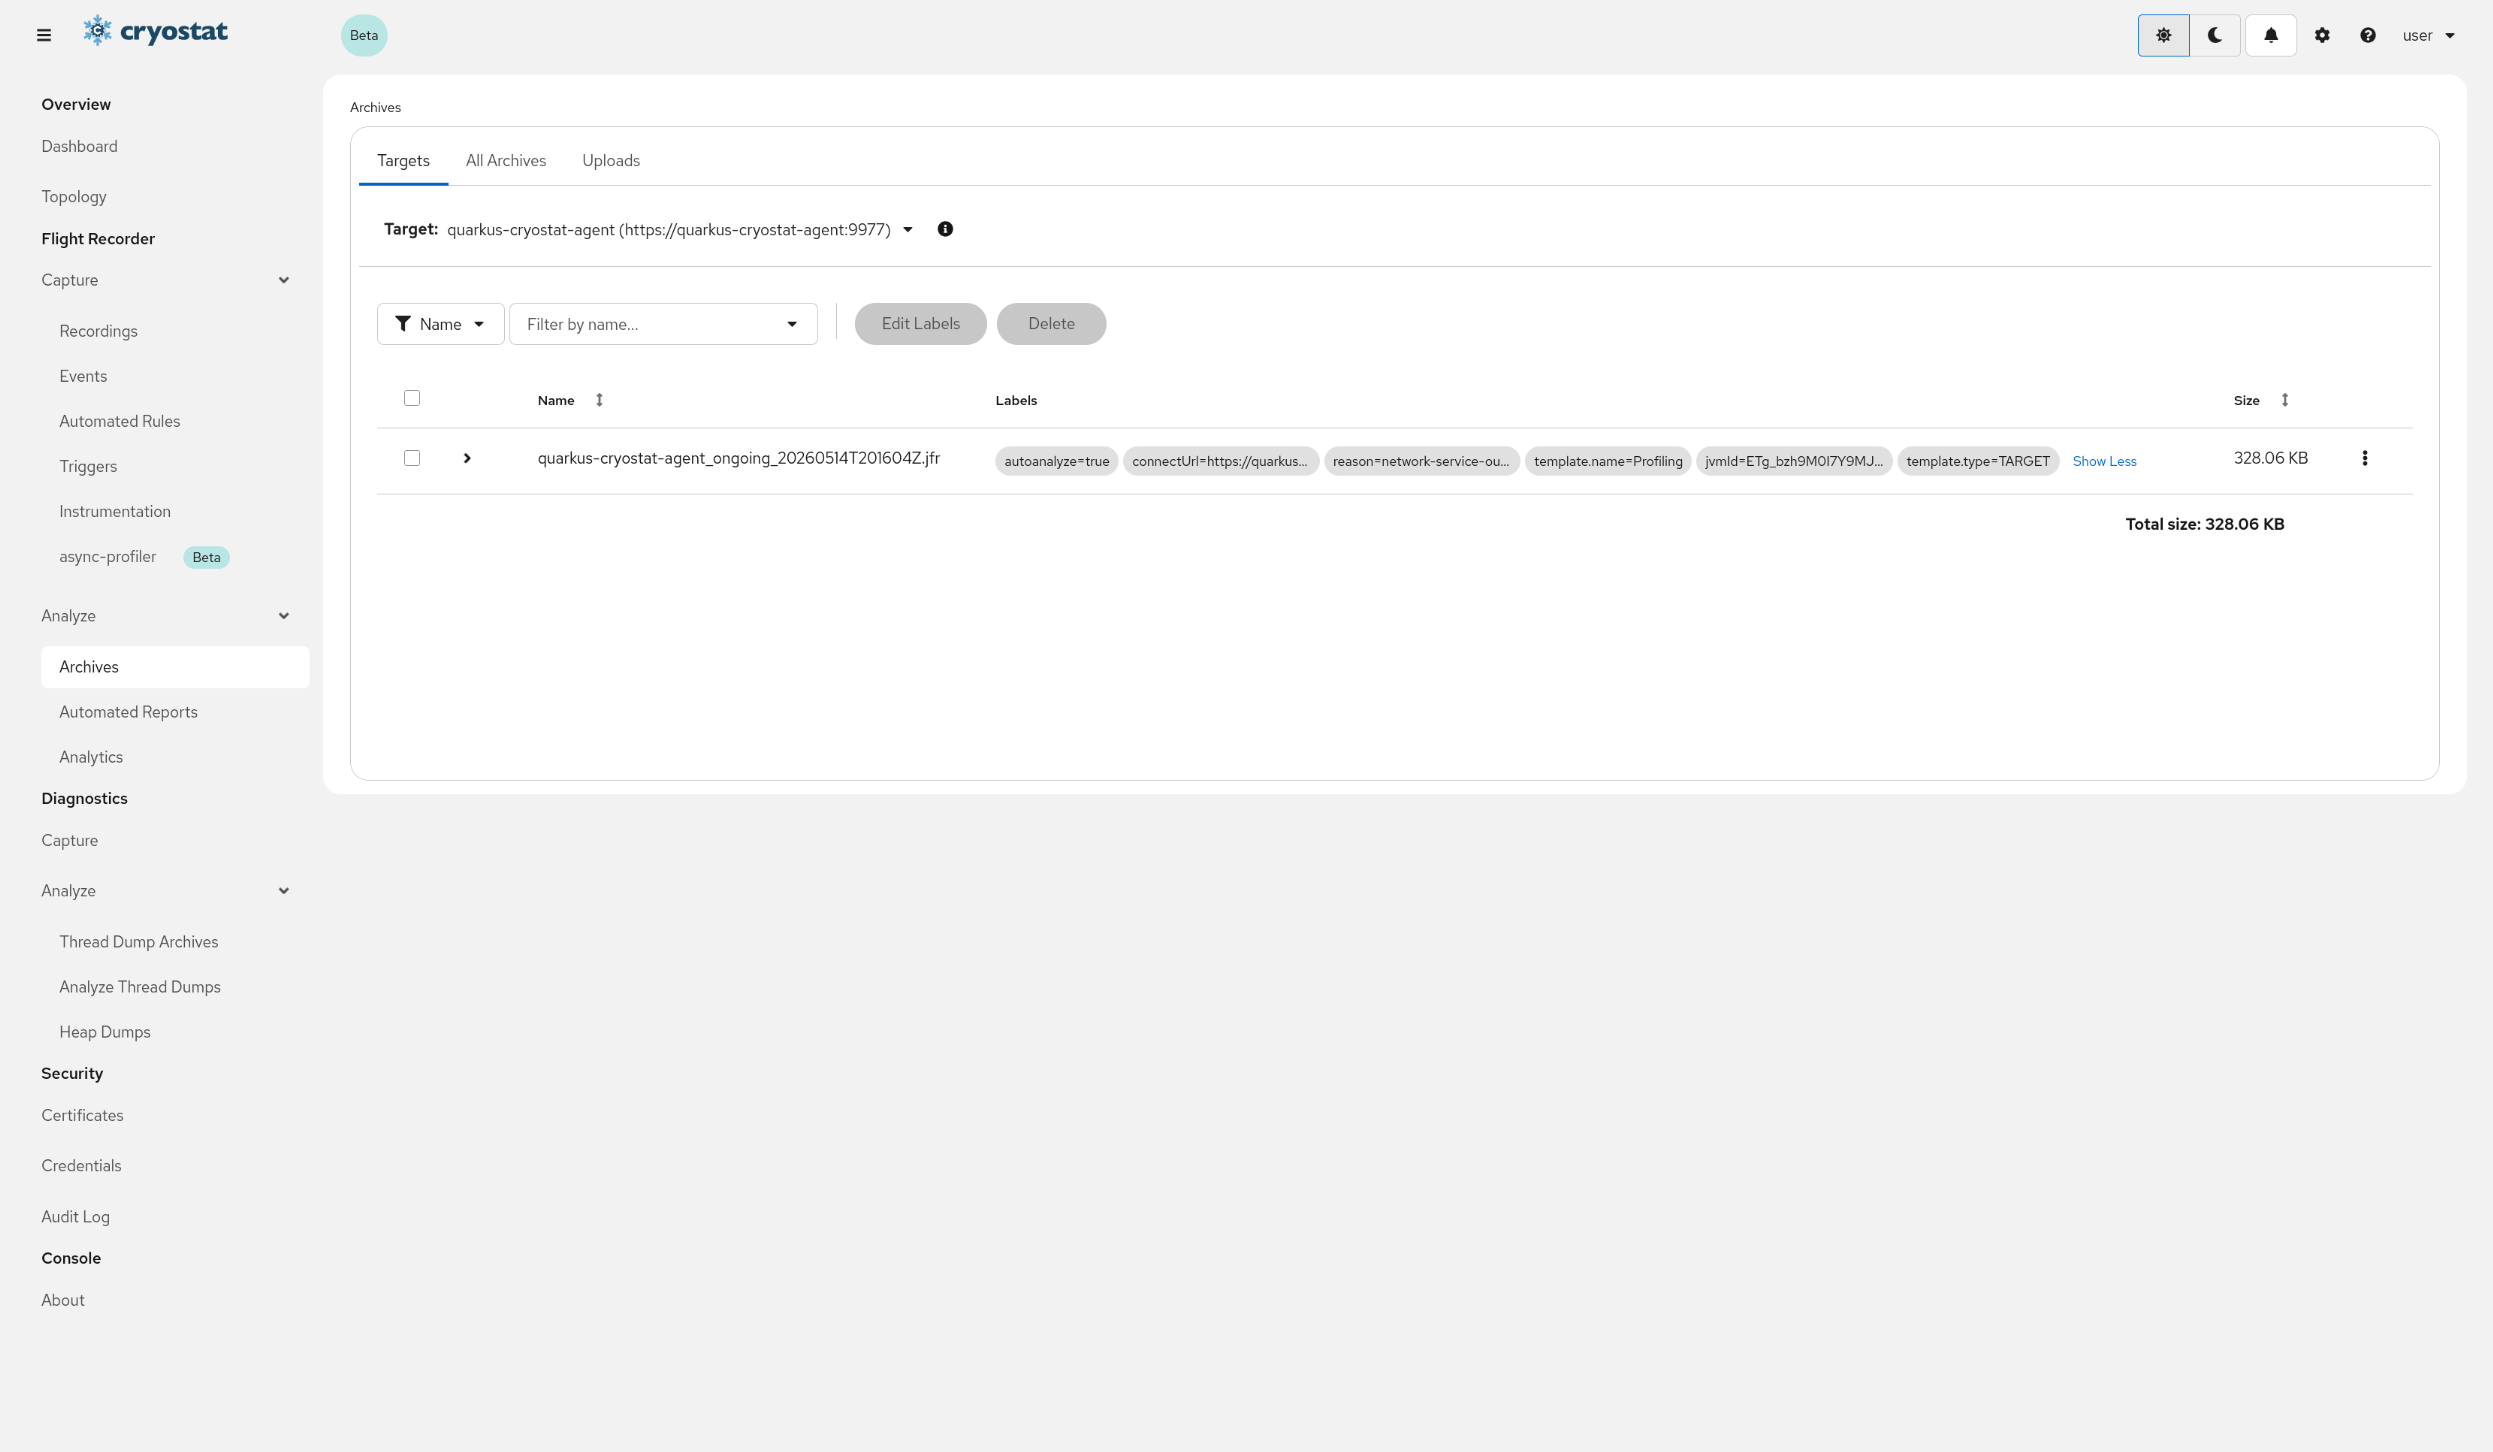
(Optional) Archive your Recording to view Labels copied onto the Archived Recording
On the Active Recordings table, click the Checkbox next to the Recording, then click Archive to archive your Recording. Notice that the Archived Recording also copies the Labels from the Active Recording. You can also add Labels to any Recording uploaded to Cryostat’s archives.
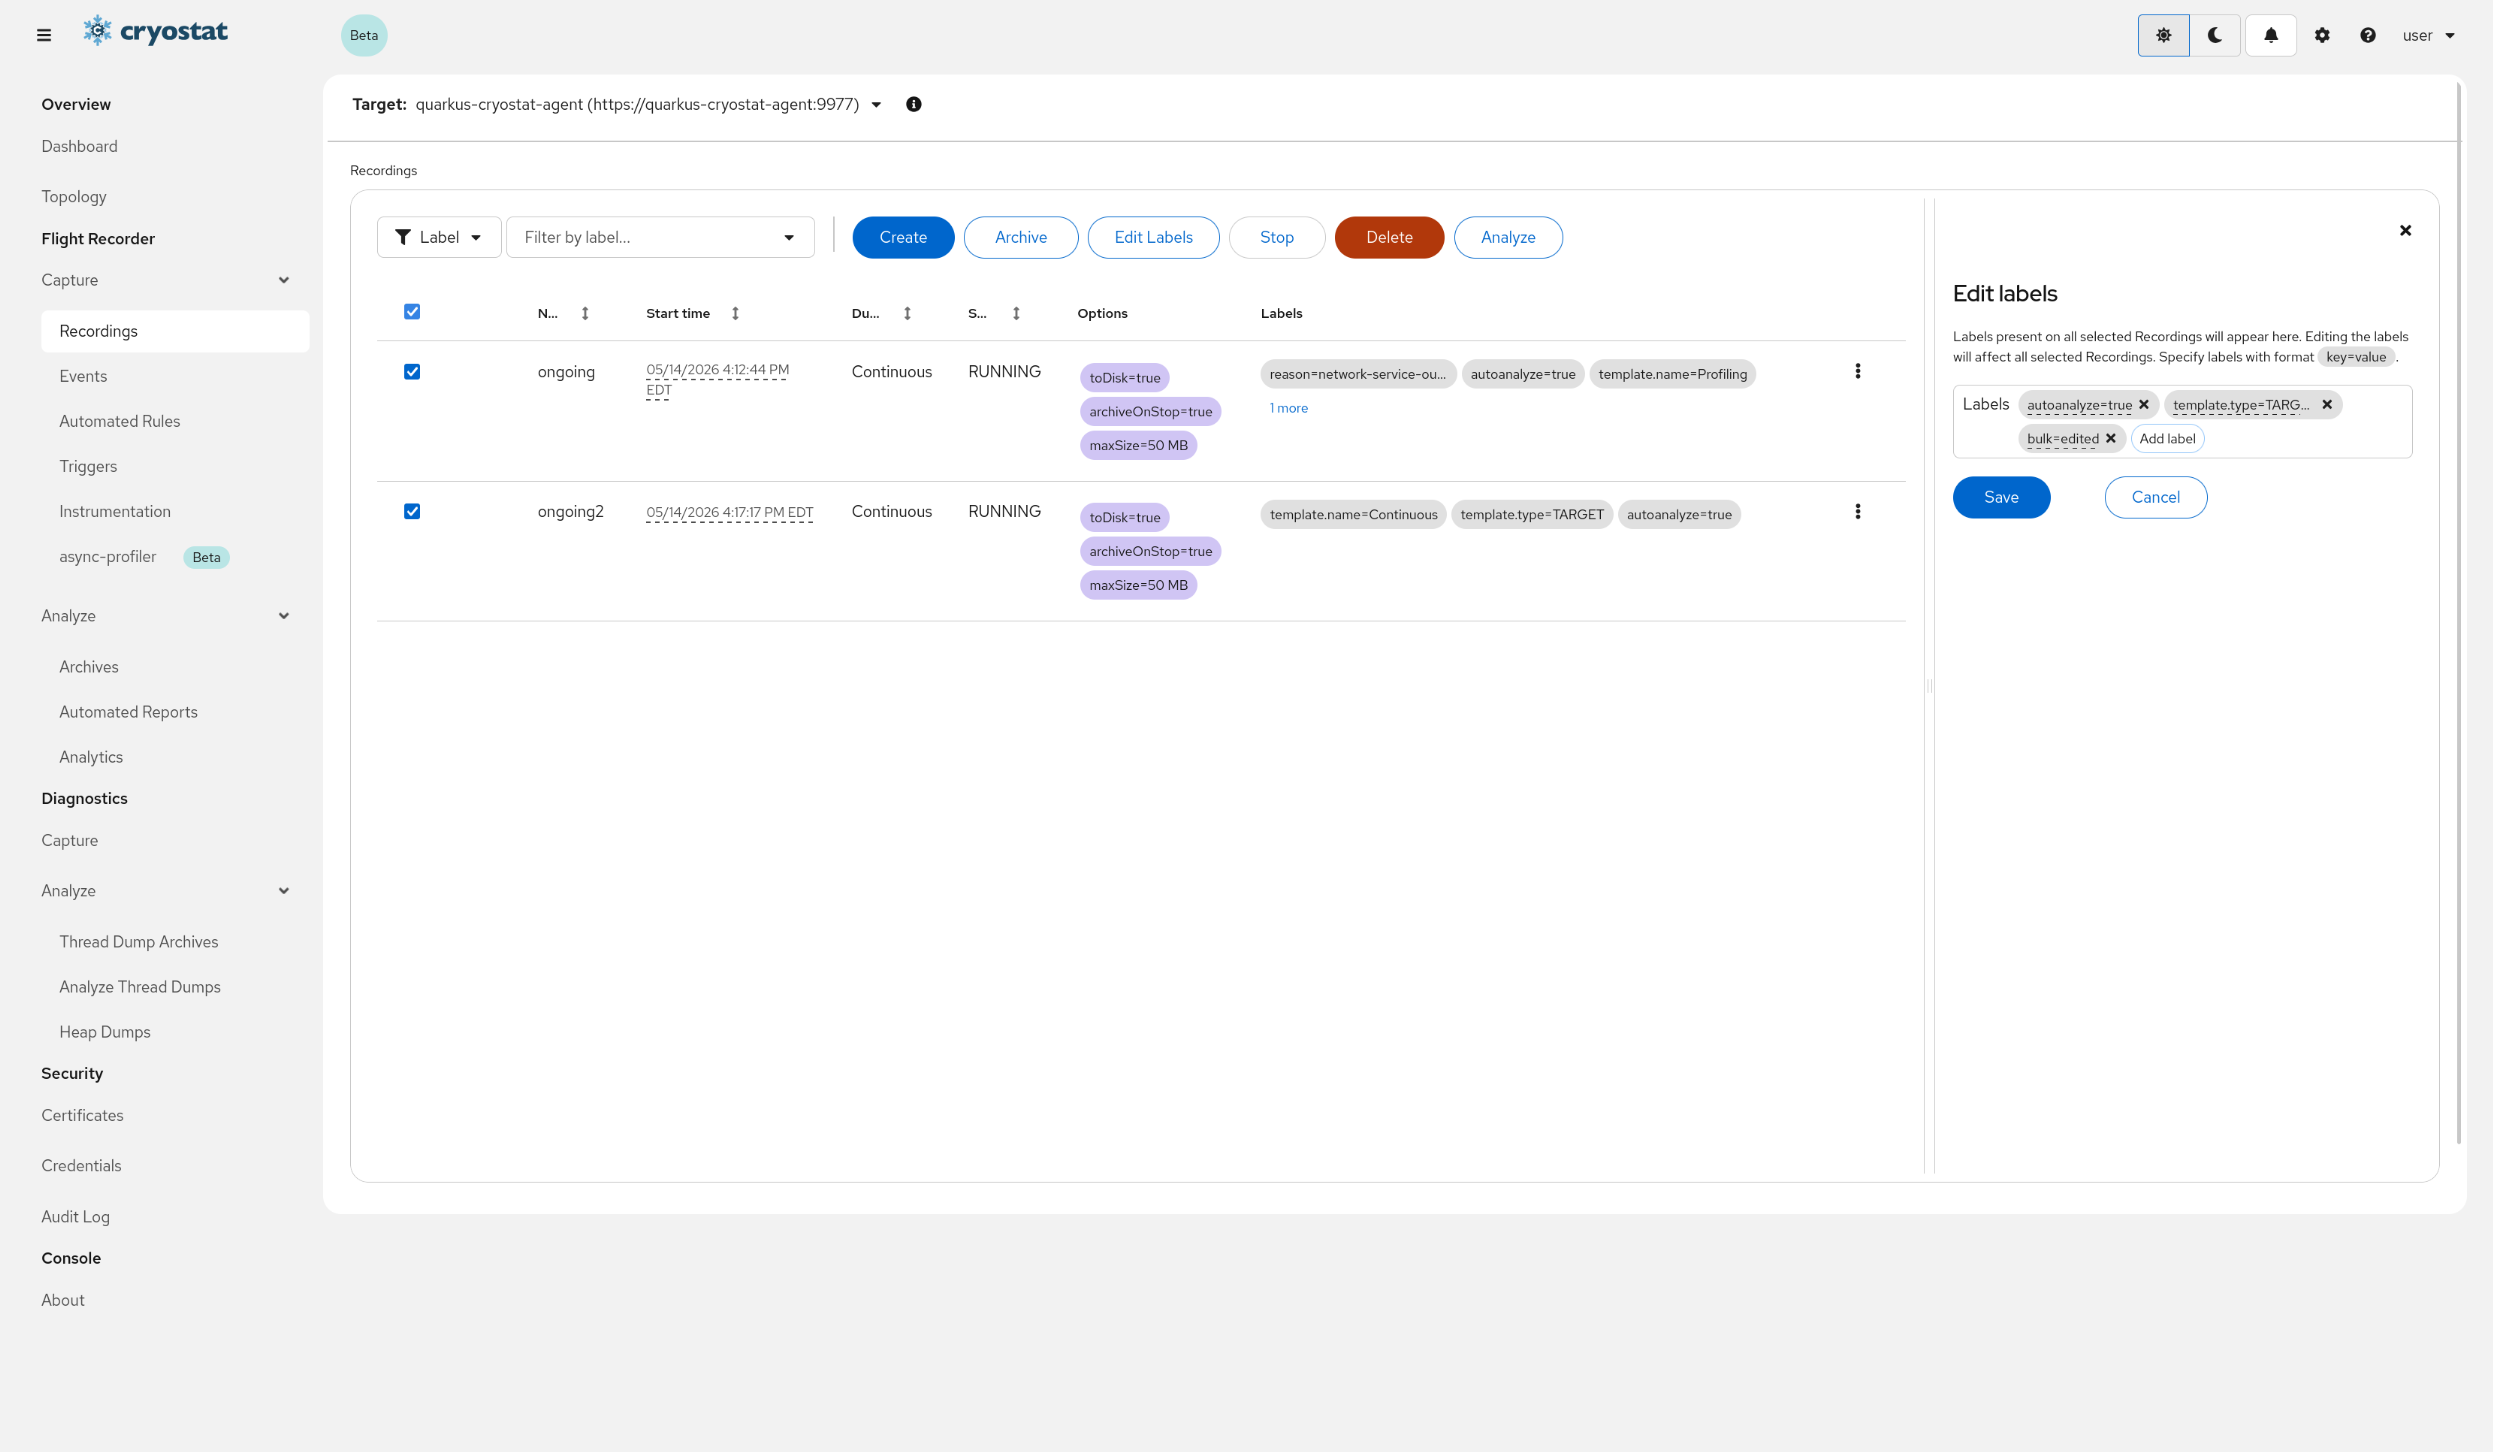
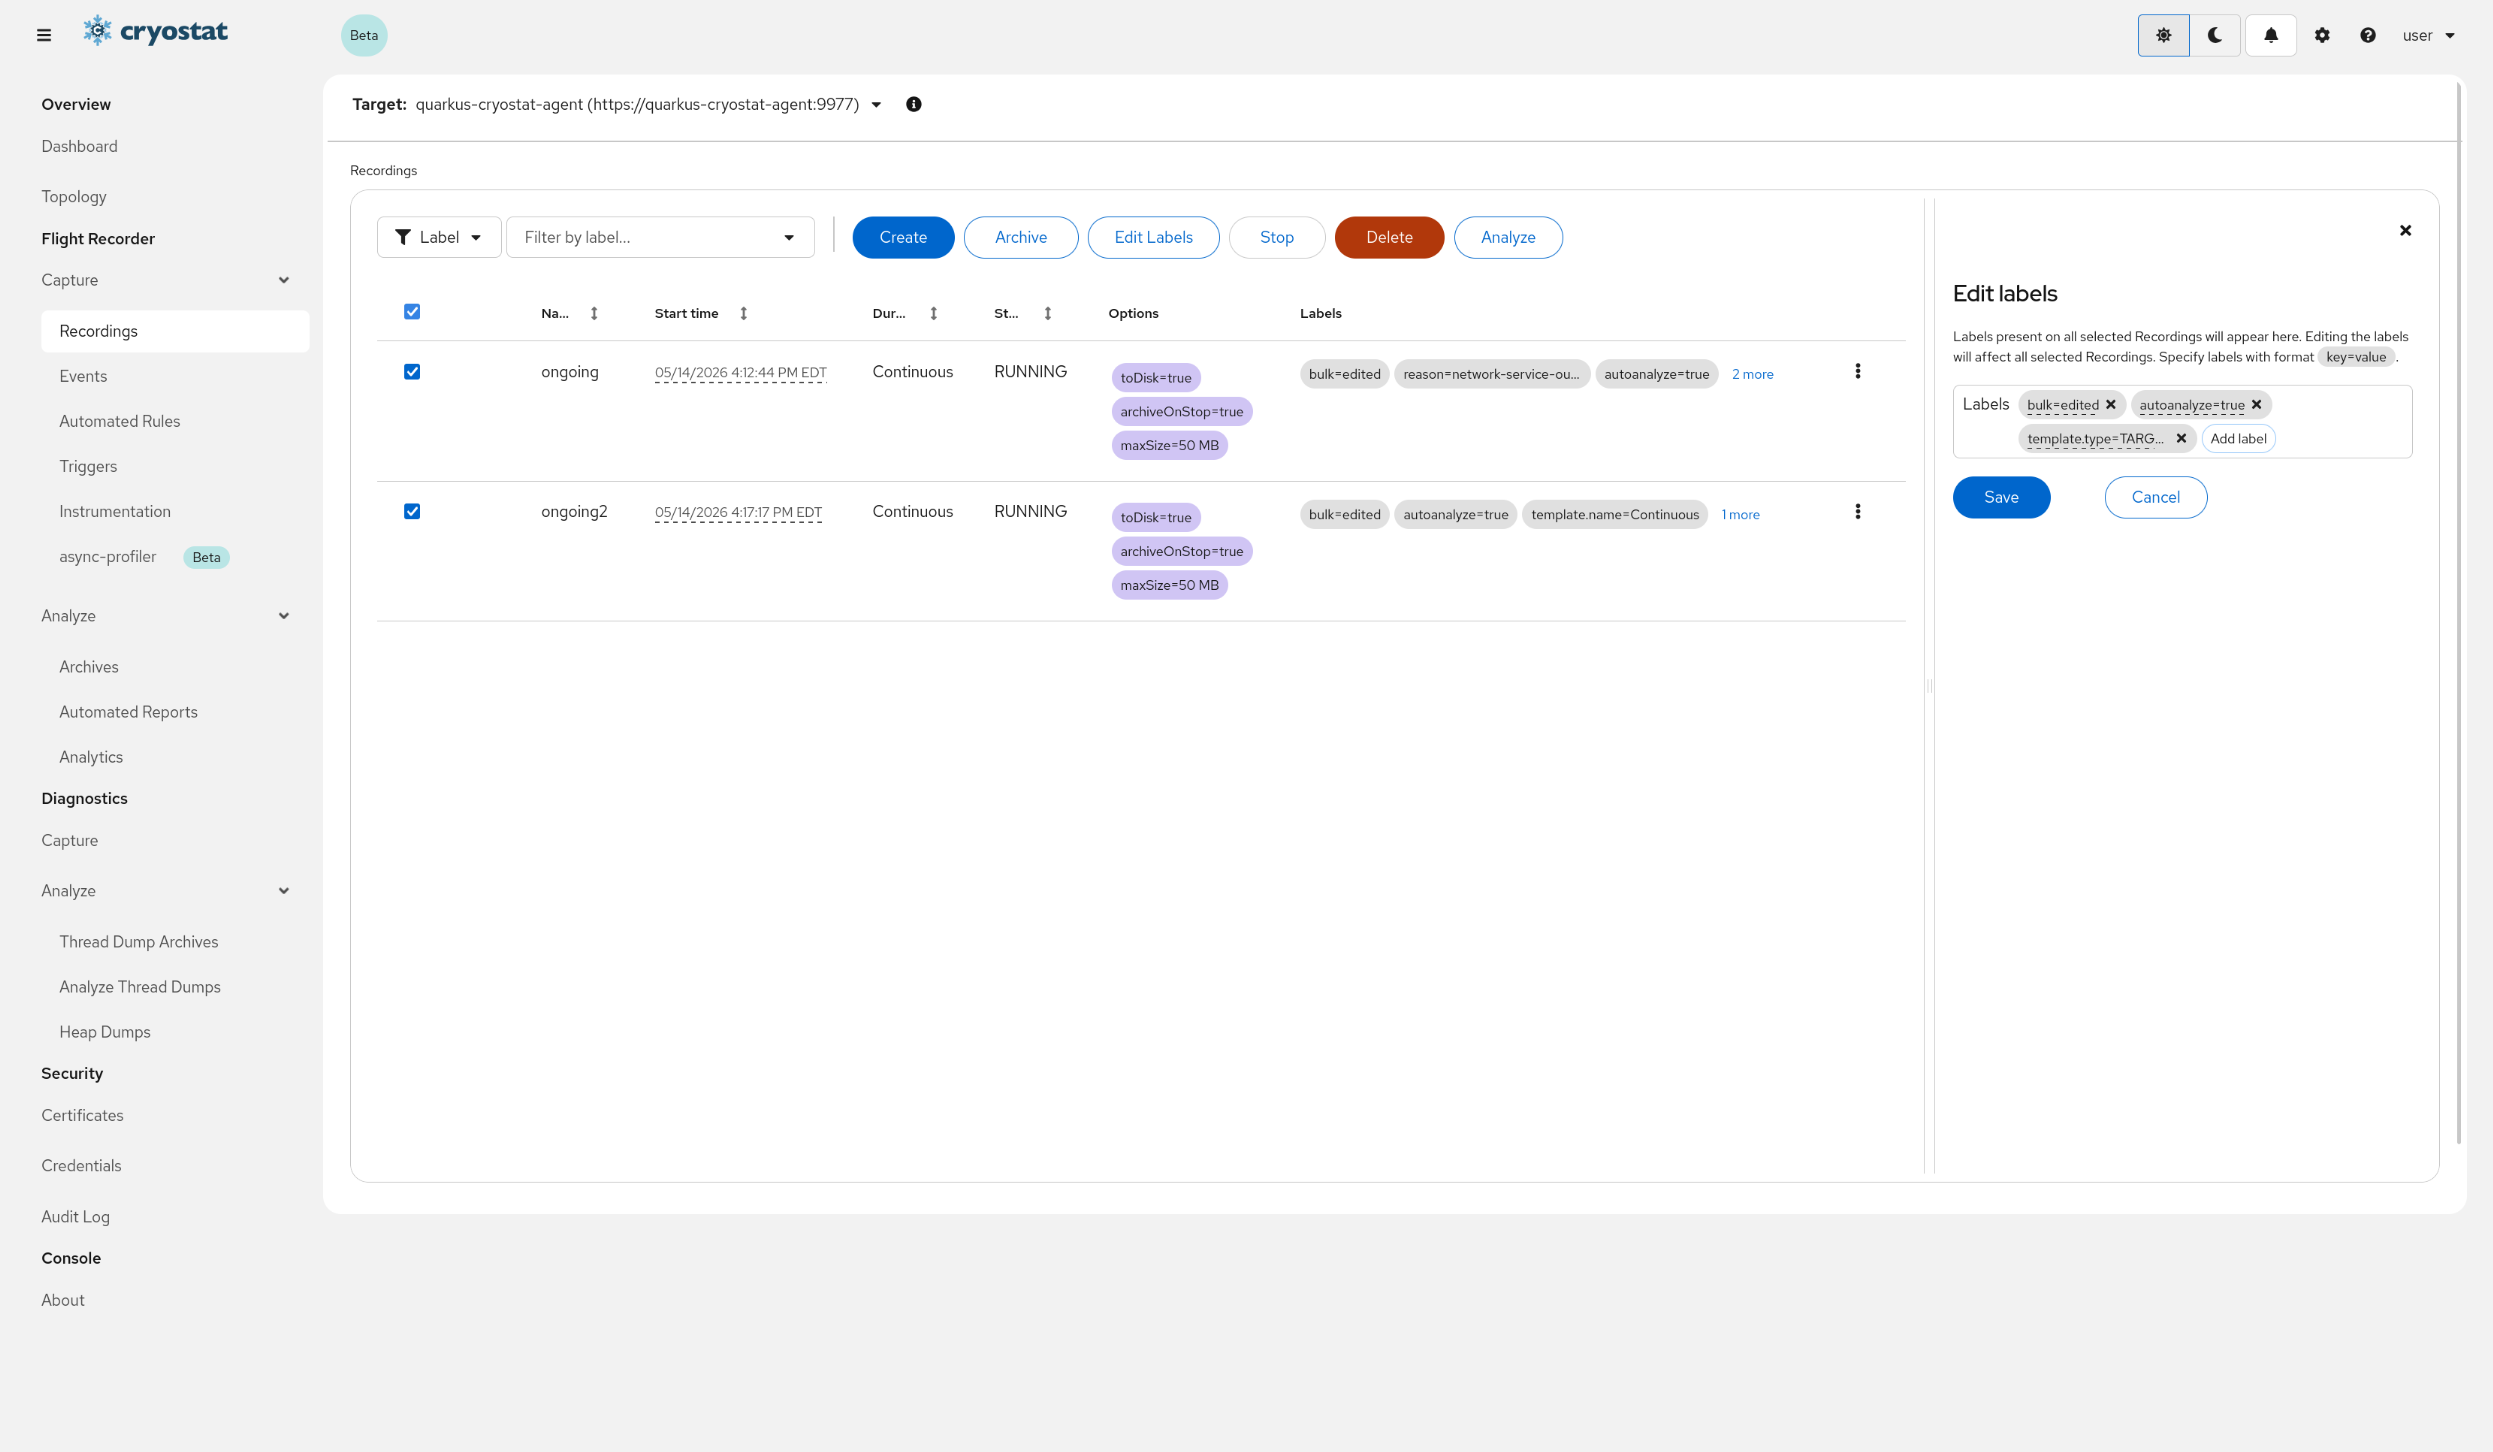
(Optional) Bulk-edit Recording Labels across multiple Recordings
Create another Recording on the same target. Then select both Recordings on the Recordings Table and click Edit Labels and start editing. This time, only Labels that are present on both Recordings will be shown in the form. Let's Delete the two common template-related Labels, and Add a new Label to both Recordings. Then finally, click Save.
Congratulations, you have successfully bulk-edited Labels across multiple Recordings!
If you have Java Management Extensions (JMX) or HTTP authentication enabled on
your containerized JVMs, Cryostat will prompt you to enter your credentials
before it can access the JDKFlight Recordings on your targetJVMs.
Navigate to the Security/Credentials view
First, navigate to the Security/Credentials view. The Store Credentials table
lists all credentials in Cryostat'sKeyring. Click Add to define
a new credential.
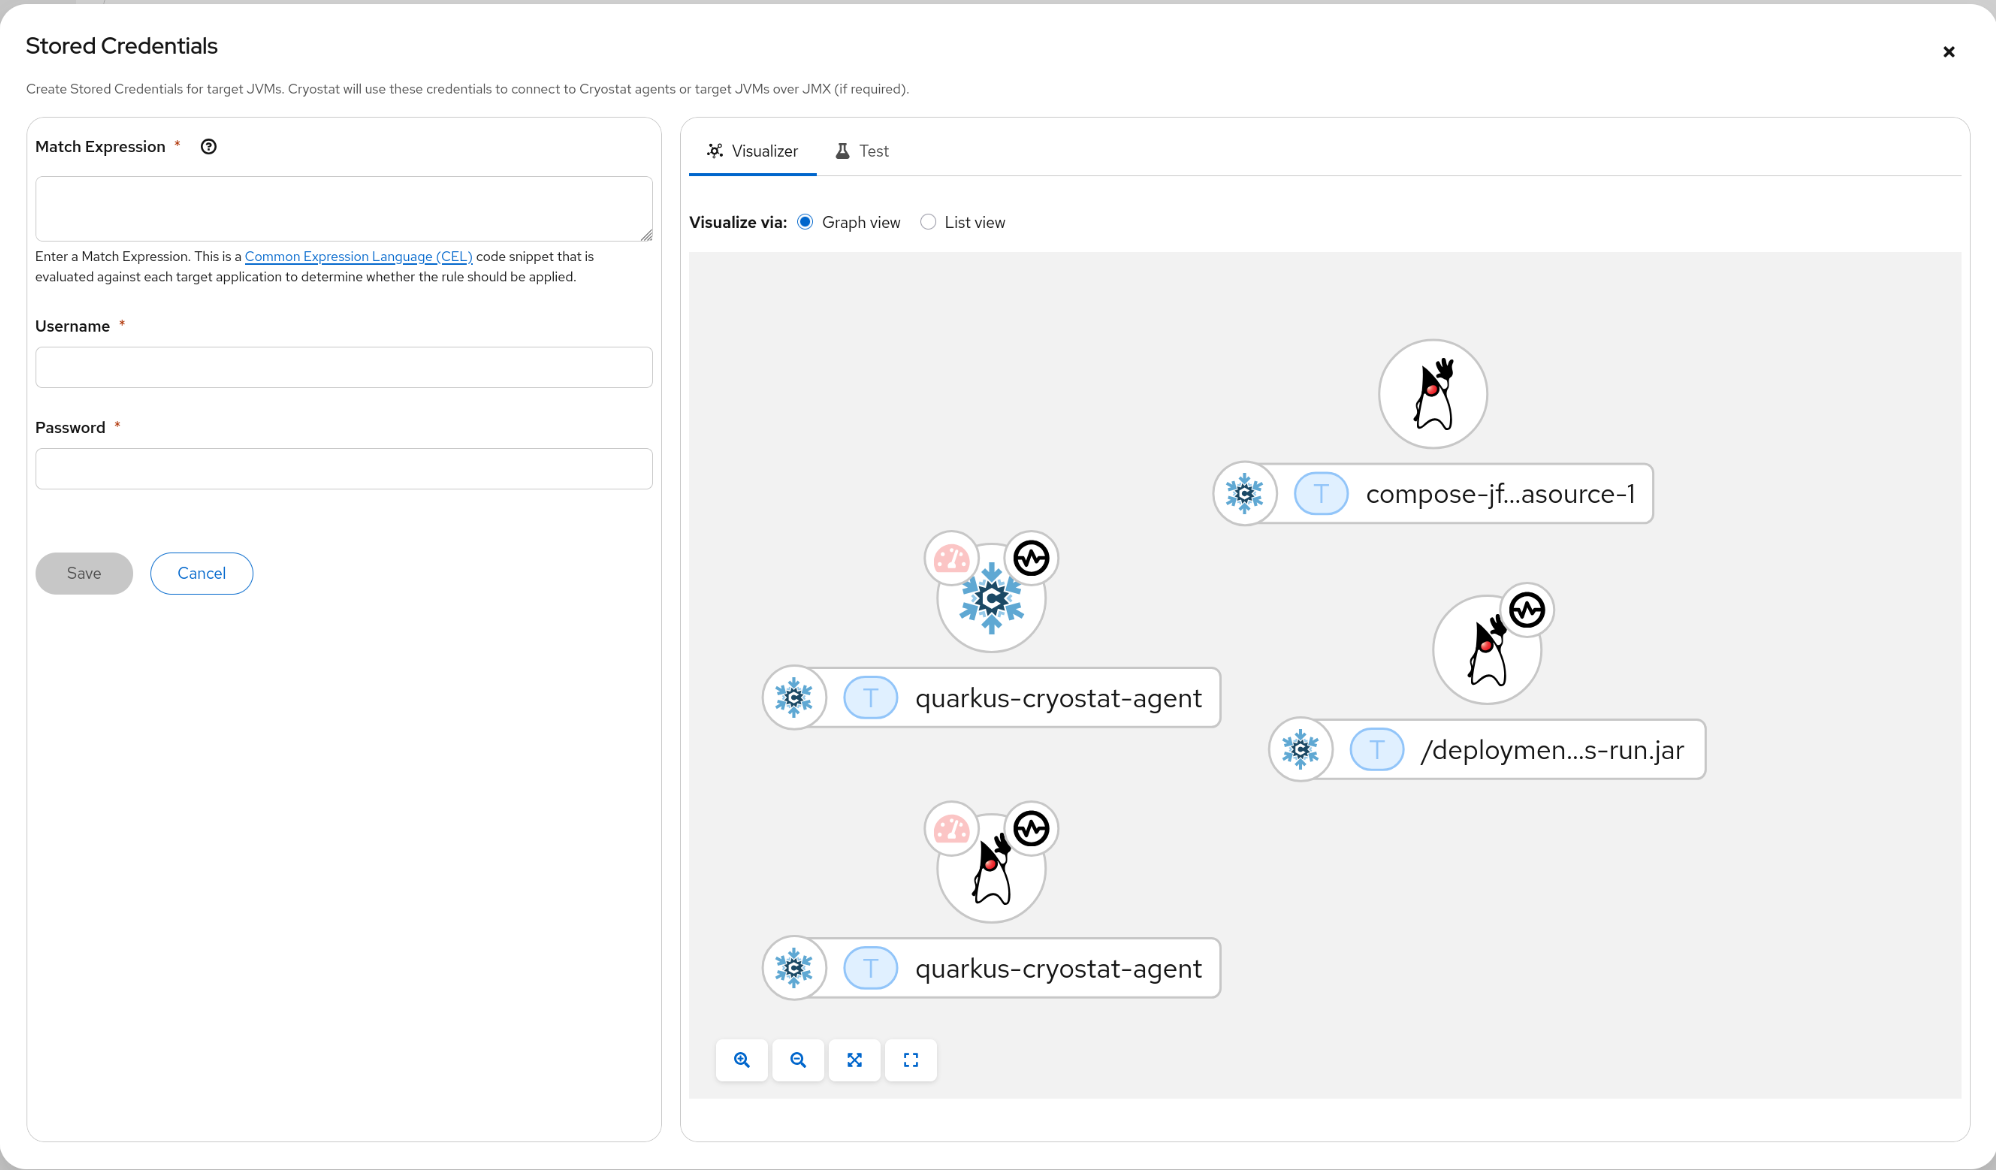
Enter your Credentials
A modal will appear. You can select a targetJVM to view its
properties.
These properties can be used to define a matchExpression that
tests whether this credential should apply to the selected targetJVM.
This is the same kind of matchExpression as those used by
Automated Rules, so you may
find it useful to reuse the same matchExpressions from your
rule definitions for your credential definitions. The
matchExpression, username, and password fields are all required.
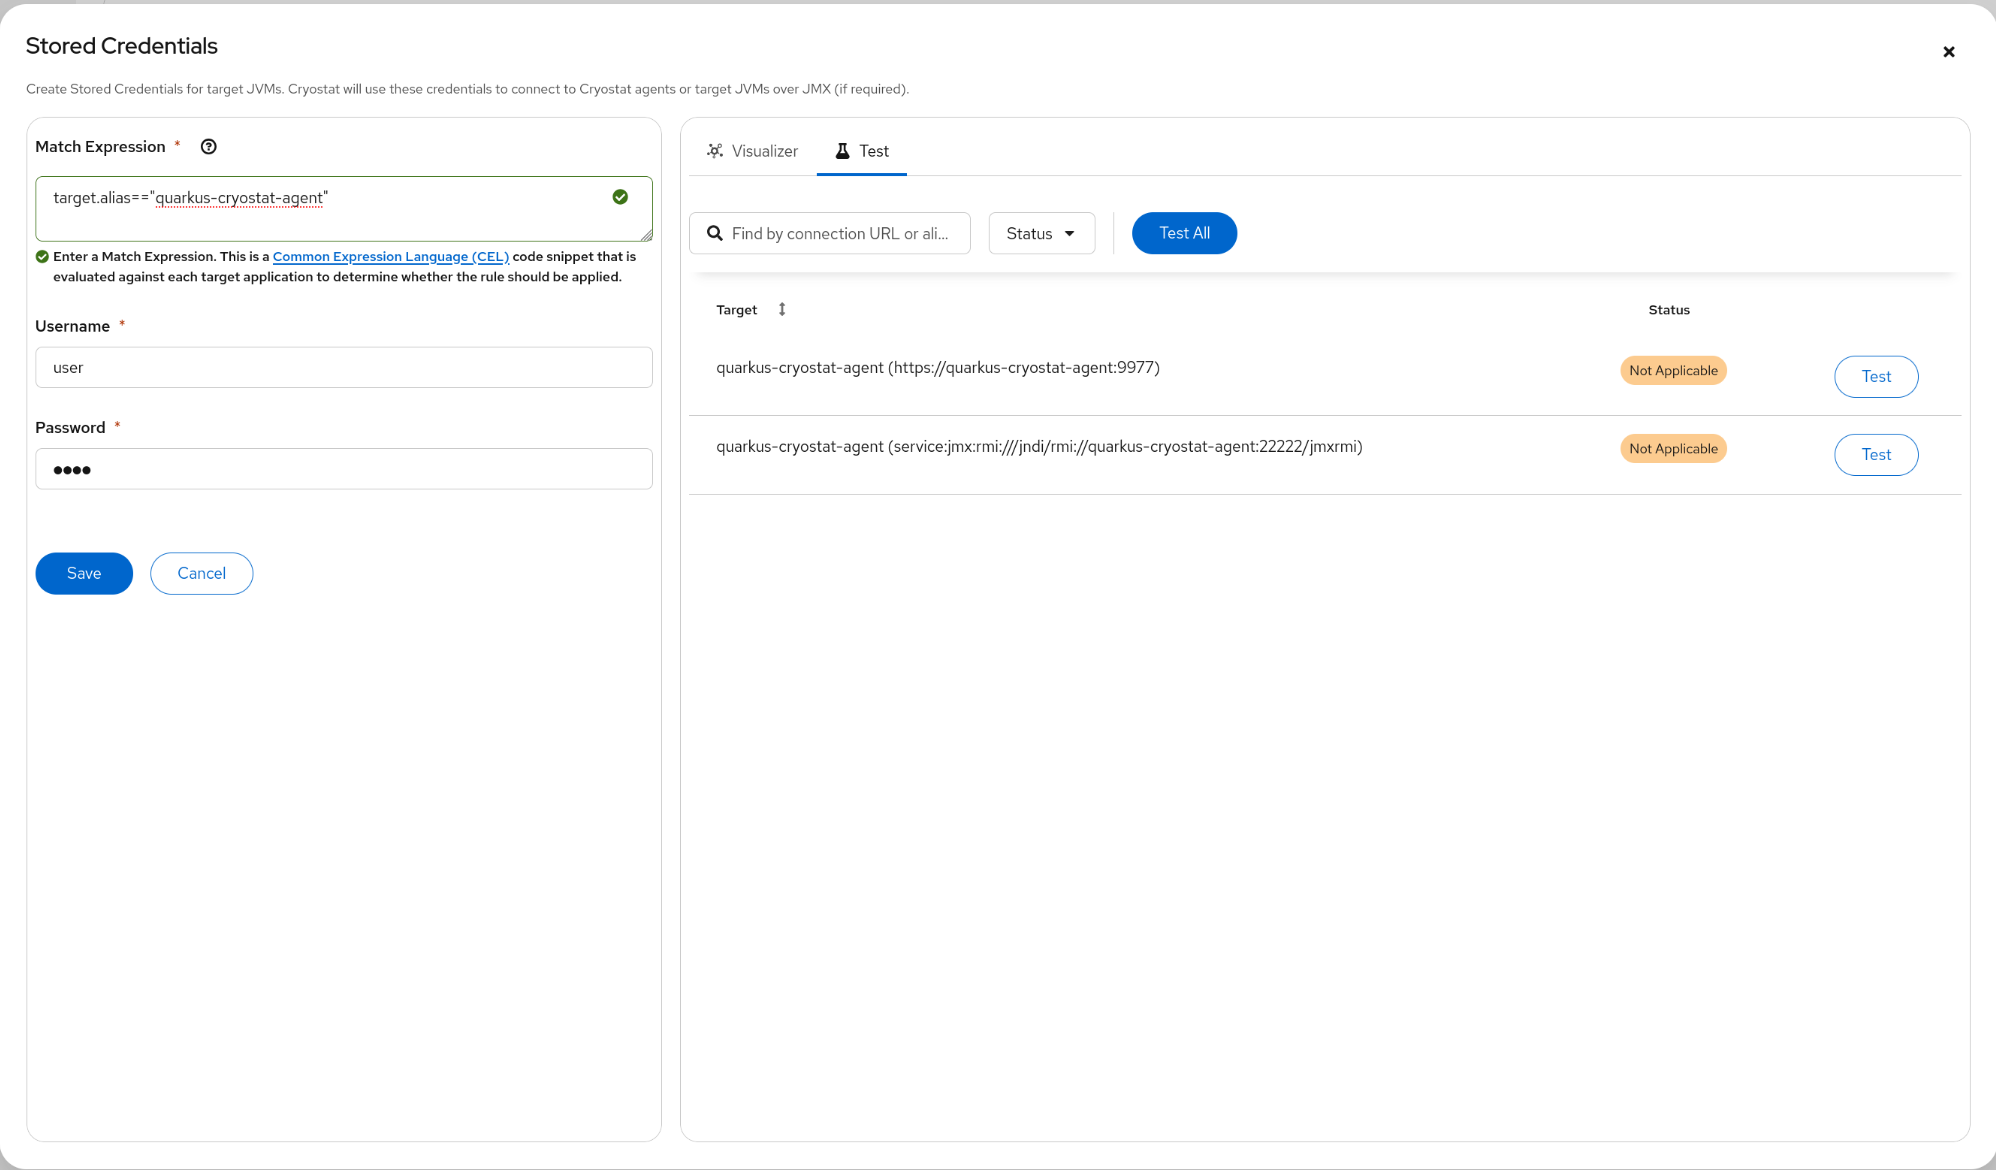
Test your Credentials
Navigate to the Test tab to use the Credential Test table
to check if the entered credential is valid for the matched targets.
You can individually test each target or bulk test all targets at the
same time. The Status column will report the following test
status:
Valid: valid credential for the targetJVM.
Invalid: invalid credential for the targetJVM.
Not applicable: JMX authentication is not enabled on the
target JVM.
(Alternative to Steps 1 and 2) Store Credentials when Connecting to a
TargetJVM
Alternatively, credentials may also be stored if you navigate to either
the Flight Recorder/Capture/Recordings view or the Flight Recorder/Capture/Events view and select a targetJVM with authentication enabled. The authentication form will appear,
prompting you to enter your credentials. A new credential definition with the provided
username and password will be stored for this specific target application
in the CryostatKeyring.
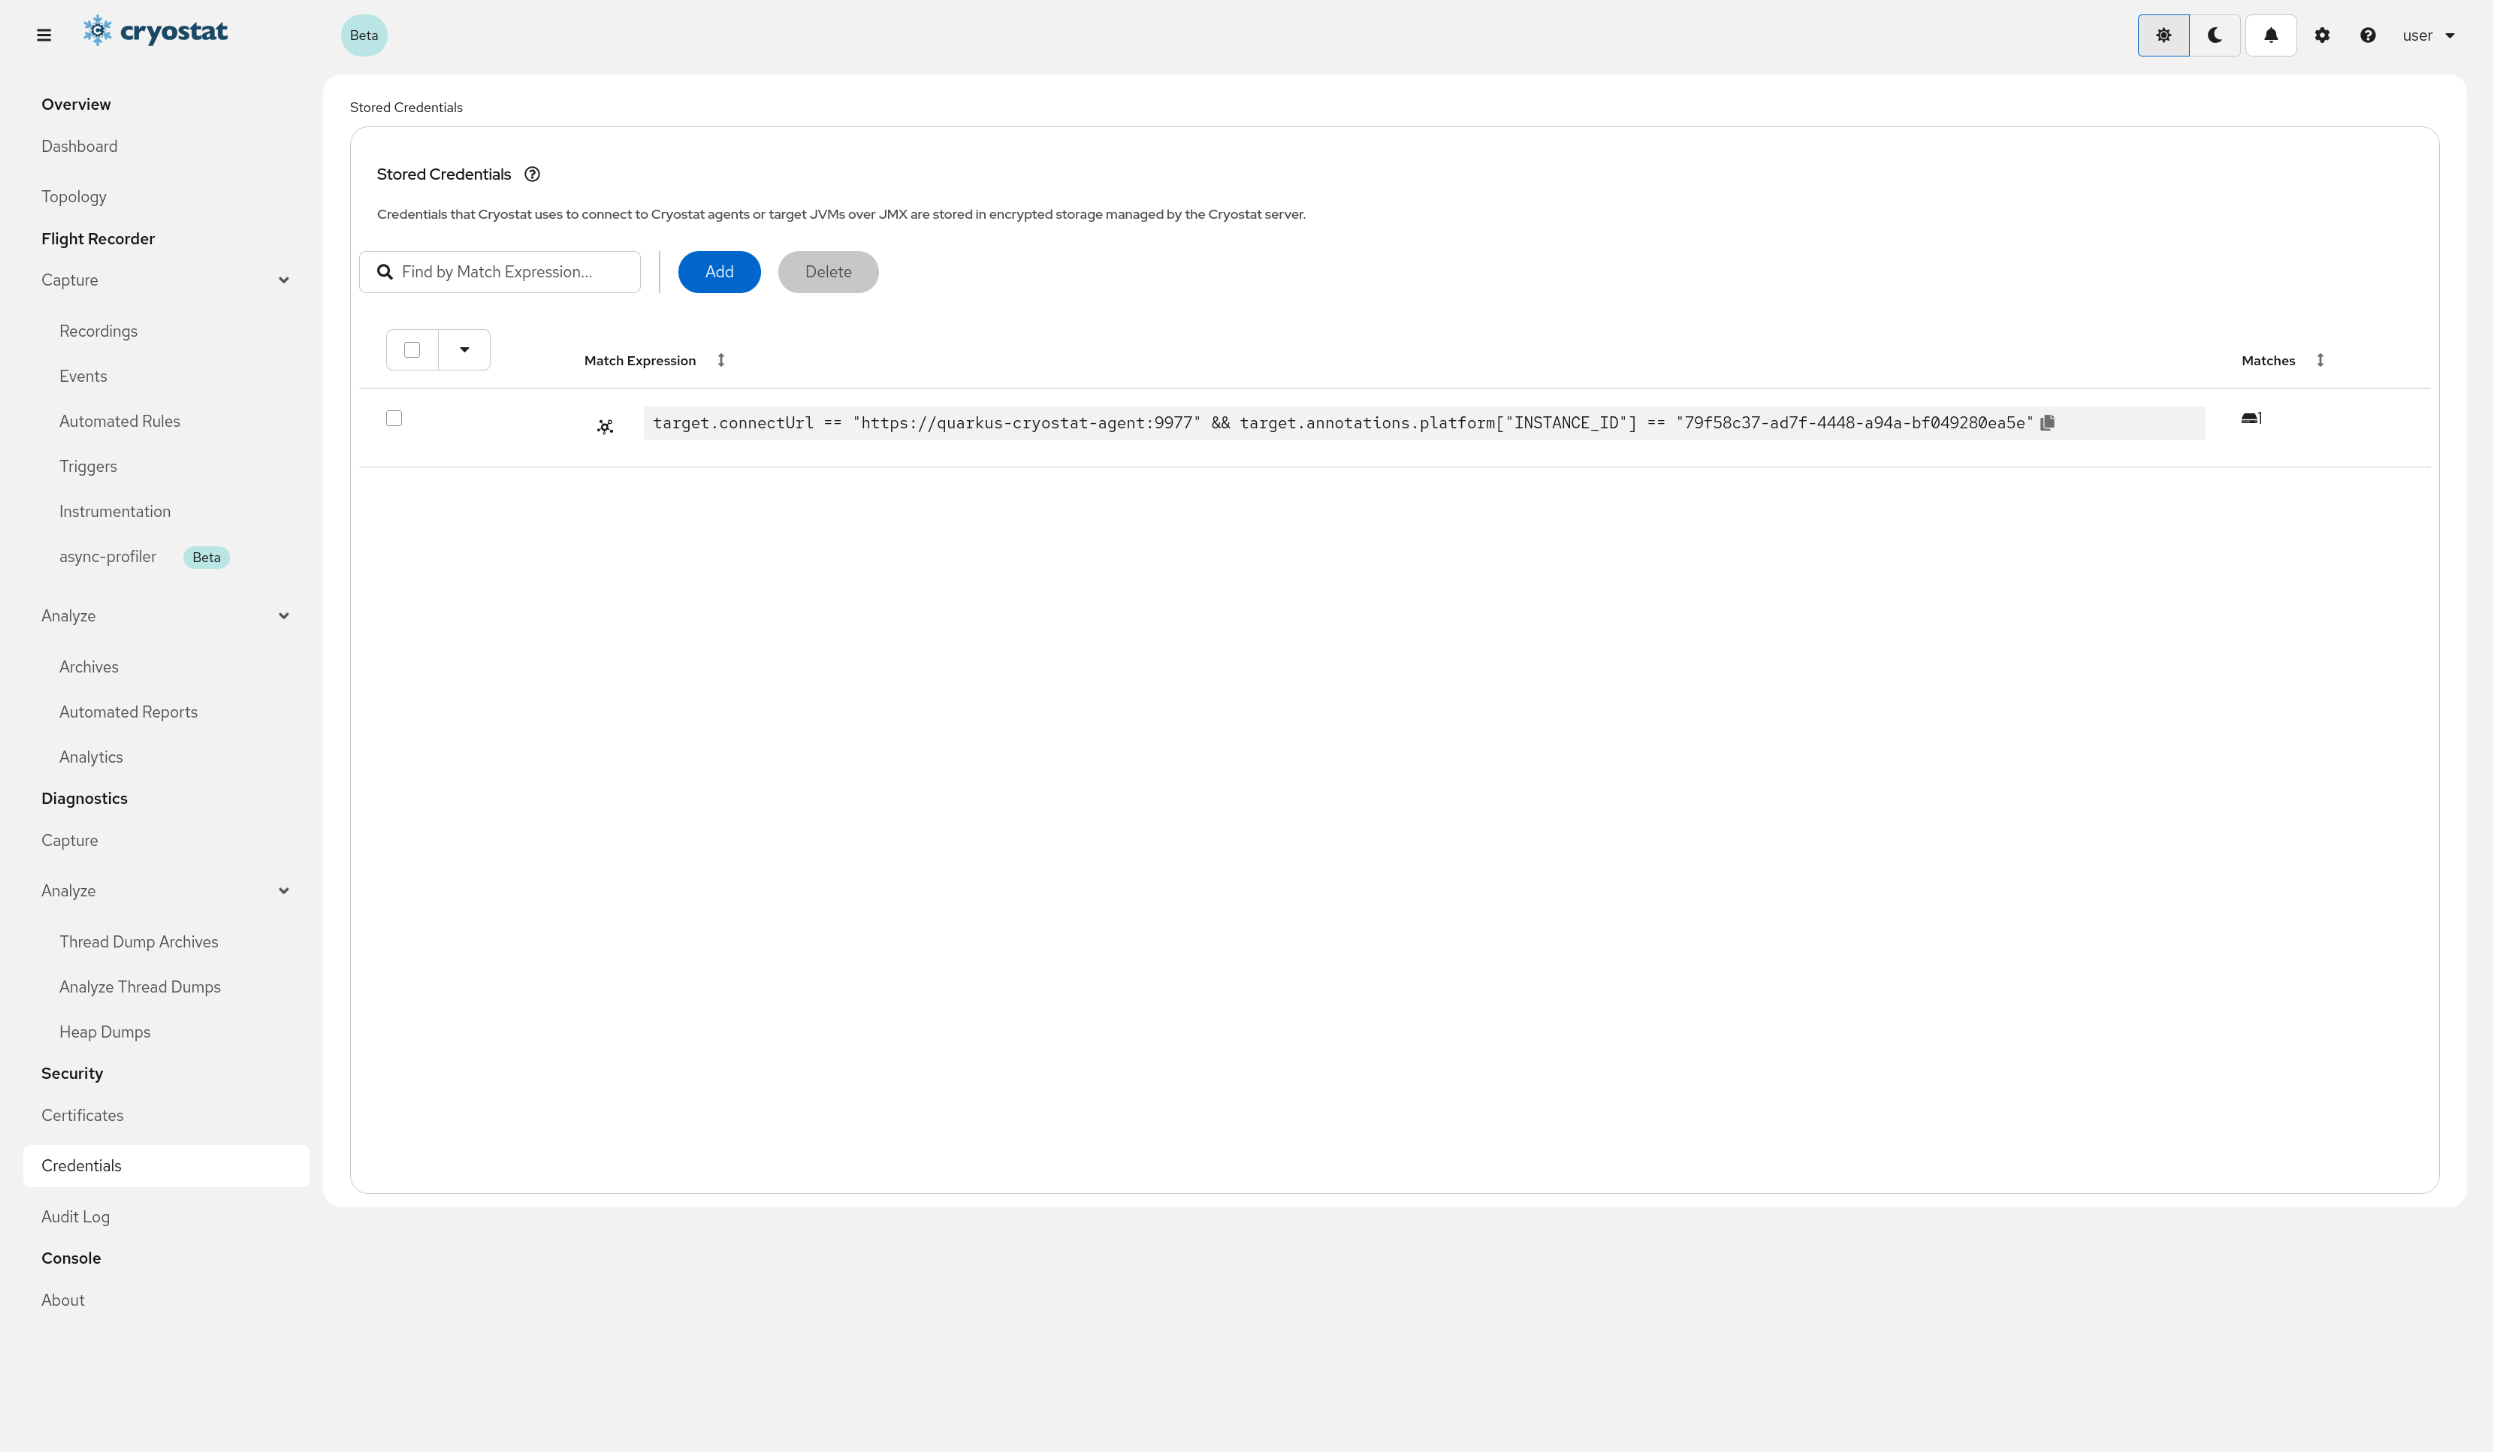
View your Stored Credentials
The Store Credentials table will update with a row for each of the credentials you have stored in the Keyring. The matchExpression is visible along with a count of the number of known target applications that these credentials will apply to. You can expand the row to display a list of those matched target applications. For security reasons it is not possible to view the stored username and password associated with a credential definition in the Keyring.
If deploying Cryostat in a Kubernetes environment through the Cryostat Operator, stored credentials can be preconfigured within Cryostat.
To begin, create a text file containing a stored credential definition, for example:
{"matchExpression":"'jfrMonitoring' in target.annotations.platform && target.annotations.platform['jfrMonitoring']=='enabled'","username":"myuser","password":"changeit"}
Then create a Secret within Kubernetes or Red Hat Openshift from this text file:
Now that this Secret has been created, when creating the Cryostat Custom Resource we can specify it, either through the Red Hat Openshift console under Stored Credentials while creating the Cryostat Custom Resource, or through the Custom Resource YAML:
Once the Custom Resource has been created, the credentials will be pre-loaded into Cryostat and be available from startup without any further configuration needed.
If you have Java Management Extensions (JMX) over SSL enabled on your containerized JVMs, you must configure Cryostat to trust the SSL/TLS certificate presented by the containerized JVM when Cryostat attempts to open a JMX connection. If you do not complete this configuration, Cryostat cannot open a JMX connection for the purposes of performing JFR management tasks.
Navigate to the Security Tab
Click the Security tab. This should initially be in an empty state if you have not yet defined any additional trusted certificates.
In order to add a trusted certificate to Cryostat’s custom truststore you must first determine the directory that Cryostat loads certificates from.
This is controlled by the configuration property ssl.truststore.dir and defaults to /truststore. If you are deploying Cryostat manually in an
environment like Podman or Docker Compose, you should create a volume containing the certificates and mount it to this location, or bind-mount a host
directory to this location. If you are using the Cryostat Helm Chart then you should create Secrets containing each trusted certificate and mount
each within this location. If you are using the Cryostat Operator, see the section below.
Once you have loaded your additional certificates to the truststore you must restart the Cryostat container, since it can only load certificates
into the JVM truststore at startup time. The container may be restarted automatically when you modify the configuration, depending on your deployment
platform.
After you have loaded the certificates and verified that the Cryostat container has restarted, you can verify that Cryostat correctly found the
certificate(s) within the truststore directory.
Alternatively if deploying Cryostat in a Kubernetes environment with the Cryostat Operator, TLS certificates can be preconfigured in Cryostat when creating the custom resource. To begin, create a Kubernetes Secret or ConfigMap containing the TLS certificate or CA bundle.
Now that this Secret or ConfigMap has been created, when creating the Cryostat Custom Resource we can specify it, either through the Red Hat OpenShift console under Trusted TLS Certificates while creating the Cryostat Custom Resource, or through the Custom Resource YAML:
Each trustedCertSecrets entry must specify exactly one of secretName or configMapName. If certificateKey is omitted, the default key name is tls.crt for Secrets and service-ca.crt for ConfigMaps. The ConfigMap default is useful for OpenShift service CA bundles.
Once the Custom Resource has been created, the TLS certificate will be pre-loaded into Cryostat and be available from startup without any further configuration needed.
Cryostat can persist audit history for changes to its entities when
audit logging is enabled. This history includes changes to targets and discovery
data, recordings, automated rules, credentials, diagnostic resources, event
templates, JMC Agent probe templates, garbage collection requests, and
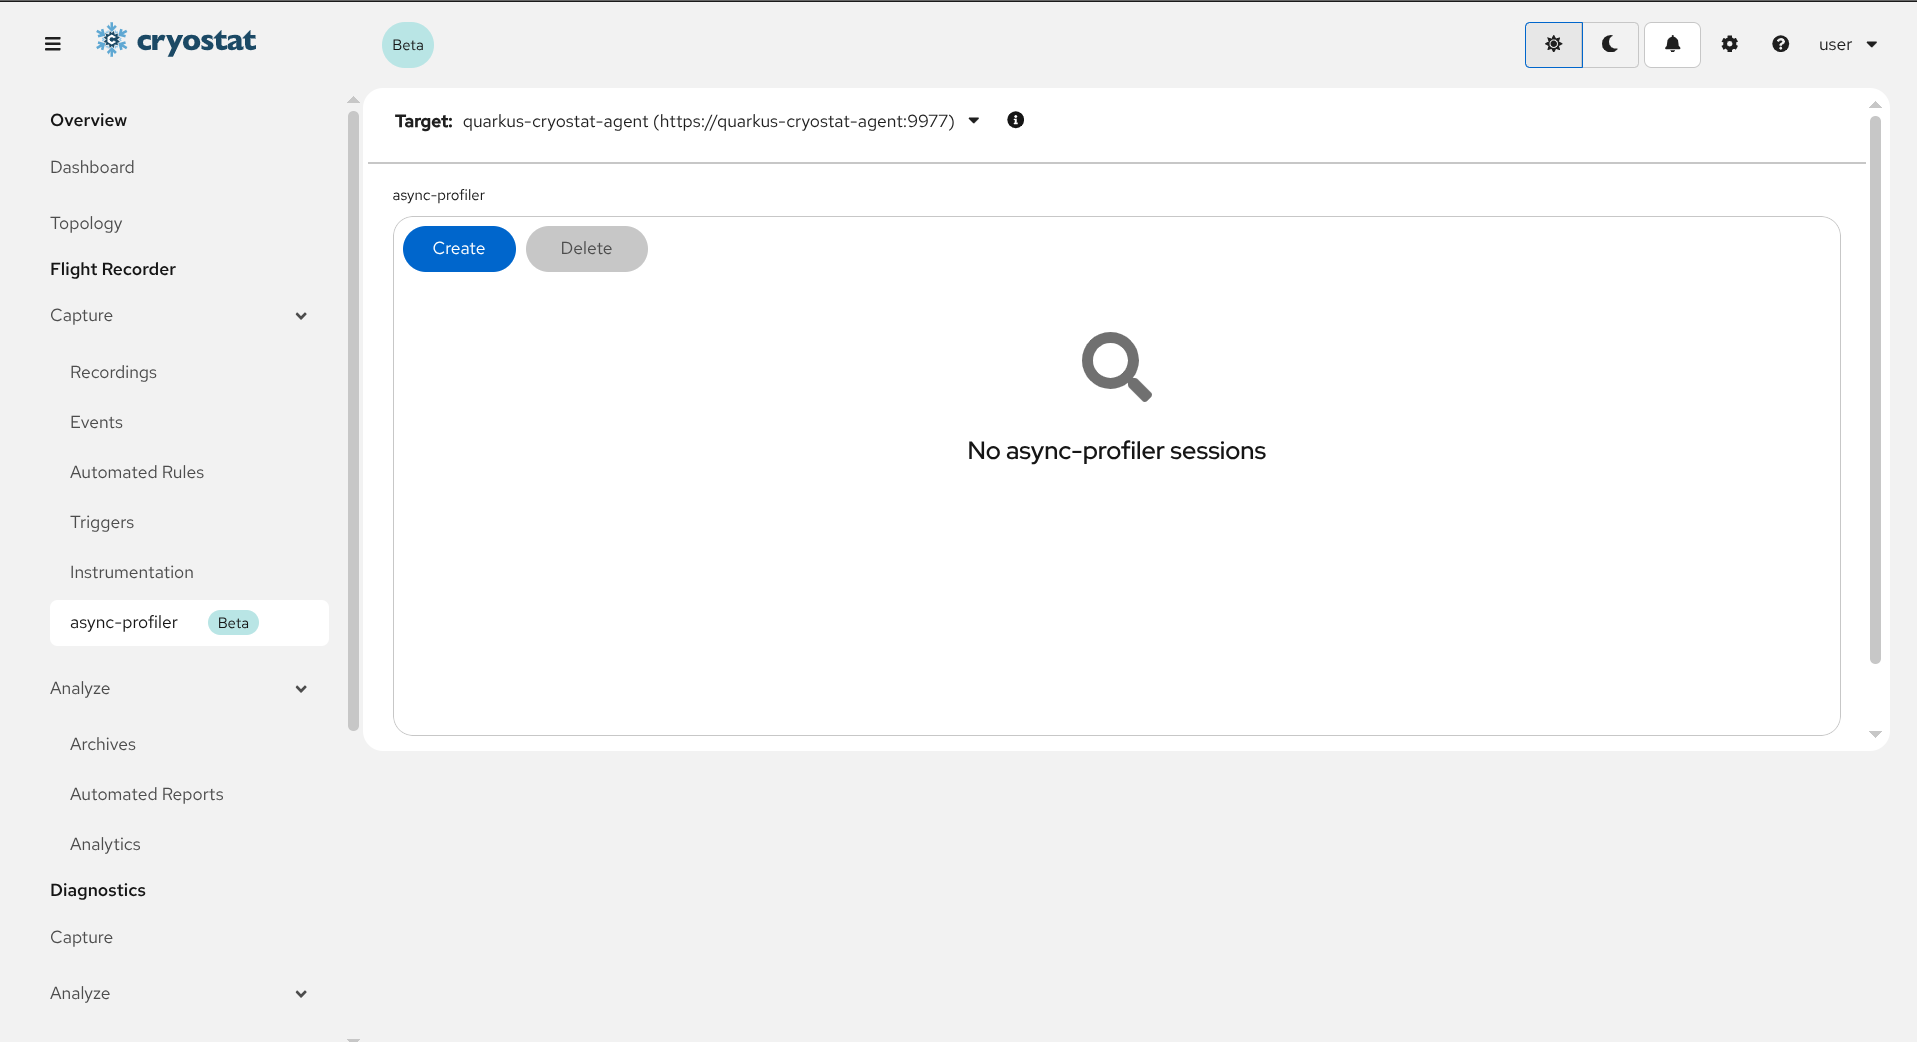
async-profiler recordings.
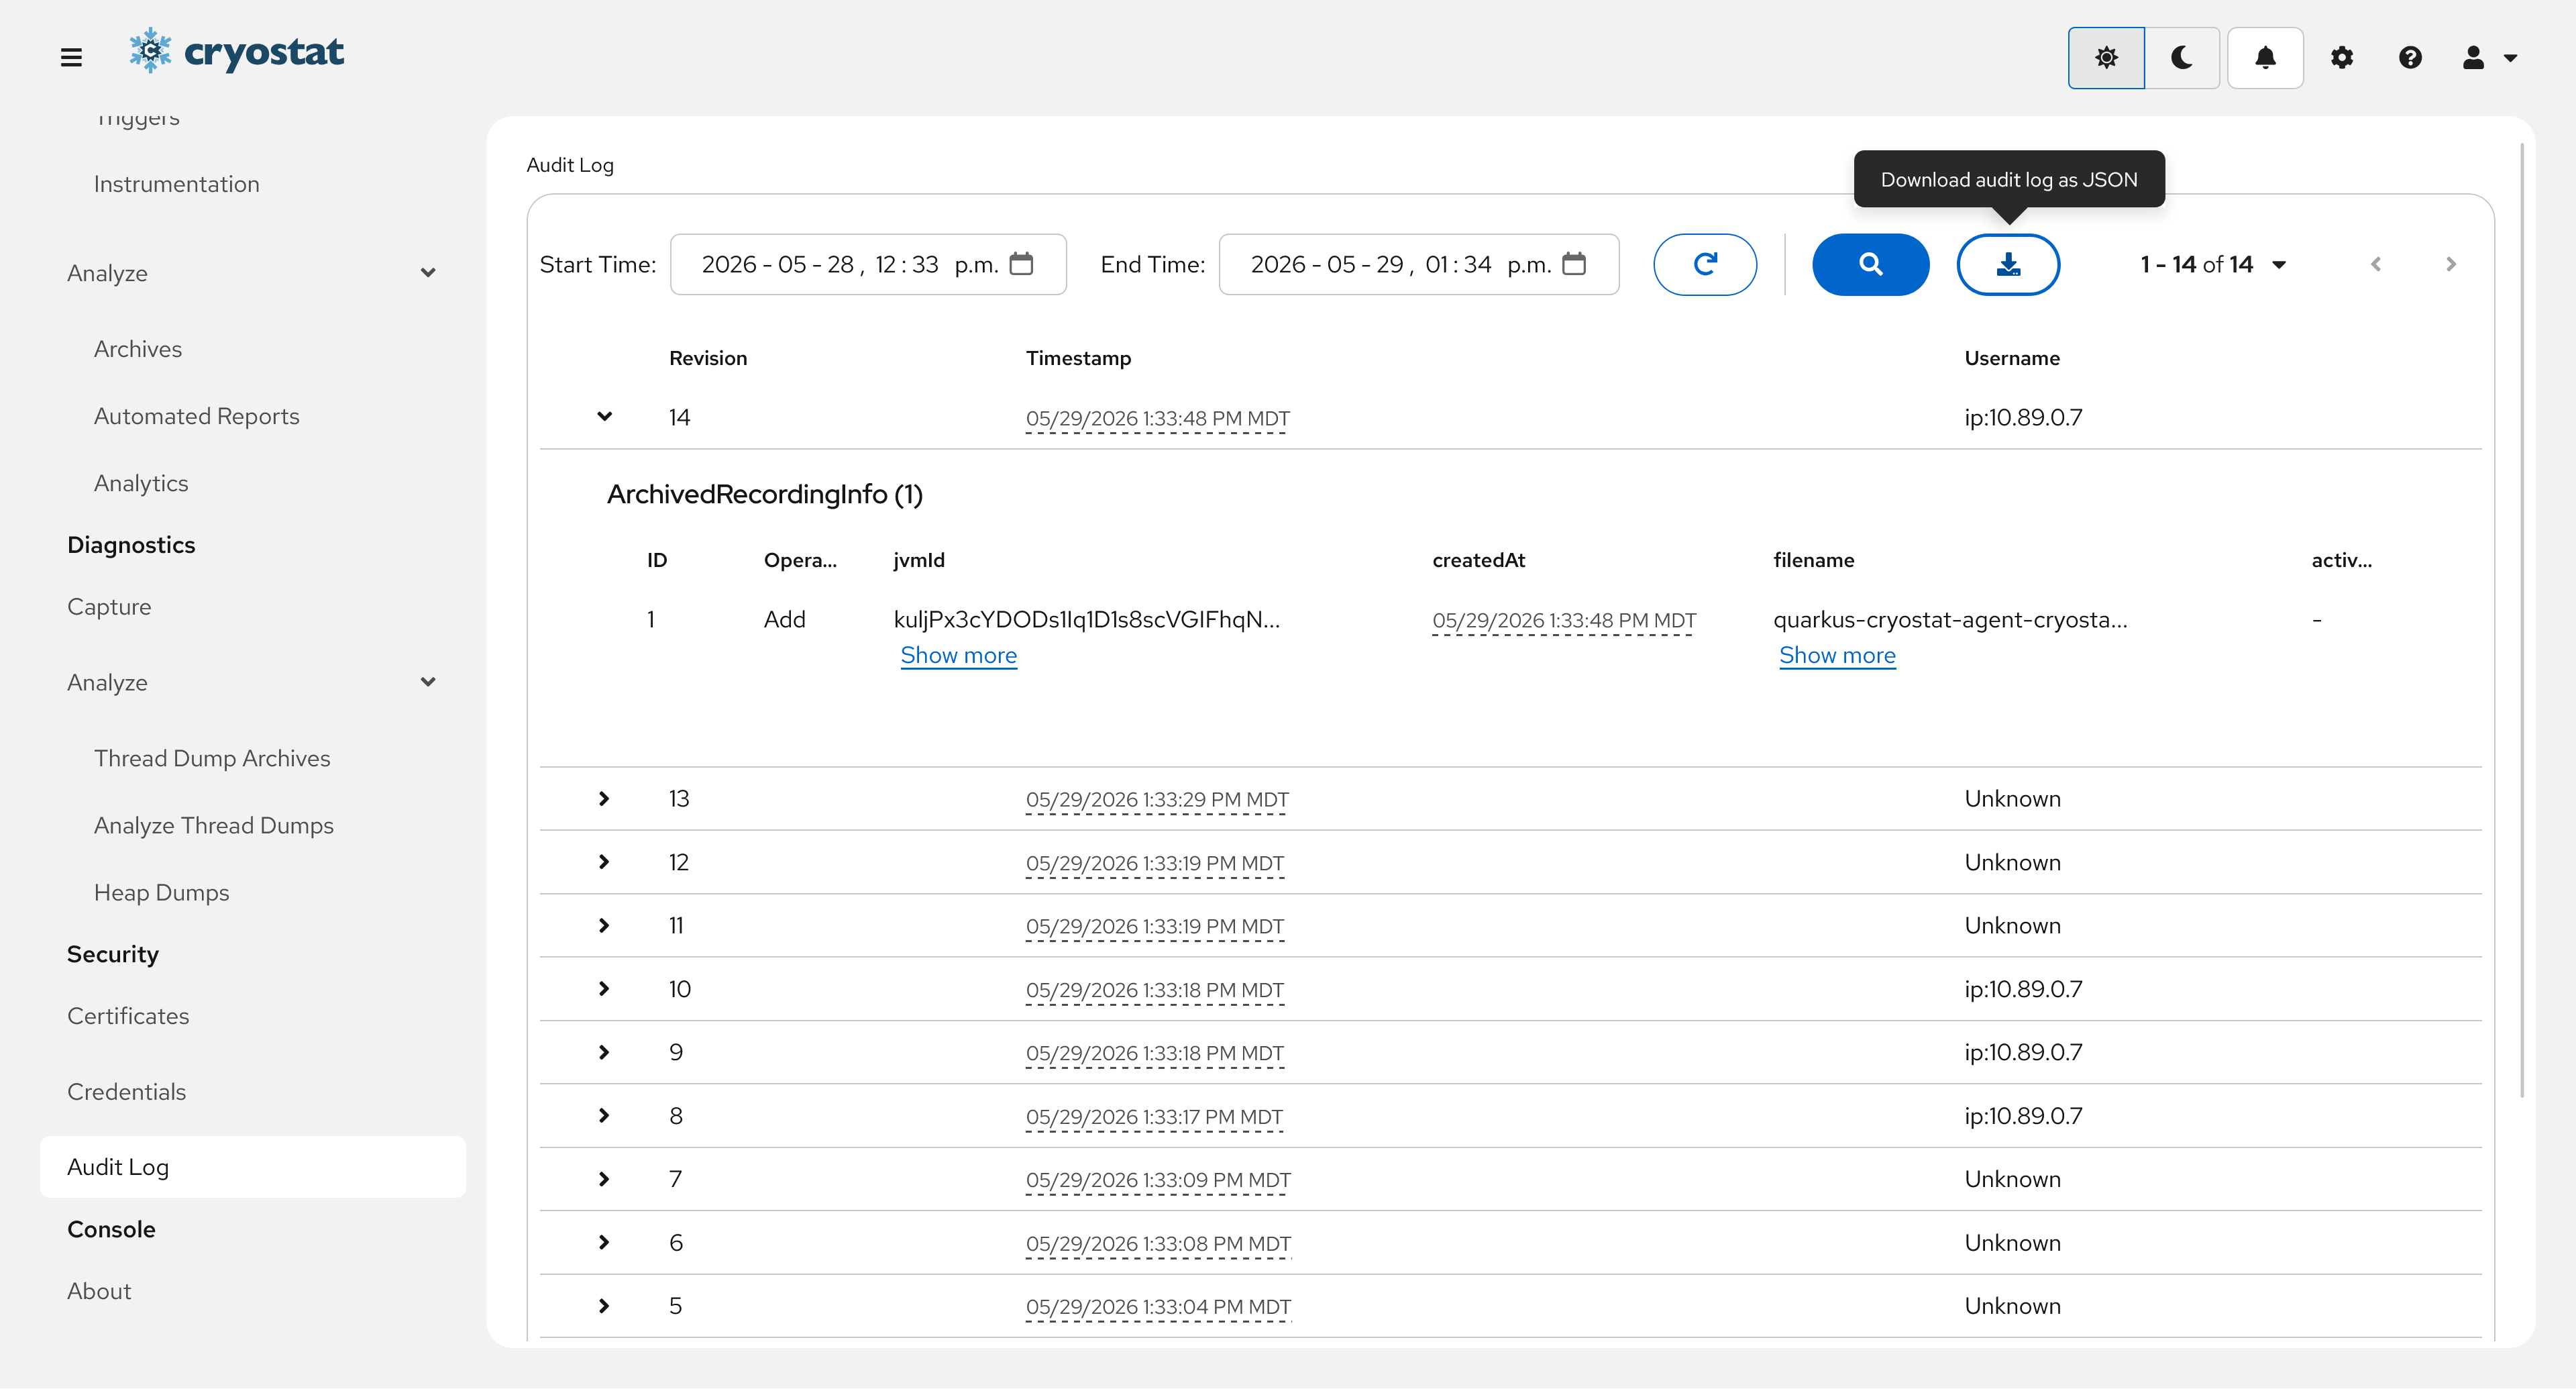
The Audit Log view lets you query audit revisions by time range, inspect the
entities changed by each revision, and download a JSON report for offline audit
analysis. Some revisions might show an unknown user when the change was created
by a system task or another operation without a direct user request context.
Delete revisions may also contain fewer entity details than create or update
revisions.
Audit logging must be enabled for the Cryostat deployment before this view
can show audit history. For new Cryostat Operator deployments, audit logging
is enabled by default. Existing deployments might require an explicit
configuration update. Because audit history is persisted in the Cryostat
database, enabling audit logging can increase storage usage over time. For more
information about enabling or disabling audit logging, see
Audit Logging.
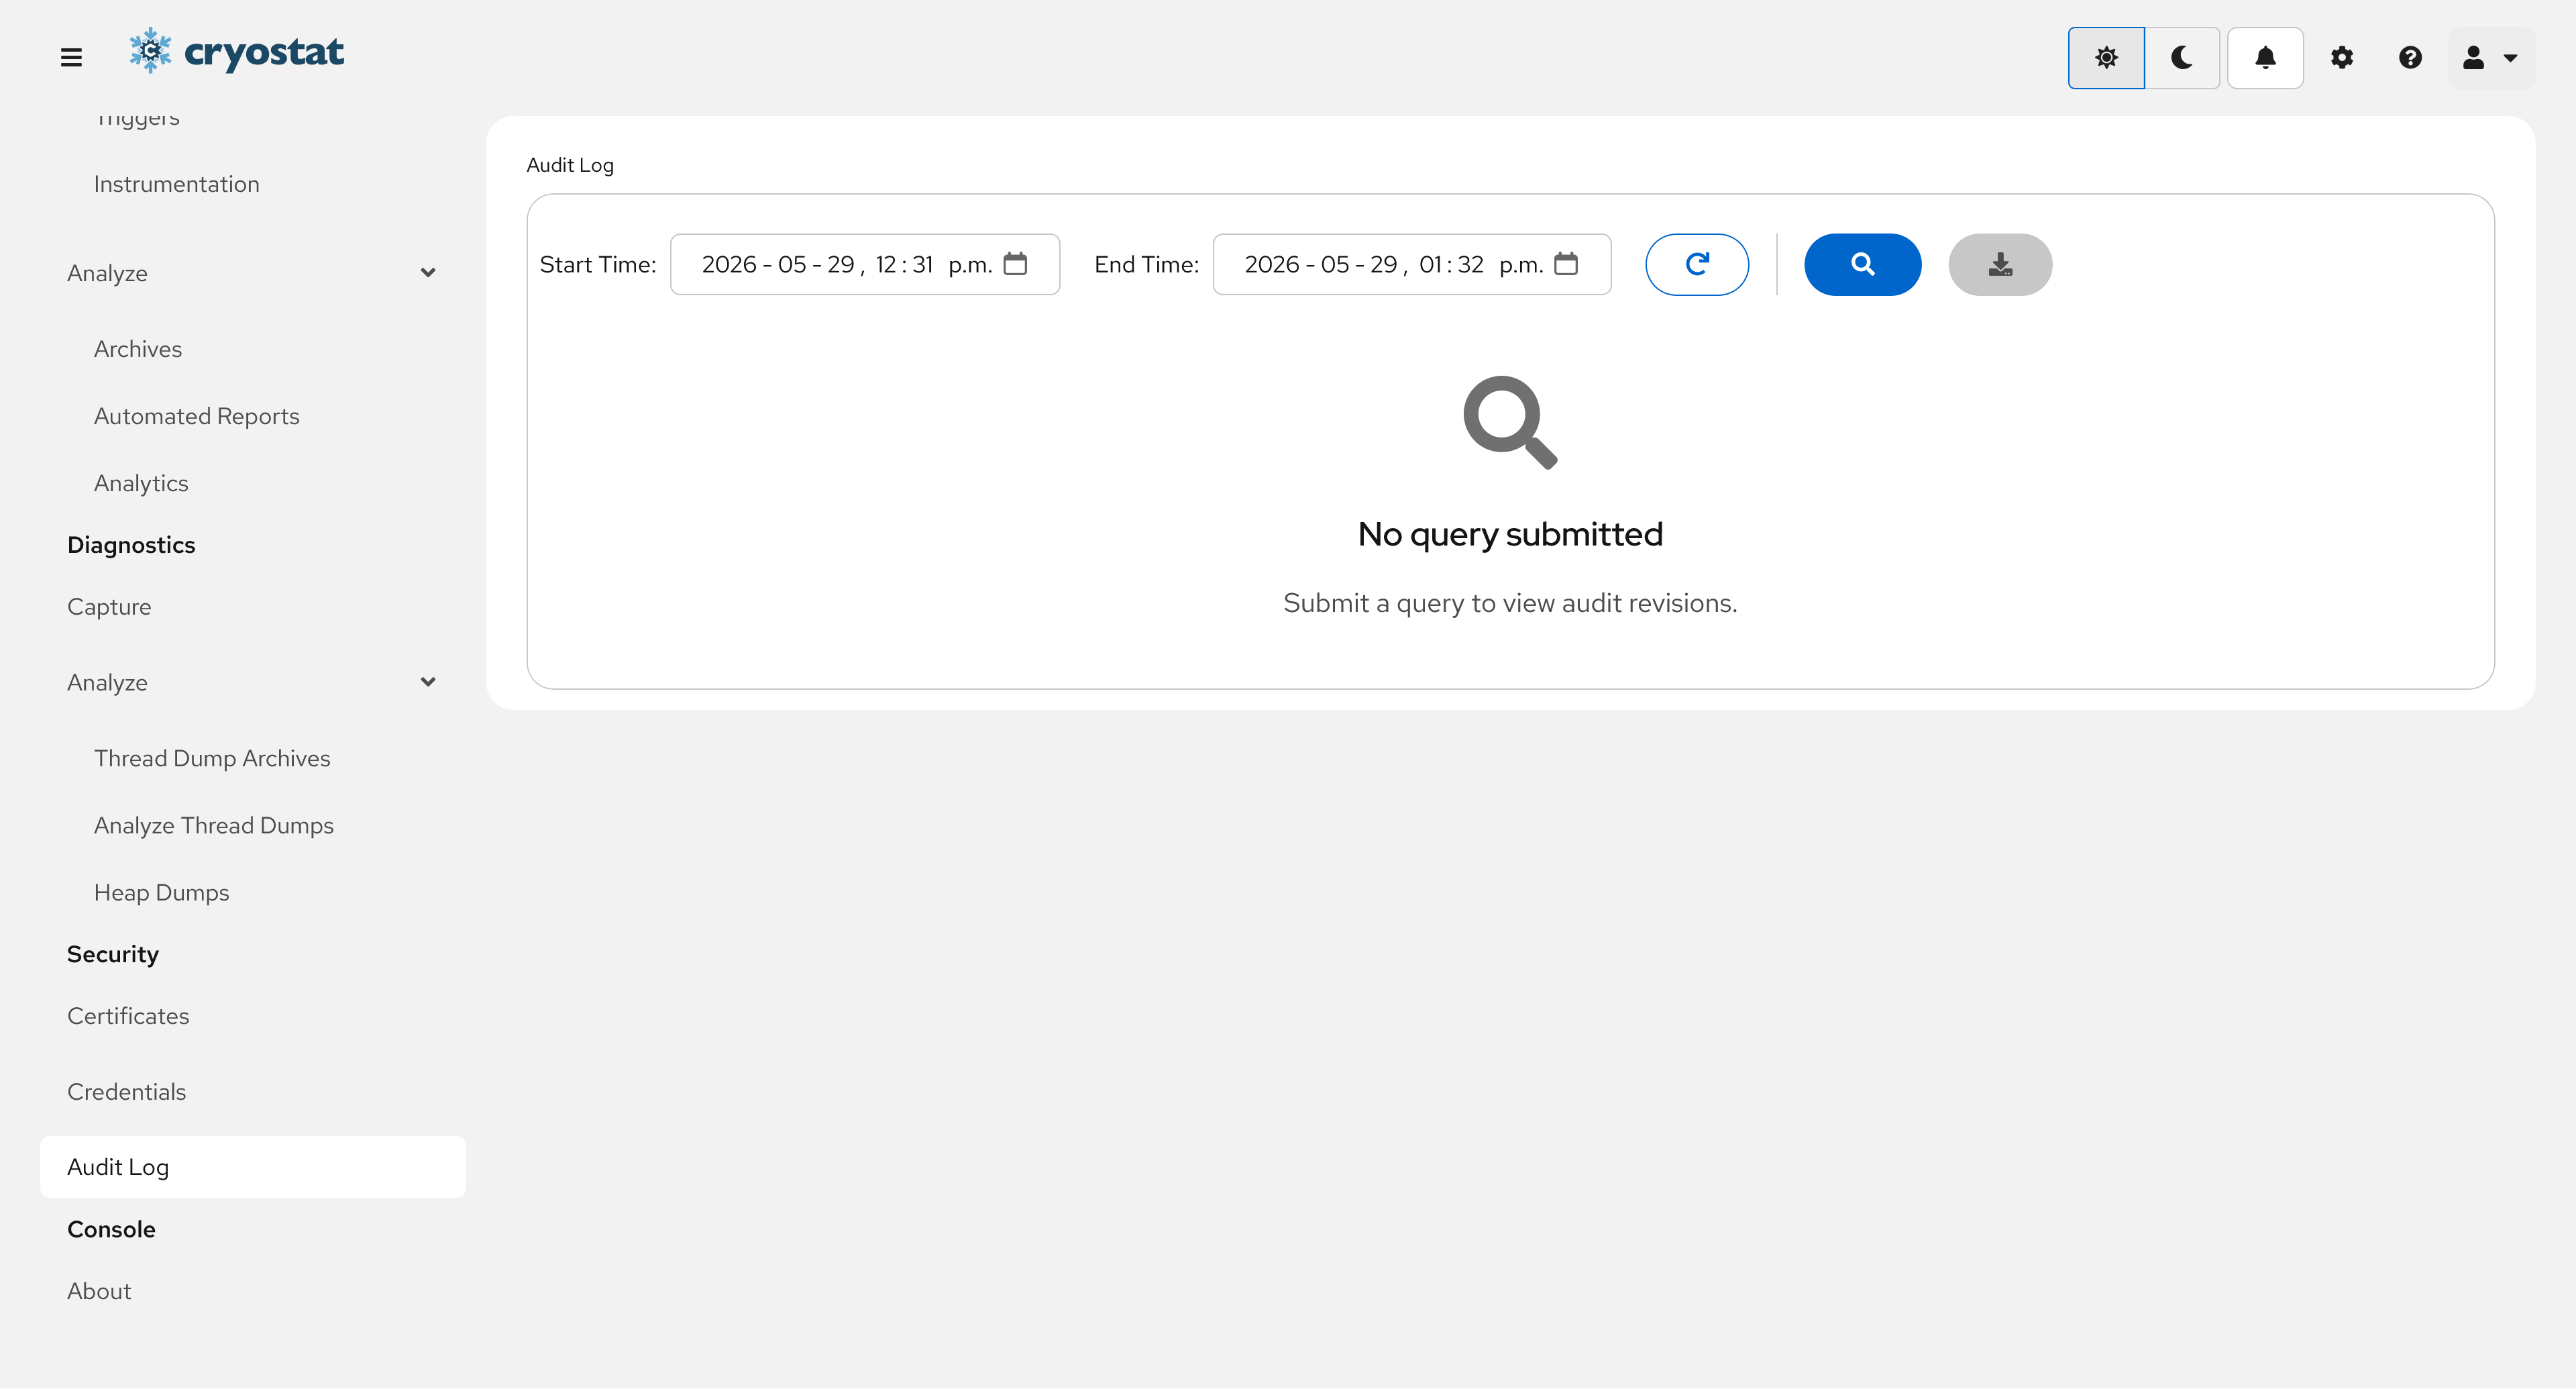
Navigate to the Security/Audit Log view
Click Audit Log in the sidebar under the Security heading. The
view opens with Start Time and End Time controls for
choosing the audit query range.
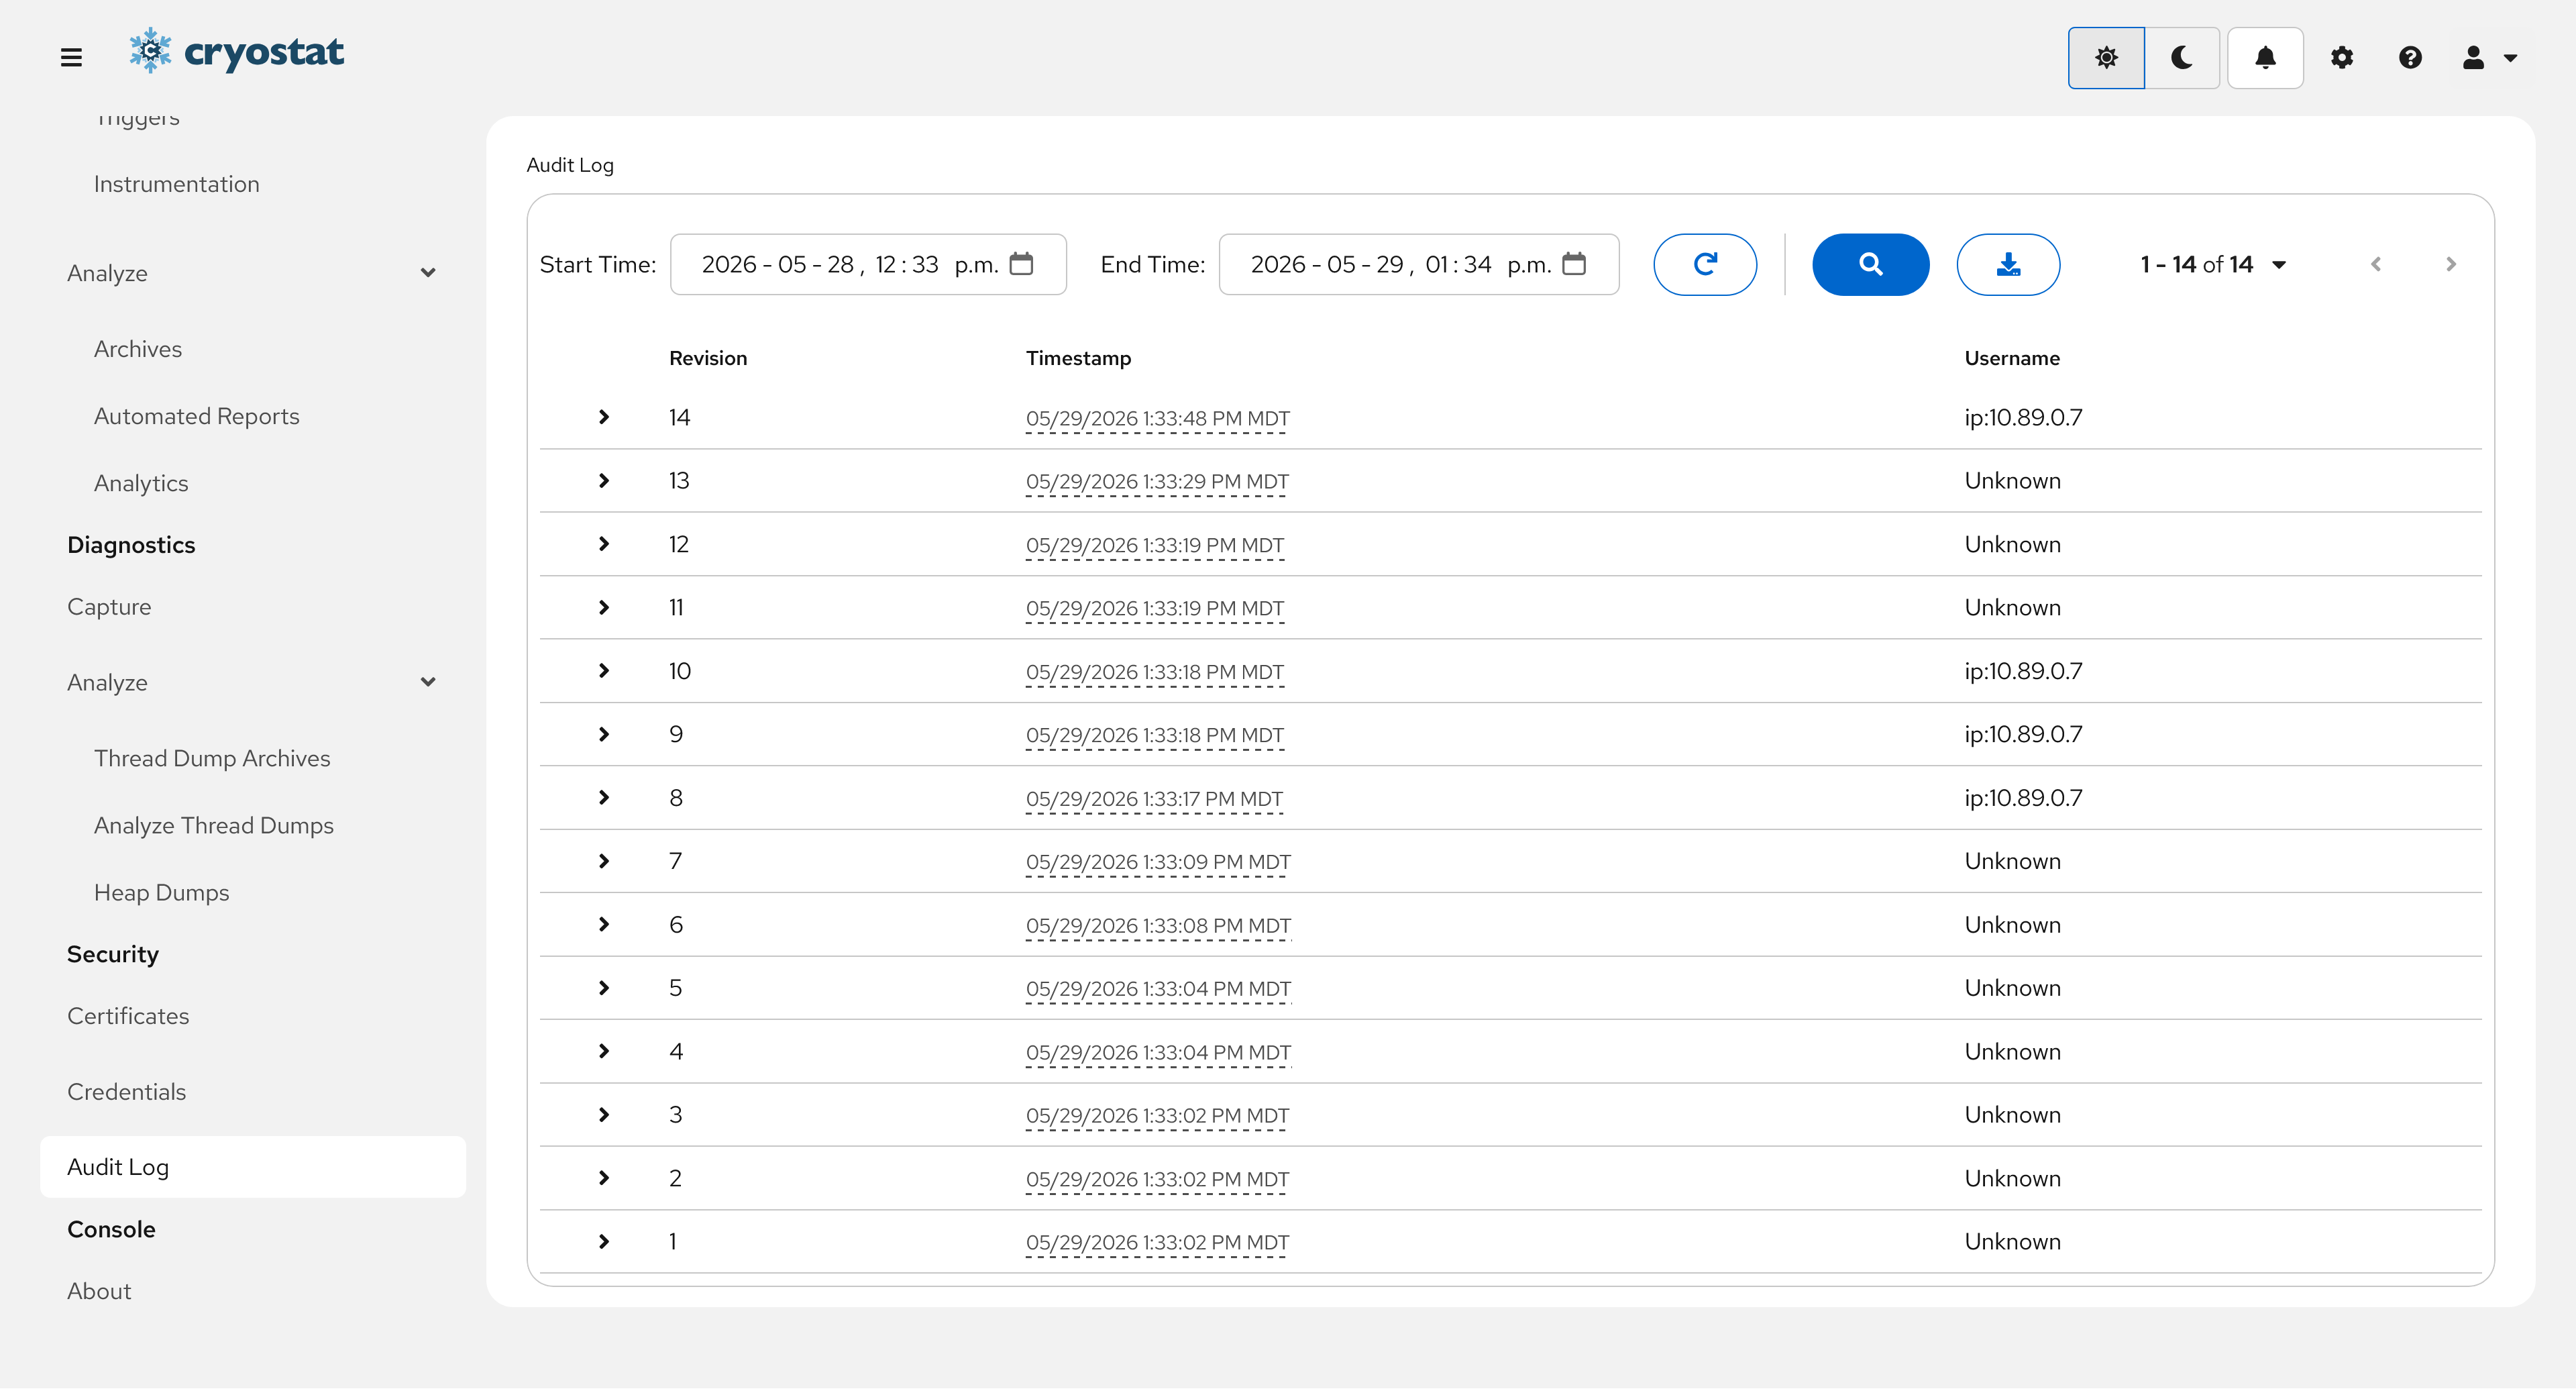
Query audit revisions
Select the Start Time and End Time values for the audit
history you want to inspect, then click the Query icon button.
The table displays matching revisions with their revision number,
timestamp, and username when one is available.
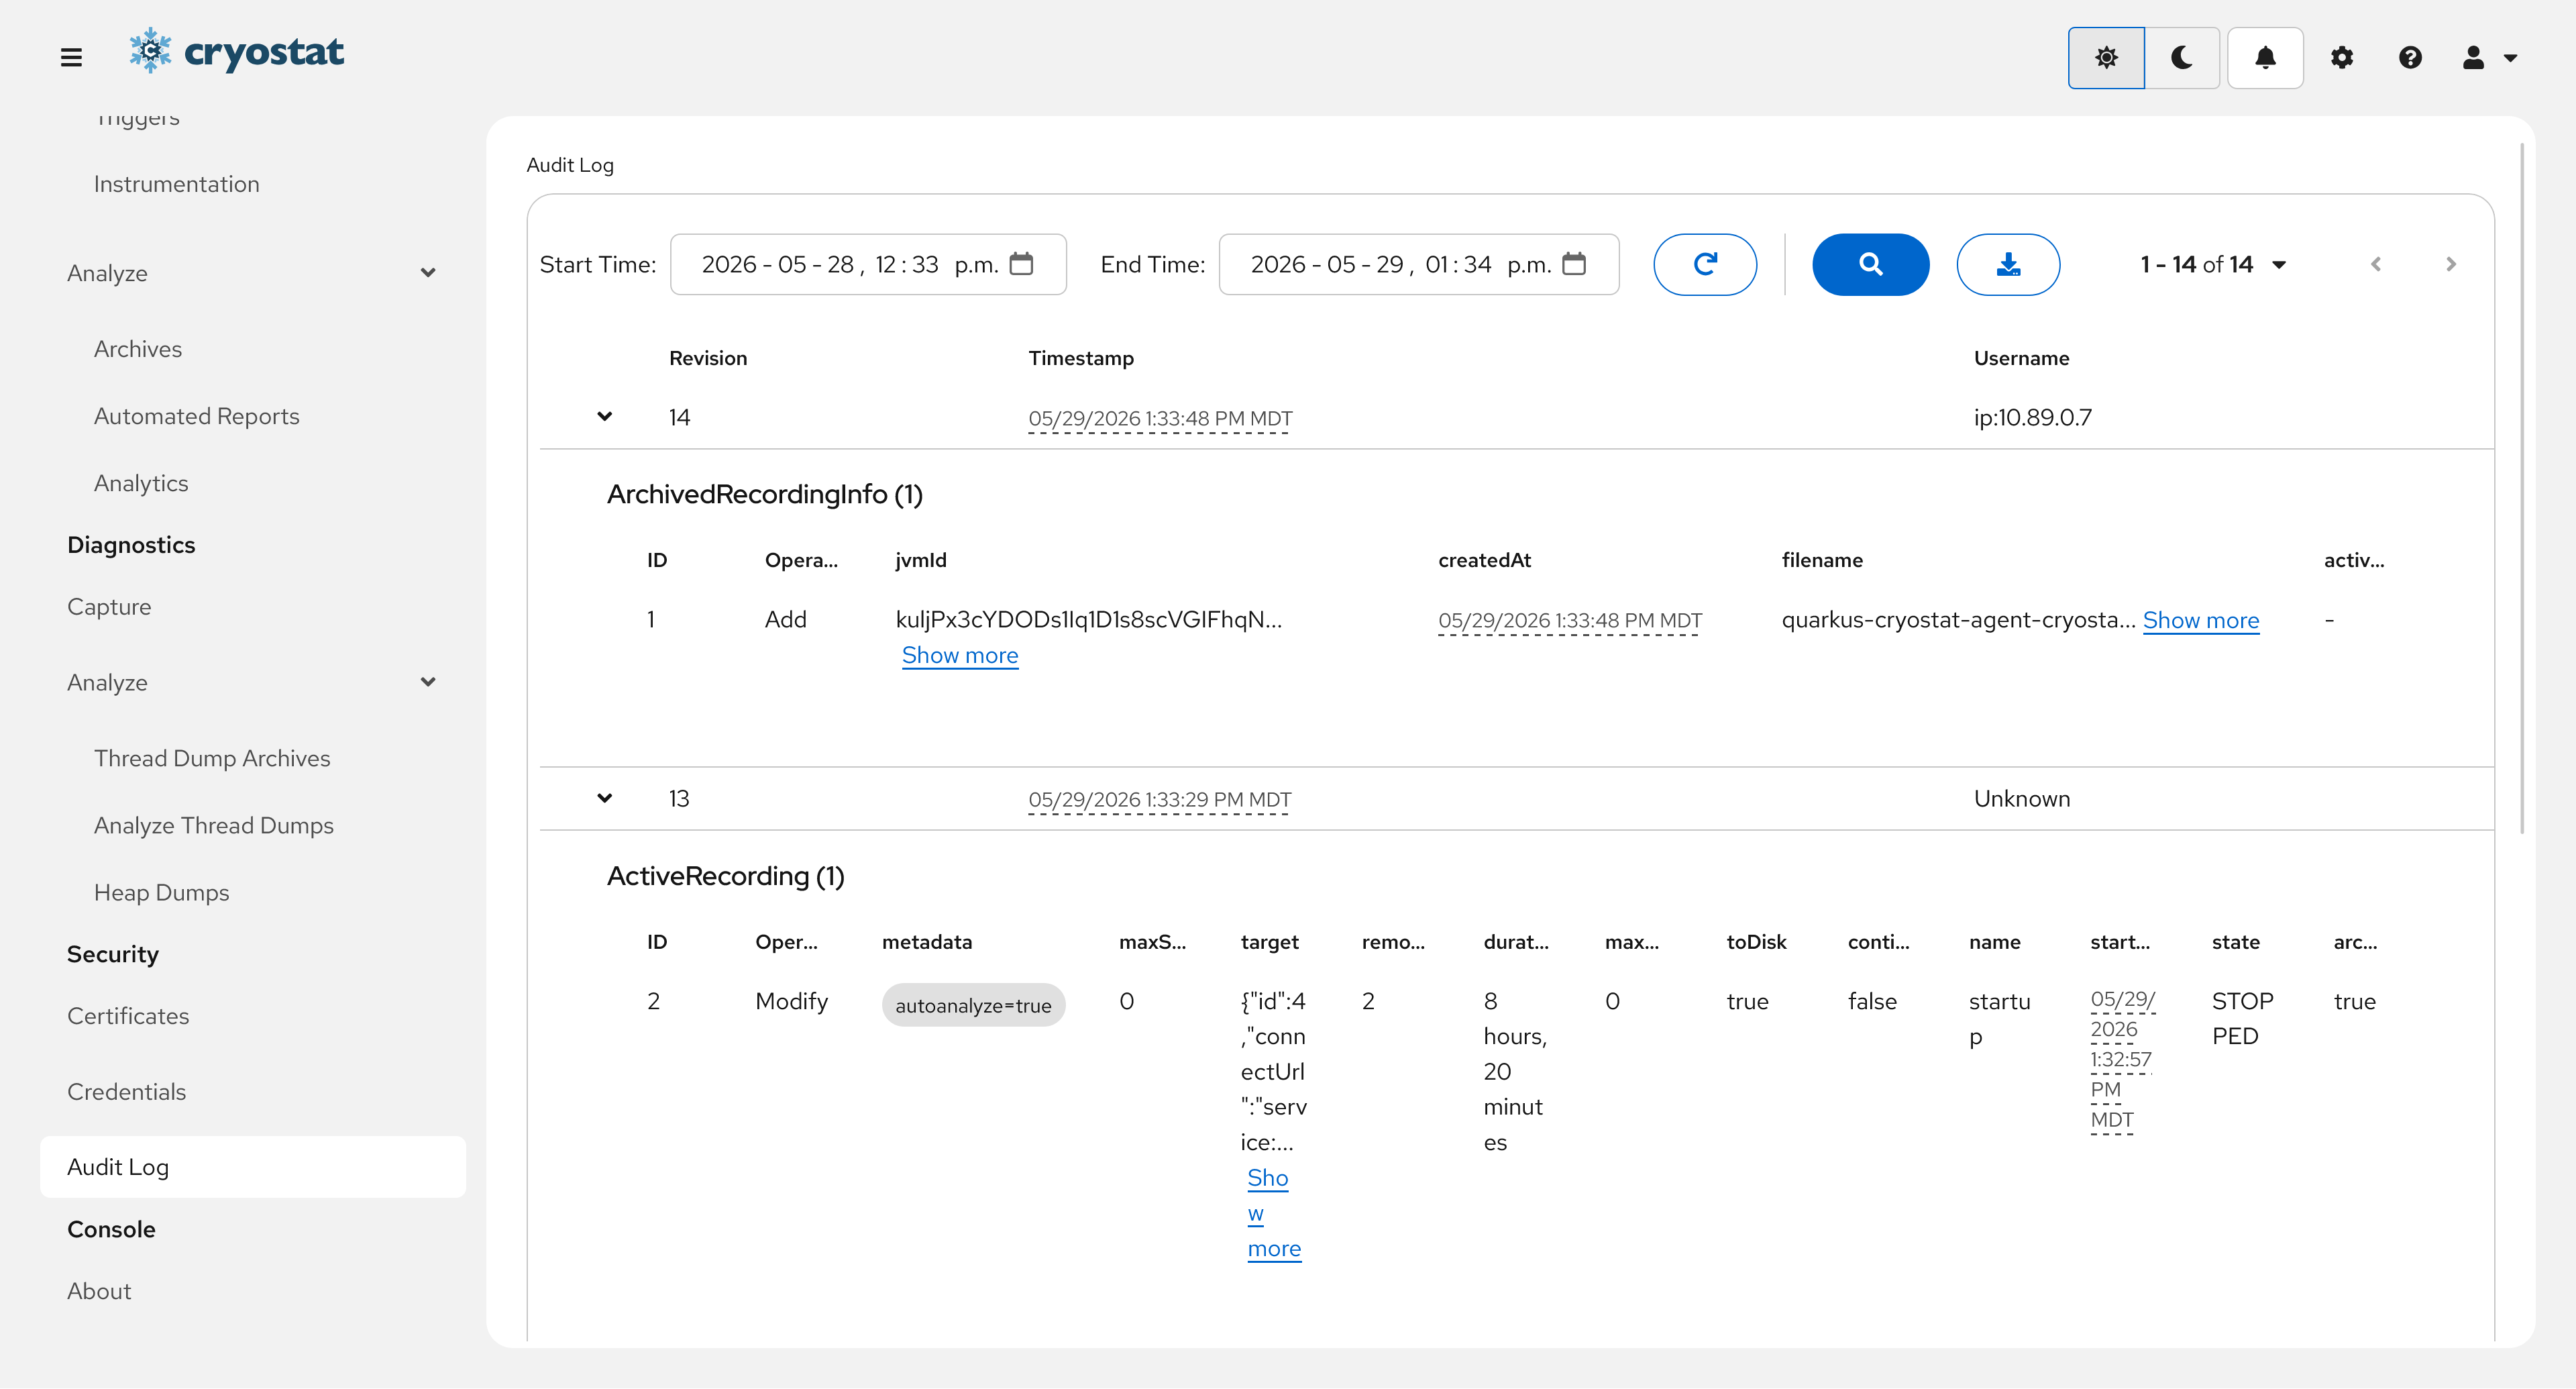
Expand a revision to view entity changes
Expand a revision row to view the entity changes recorded in that
revision. Each entity table shows the entity ID, operation type, and
available fields for the audited entity.
Download the audit log report
After a query returns revisions, click the Download audit log as
JSON icon button to download the full audit report for the selected
time range.
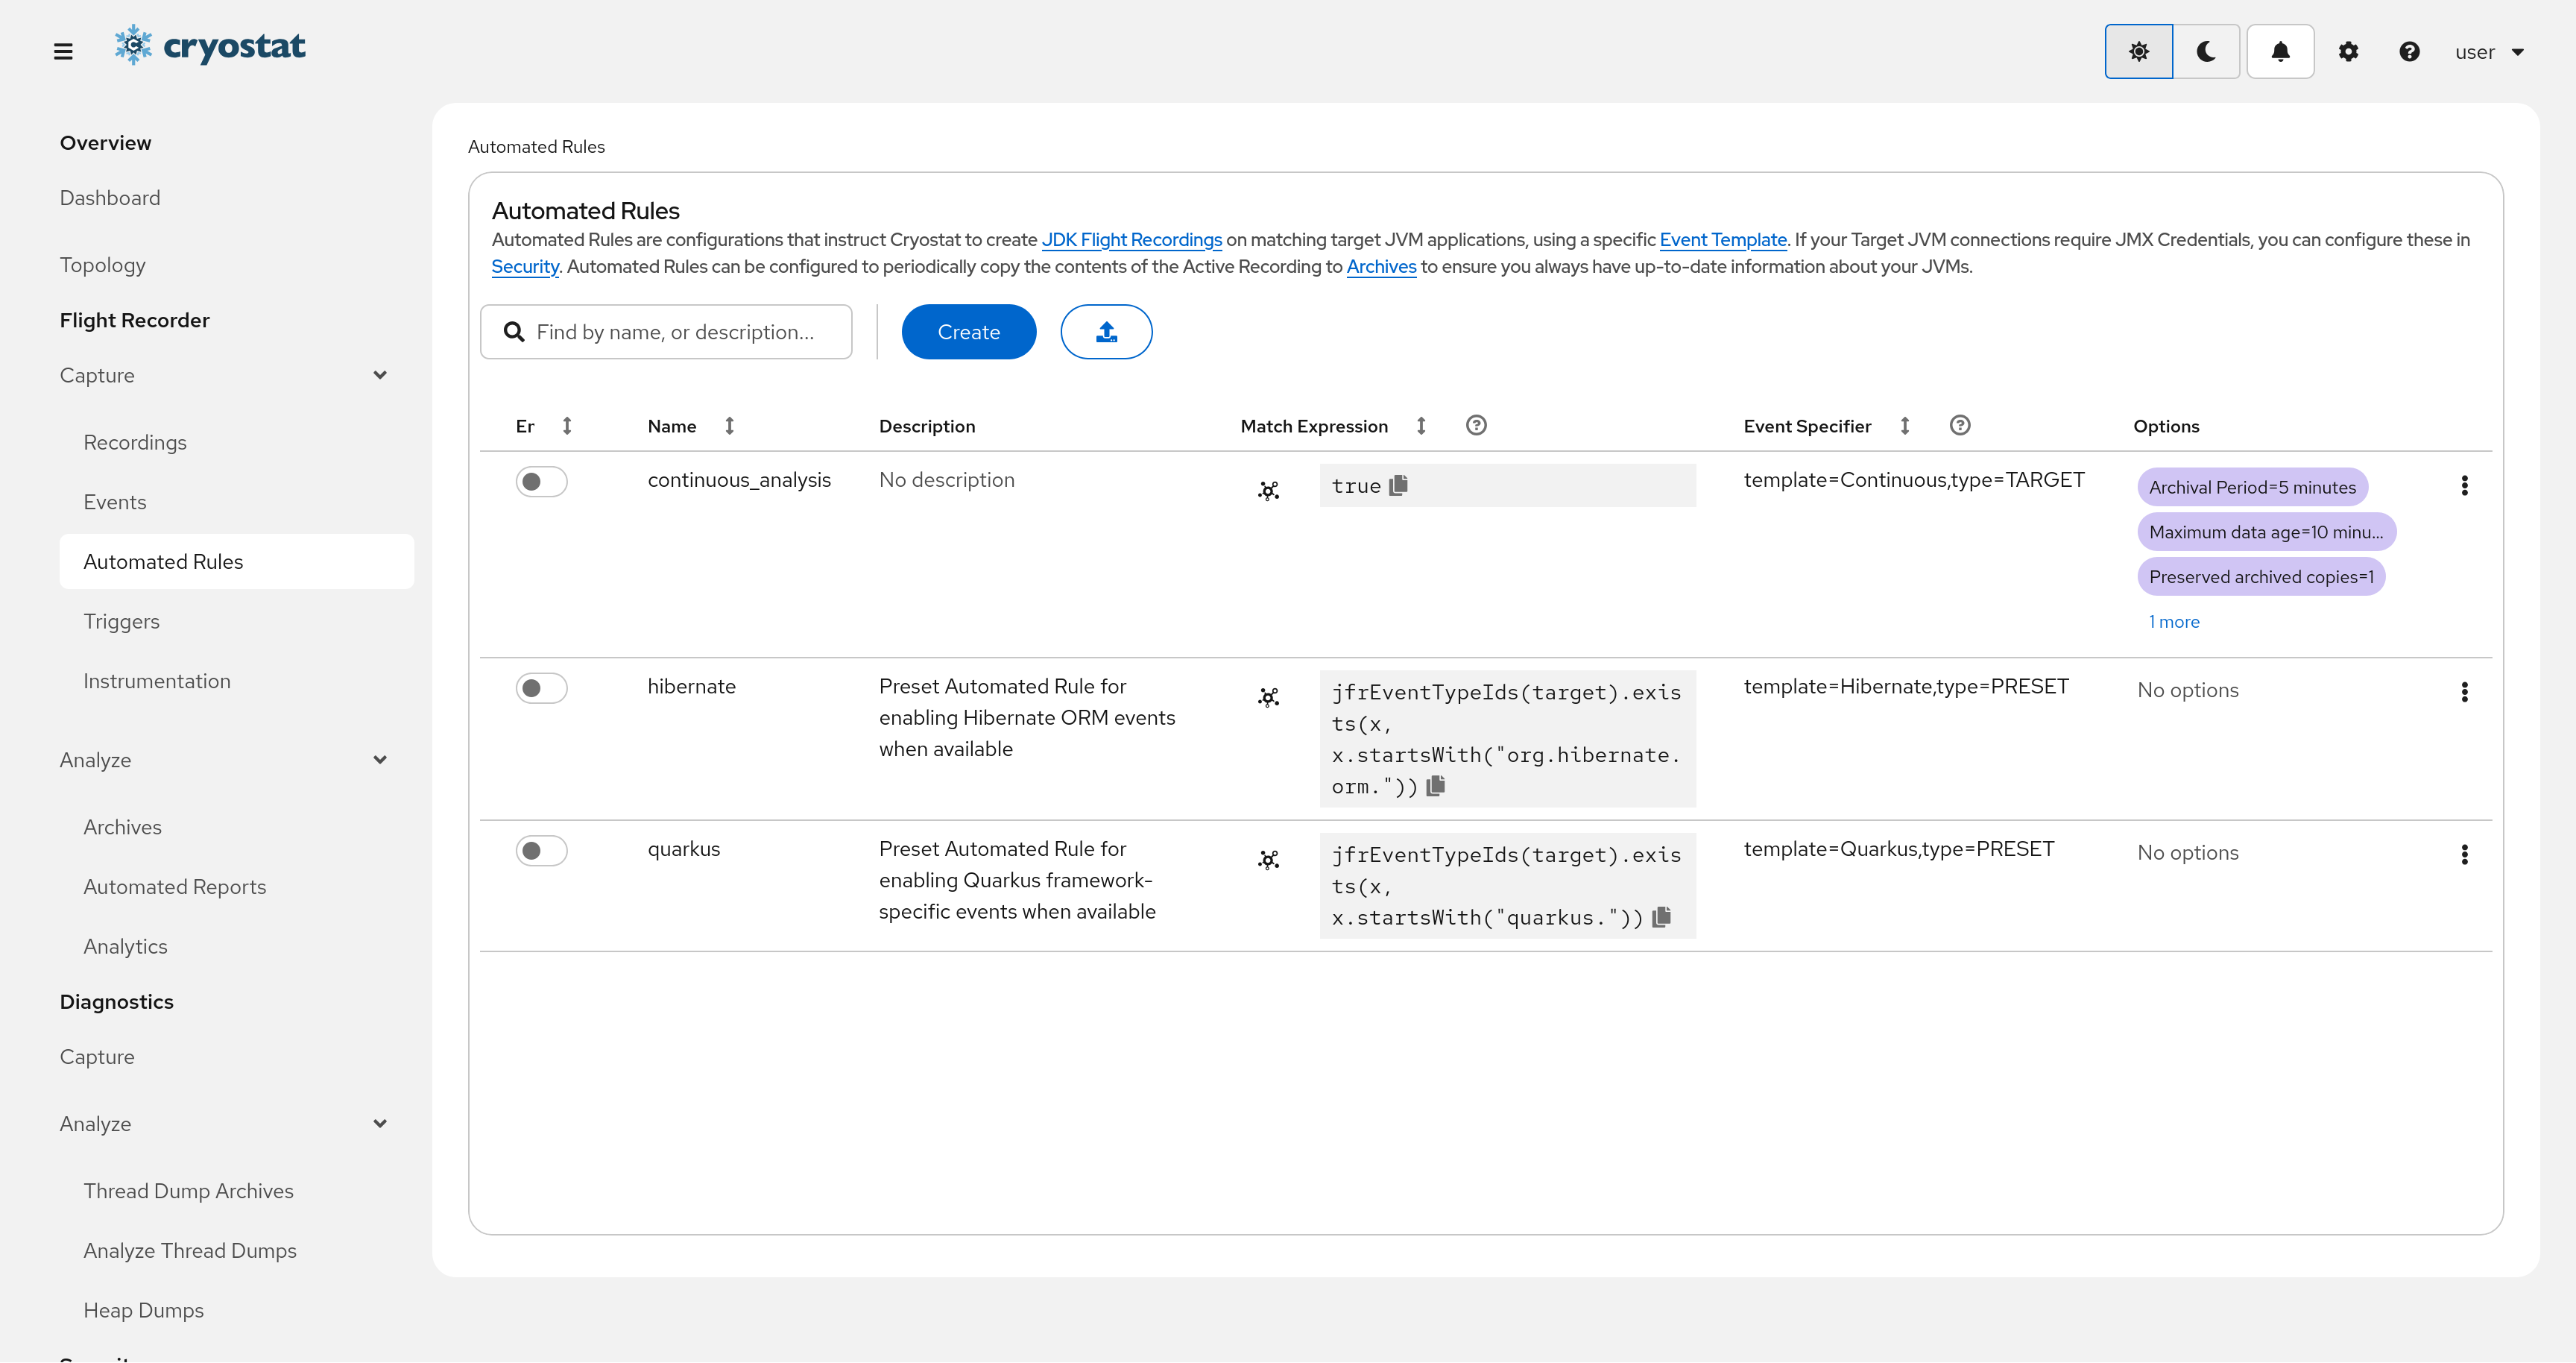
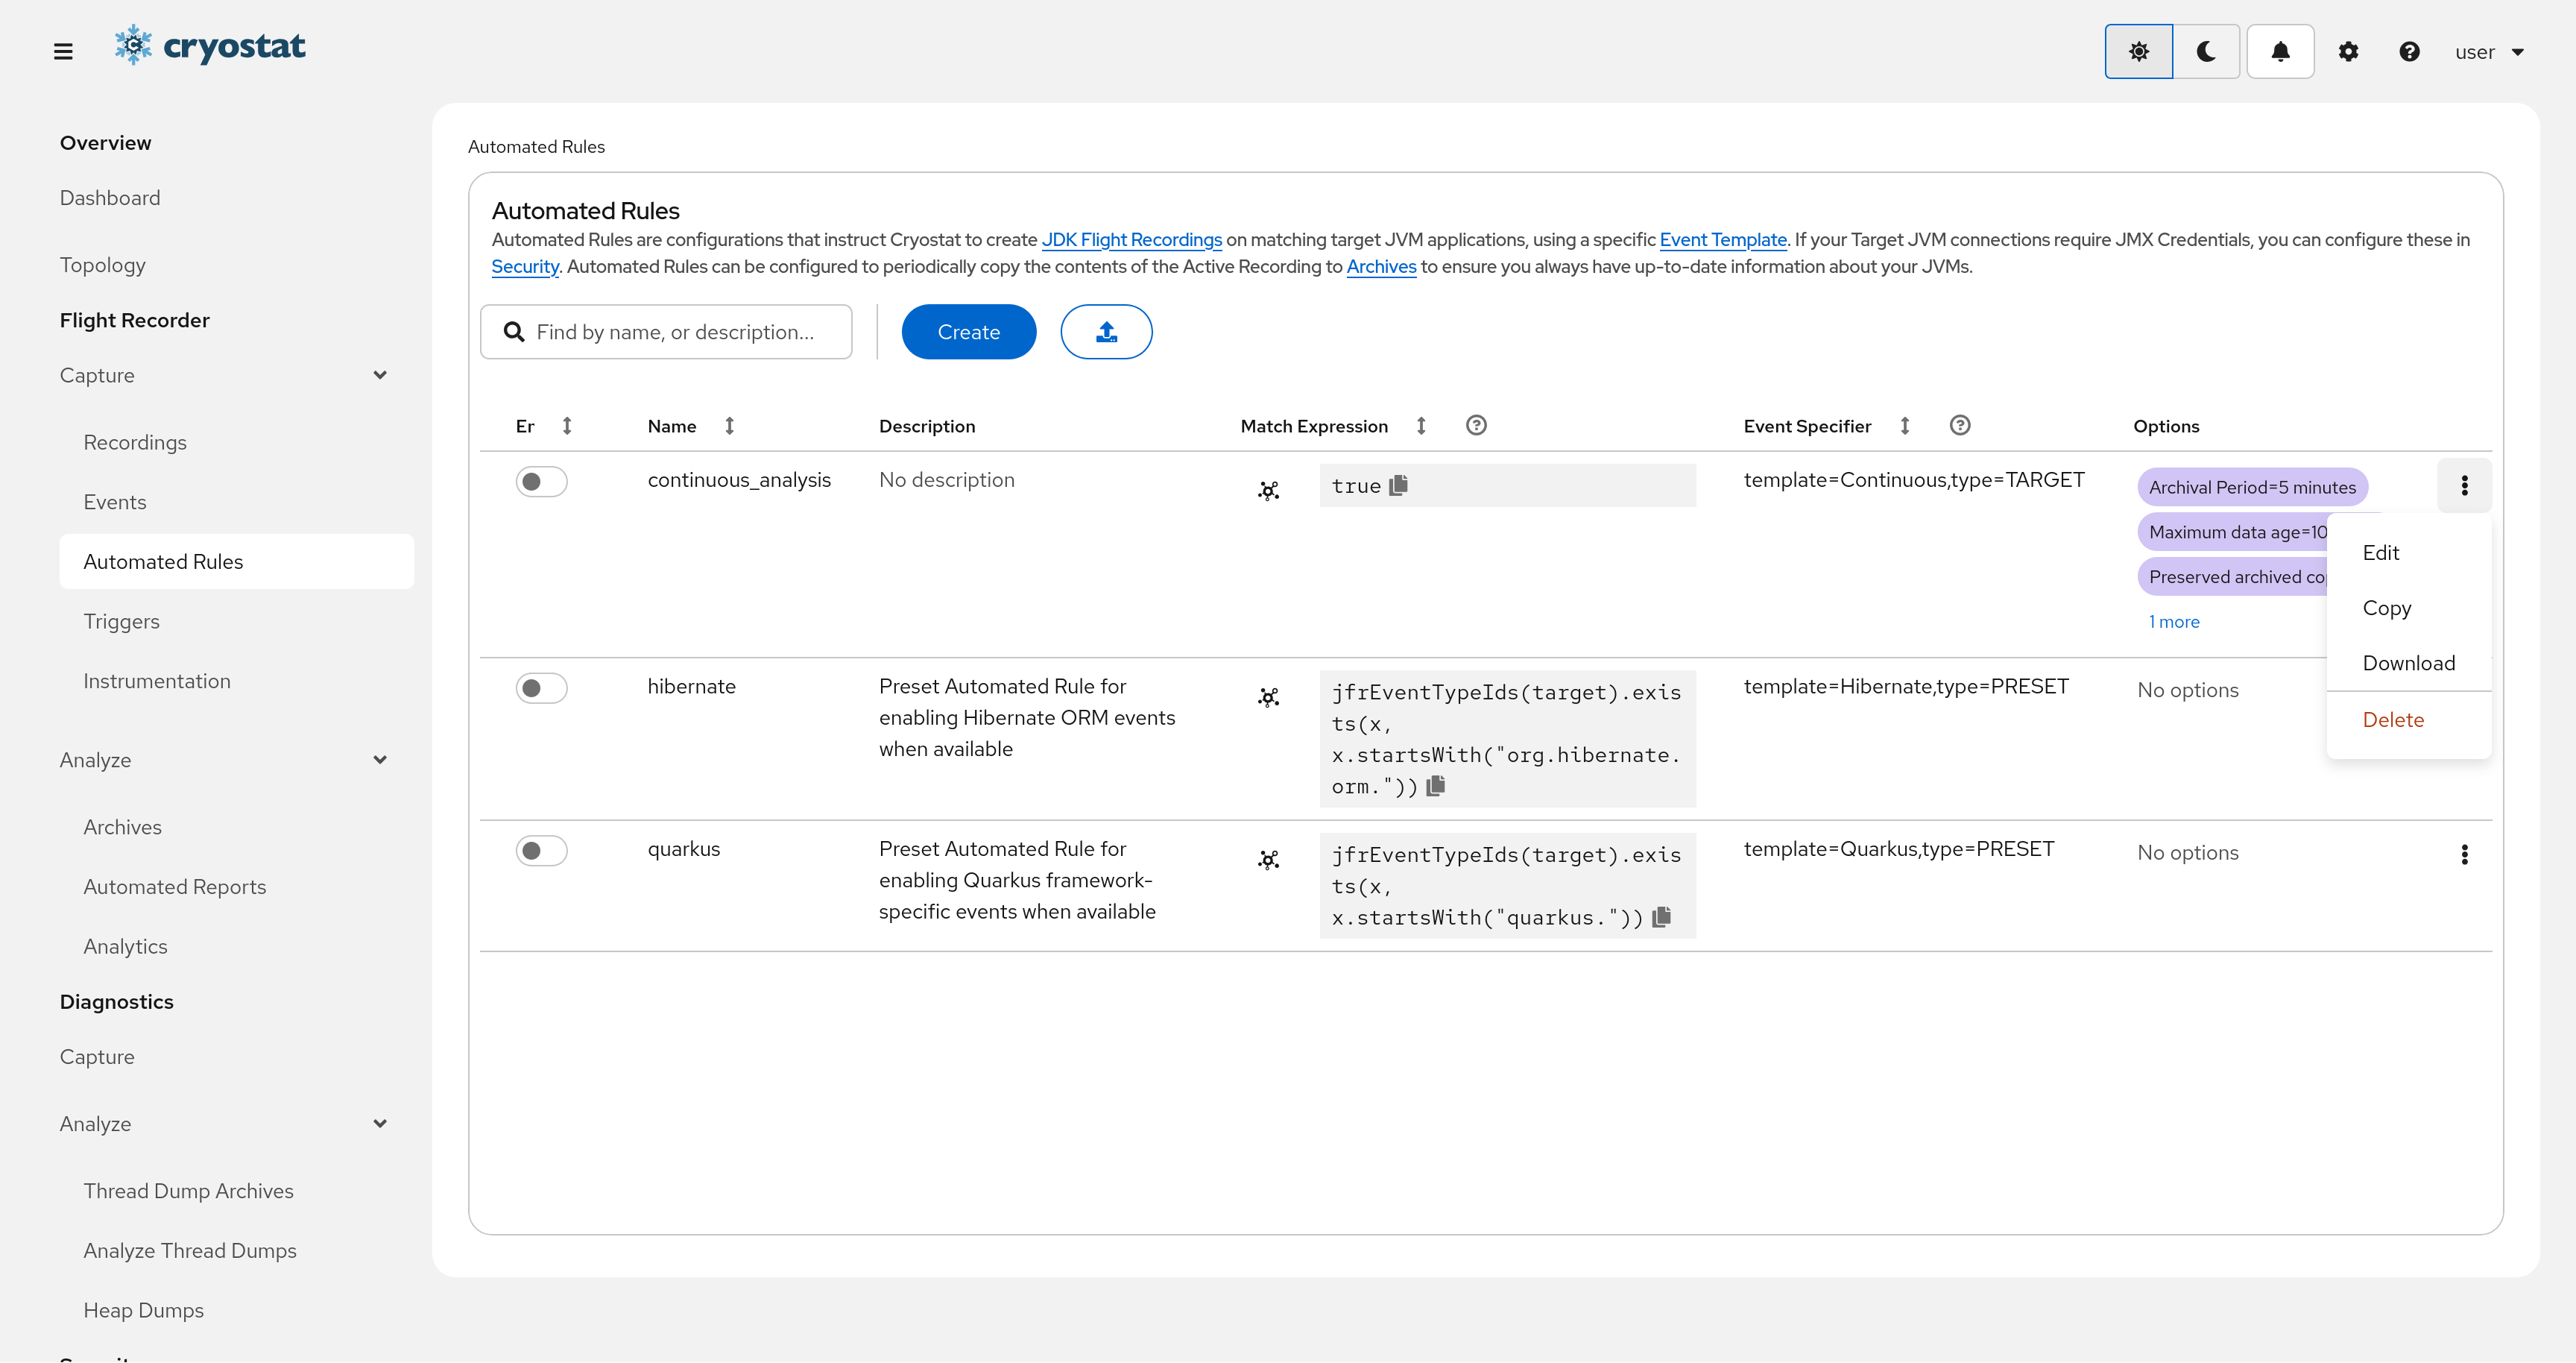
Automated Rules are configurations that instruct Cryostat to create JDKFlight Recordings on matching
targetJVM applications. Each Automated Rule specifies parameters for which Event Template to use, how
much data should be kept in the application recording buffer, and how frequently Cryostat should copy the
application recording buffer into Cryostat’s own archived storage.
Once you’ve created a rule, Cryostat immediately matches it against all existing discovered targets and starts your Flight Recording. Cryostat will also apply the rule to newly discovered targets that match its definition. You can create multiple rules to match different subsets of targets or to layer different recording options for your needs.
We’ll walk through three use cases: Continuous monitoring in a containerized JVM, Custom monitoring with Kubernetes labels or annotations, and pre-configuring automated rules within Cryostat.
Previously, if we wanted to enable always-on Continuous monitoring using JDK Flight Recorder (JFR) in a containerized Java virtual machine (JVM), we would set JVM flags on the target application, then restart the application to start monitoring. With Cryostat’sAutomated Rules, we can enable JDK Flight Recorder (JFR) at runtime to continuously monitor an already-running target application, with no restart, no redeploy, and no downtime.
Navigate to the Flight Recorder/Capture/Automated Rules Tab
Click Create to open the create modal
Configure the new Automated Rule in the create modal
Name: Enter a name for the new rule. The form will alert you if the name
entered has an invalid format. If the name is already in use then the
creation will fail and you will need to try again.
Description: Enter an optional description for your rule.
Match Expression: We will fill this field in the next step.
Enabled: Enable or disable the rule. If disabled, the rule will not be applied to any targets.
Template: Select an Event Template or enter a custom event definition. If you are
unsure which to choose, the Continuous template is useful for
always-on production monitoring with the Continuous recording
duration setting, and the Profiling template is useful for
collecting extra information for troubleshooting a specifically
identified problem with a fixed recording duration.
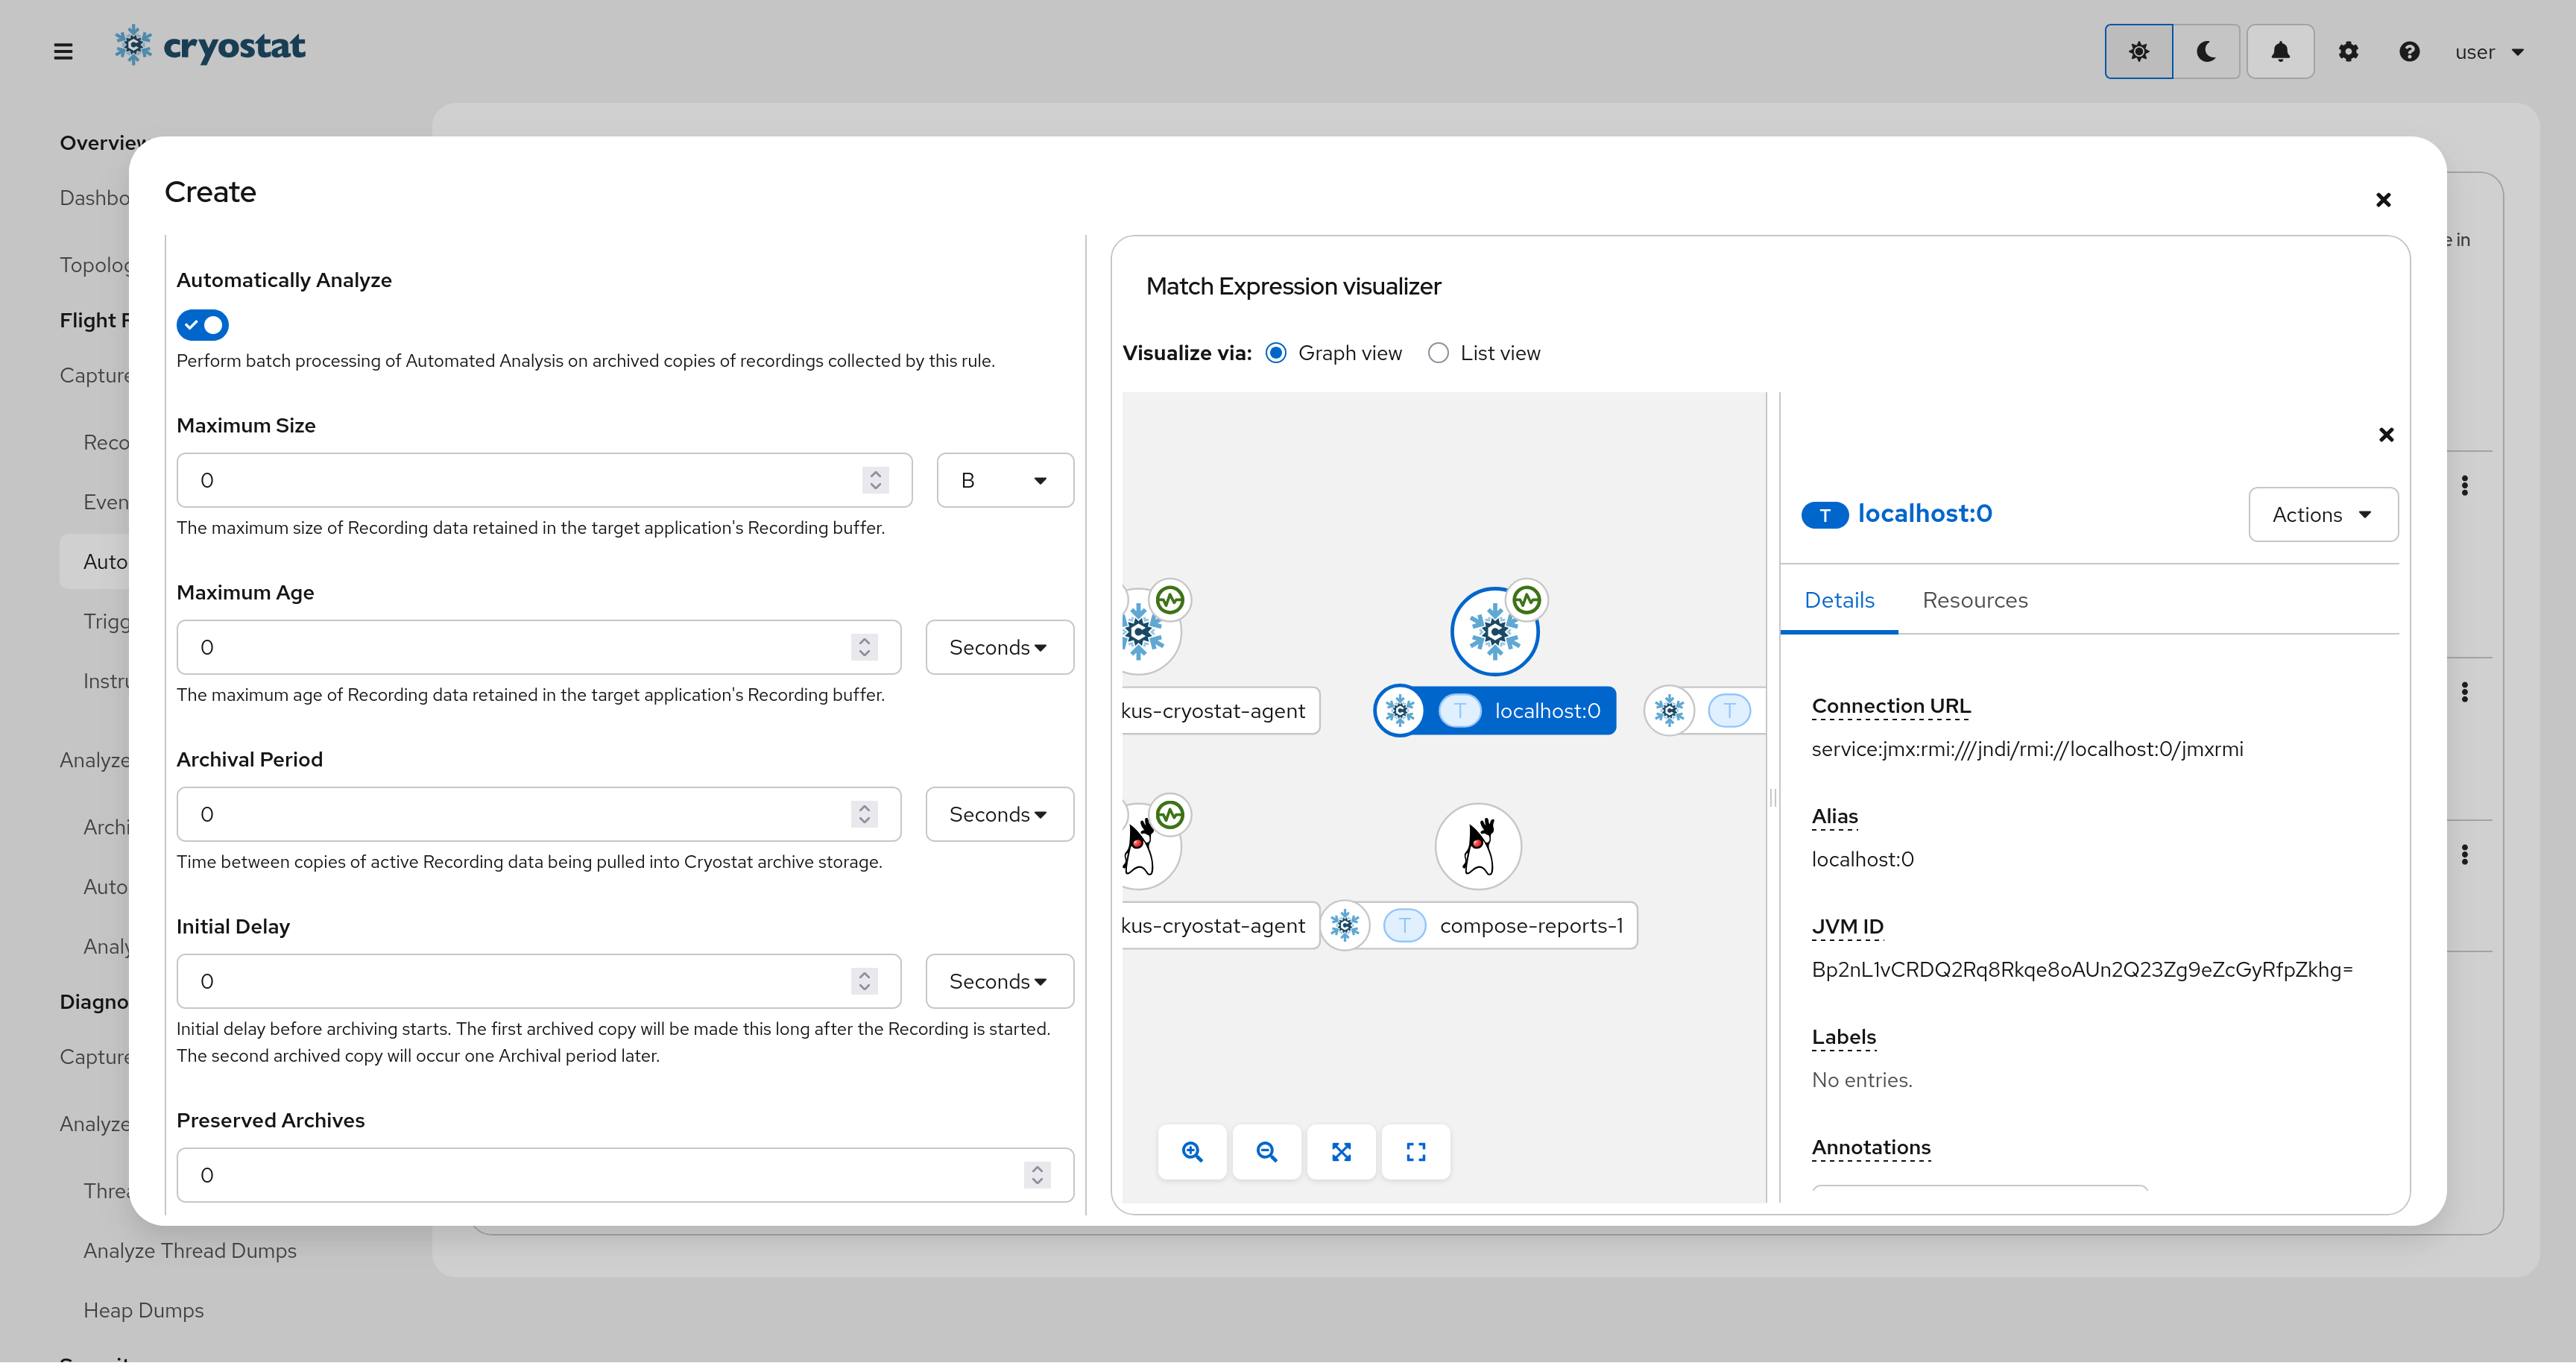
Create your Match Expression
The Match Expression in a rule definition is a Common Expression Language expression that Cryostat interprets and uses to determine if a rule should be applied to any given target. Match Expressions should thus evaluate to a boolean value. The simplest Match Expressions would be the booleans true or false; if we use true, the rule will apply to every target. The Expression has a target object in global scope, with the following form in JSON notation:
The alias, connectUrl, labels, annotations.platform, and annotations.cryostat properties are all guaranteed to be present on the target object. alias and connectUrl will be non-empty strings. The jvmId is a hash string computed by Cryostat after it successfully connects to a targetJVM and is used to uniquely identify that JVM instance - it will be empty if Cryostat has not yet connected to that target (for example, if its SSL/TLS certificate is not trusted or if Cryostat is missing the required credentials) The labels and platform annotations may be empty — in OpenShift or Kubernetes, these are populated from the labels and annotations applied to the target’s pod, if any. The Cryostat annotations map will vary per platform, but on OpenShift or Kubernetes you can expect the HOST, PORT, NAMESPACE, and POD_NAME keys to be present and non-empty. Take care to use the has or in operators when dealing with the labels and annotations map structures where specific keys may not exist.
The Expression also has a jfrEventTypeIds function in global scope, which takes the target object as a parameter and returns a list of strings corresponding to the Flight Recorder Event Types registered in the targetJVM.
Check your Match ExpressionYou can select a targetJVM to view its properties and use them to build your Match Expression.
When you enter a Match Expression in the Match Expression field, the Match Expression Visualizer in the create modal will highlight which targets are matched.
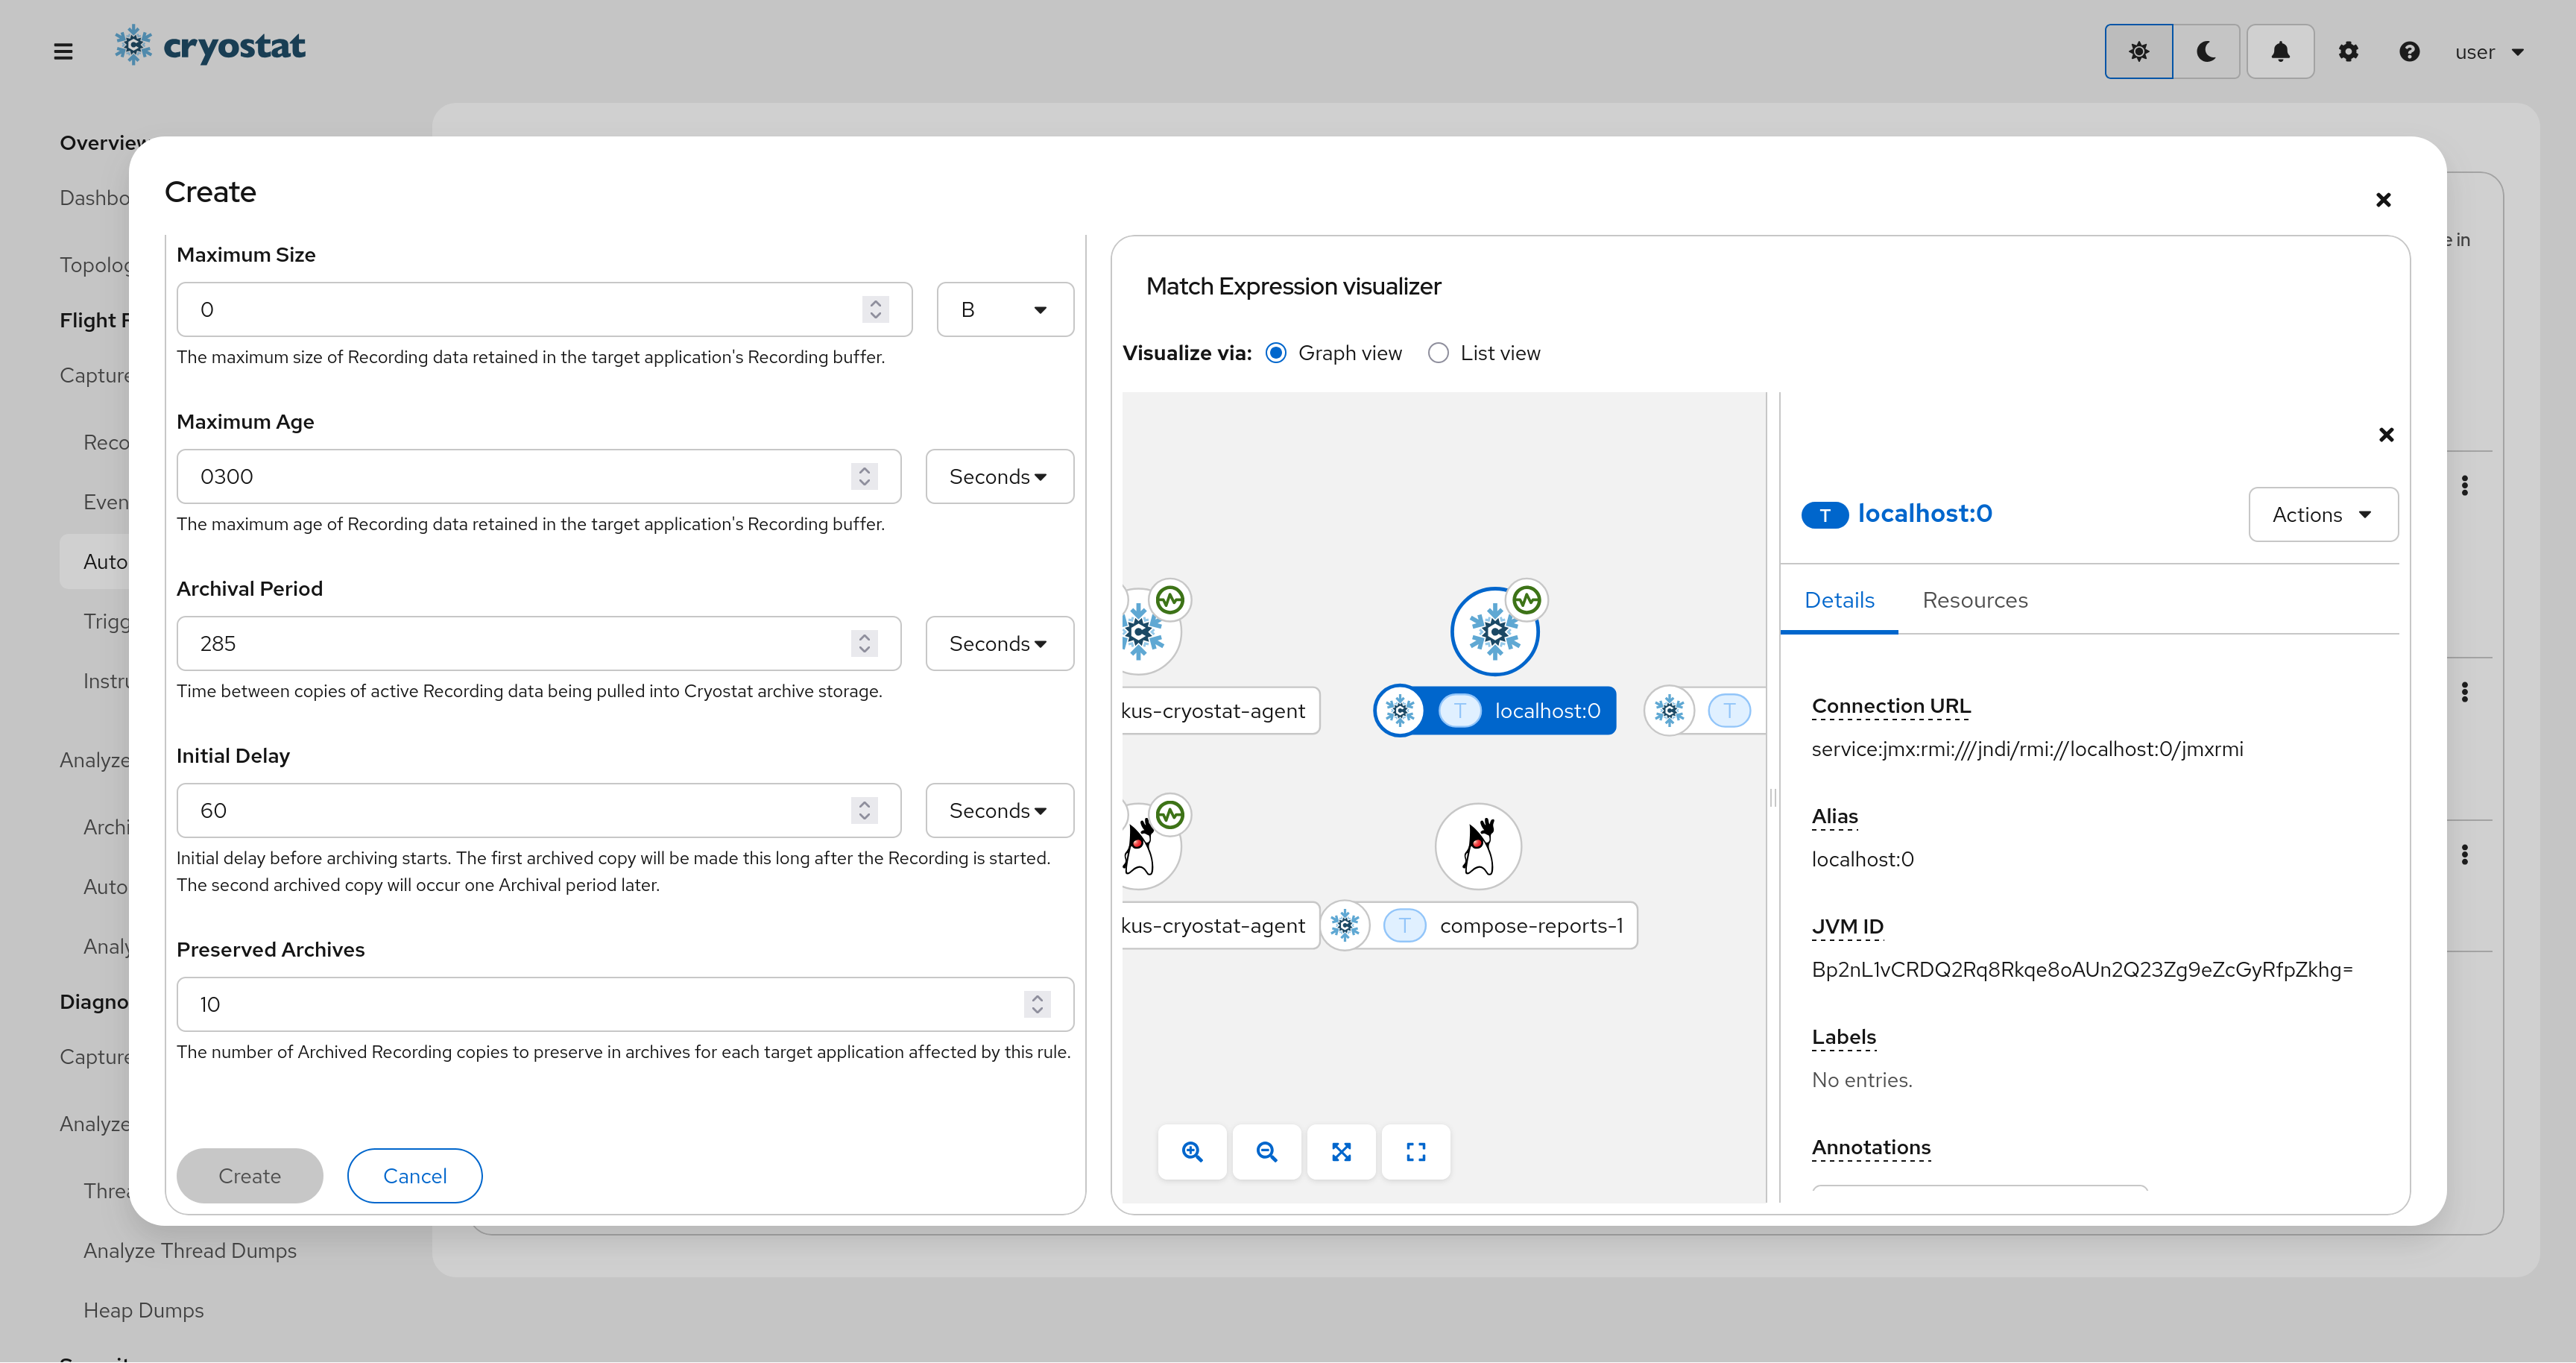
(Optional) Adjust Rule Parameters
Optionally set the Recording Options and Rule Parameters.
Automatically Analyze: whether automatic analysis should be automatically performed on Archived Recordings collected by this Automated Rule.
Maximum Size: the (approximate) maximum size of Flight Recorder data which should be held in the Active Recording buffer by the JVM. If set to 0 the buffer size will be unlimited. Once the buffer is full, Flight Recorder will discard the oldest data to make space for new data.
Maximum Age the (approximate) maximum age of Flight Recorder events which should be held in the Active Recording buffer by the JVM. If set to 0 events will not be discarded due to age. Once the buffer is full, Flight Recorder will discard the oldest events to make space for new events.
Archival Period: how frequently this Automated Rule should copy Active Recording data into Archives. If set to 0 Cryostat will only start a new Active Recording, but will not periodically copy the data into storage.
Initial Delay: Time between rule creation and when the first archived copy should be transferred. If set to 0 then the first copy will occur at the archival period set above.
Preserved Archives: The number of Recording copies to preserve in archives for each target application affected by this rule. If set to 0 data will never be copied to Archives - Recordings will be started and remain only in targetJVM memory.
In the example image, the Maximum Recording age was set to 300 seconds and the Archival Period was set to a slightly shorter time period of 285 seconds. This overlap ensures that all of your Flight Recorder data is preserved in Cryostat's archives. The initial delay is set to 60 seconds however, so the first archive copy will be made 1 minute after the rule is created. The next copy will be made 5 minutes after that, the next another 5 minute later, etc.
Click Create in the modal
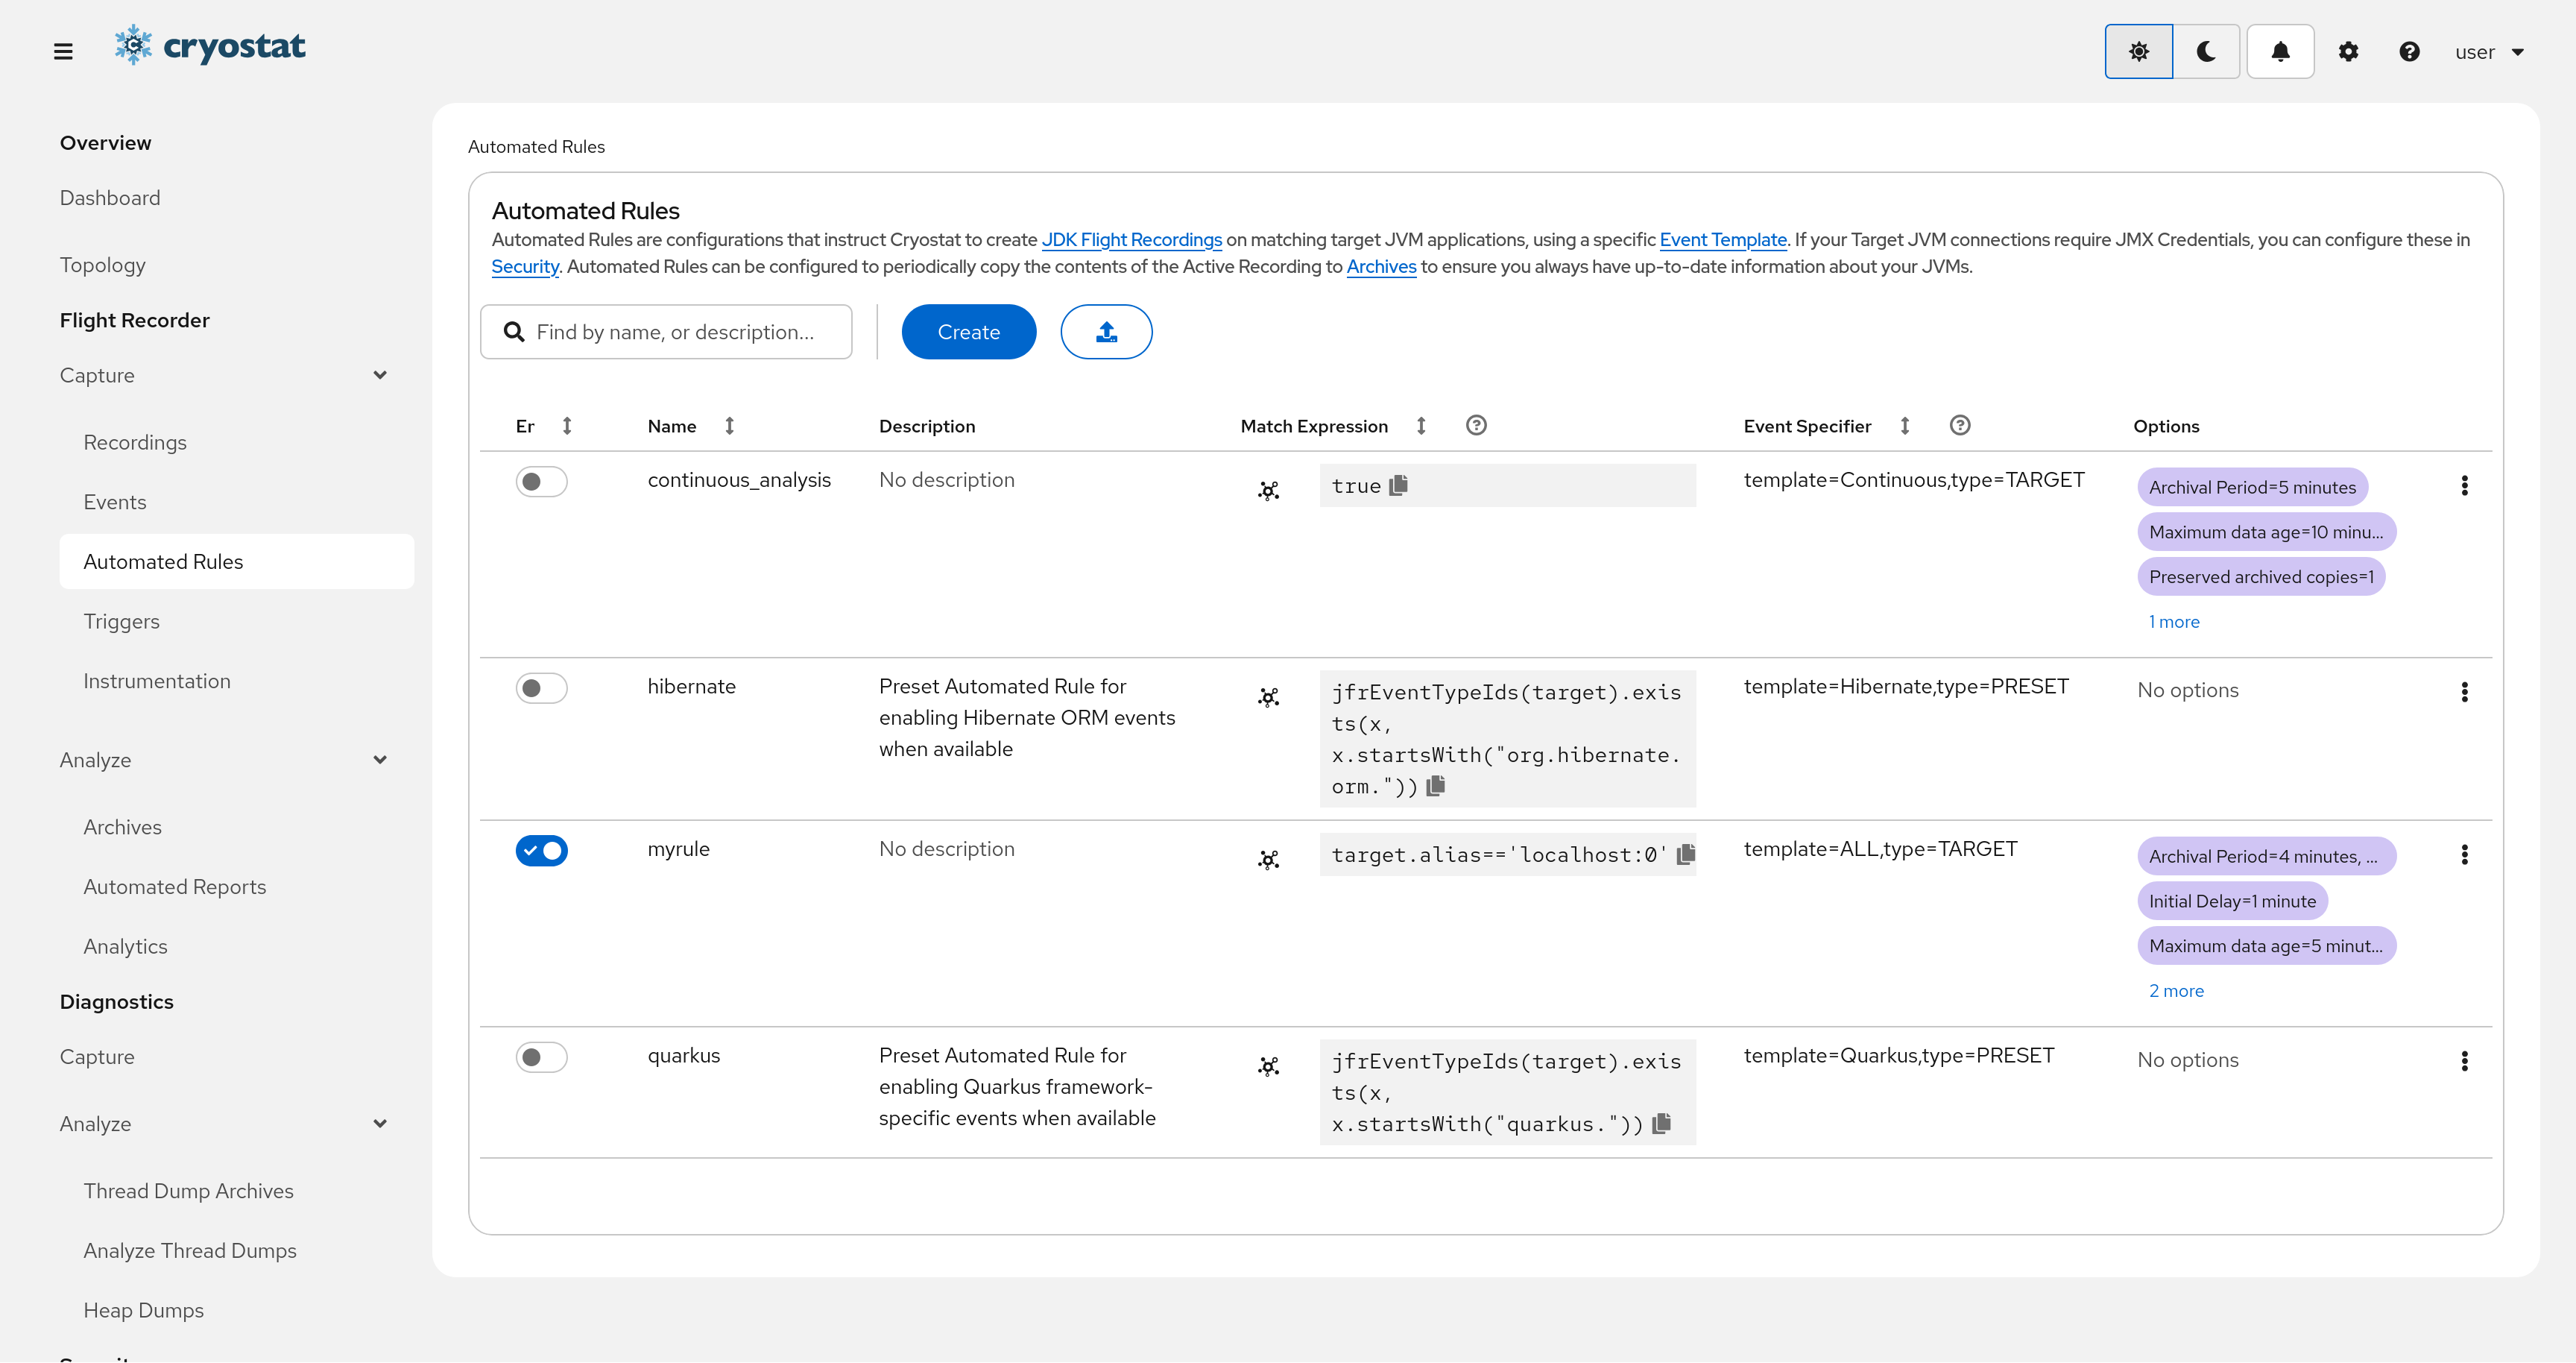
Observe the new Rule in the Automated Rules Table
The new rule will appear in the Automated Rules table.
Navigate to Flight Recorder/Capture/Recordings
Supply JMX credentials to authenticate to the target, if necessary. If
the target is not configured with JMX authentication then the
connection attempt will continue without prompting for credentials.
If the targetJVM has SSL/TLS enabled on JMX connections, it may be
necessary to add the target's certificate to Cryostat's trust store. Go
to Add a Trusted Certificate
and return to this section after completing that guide.
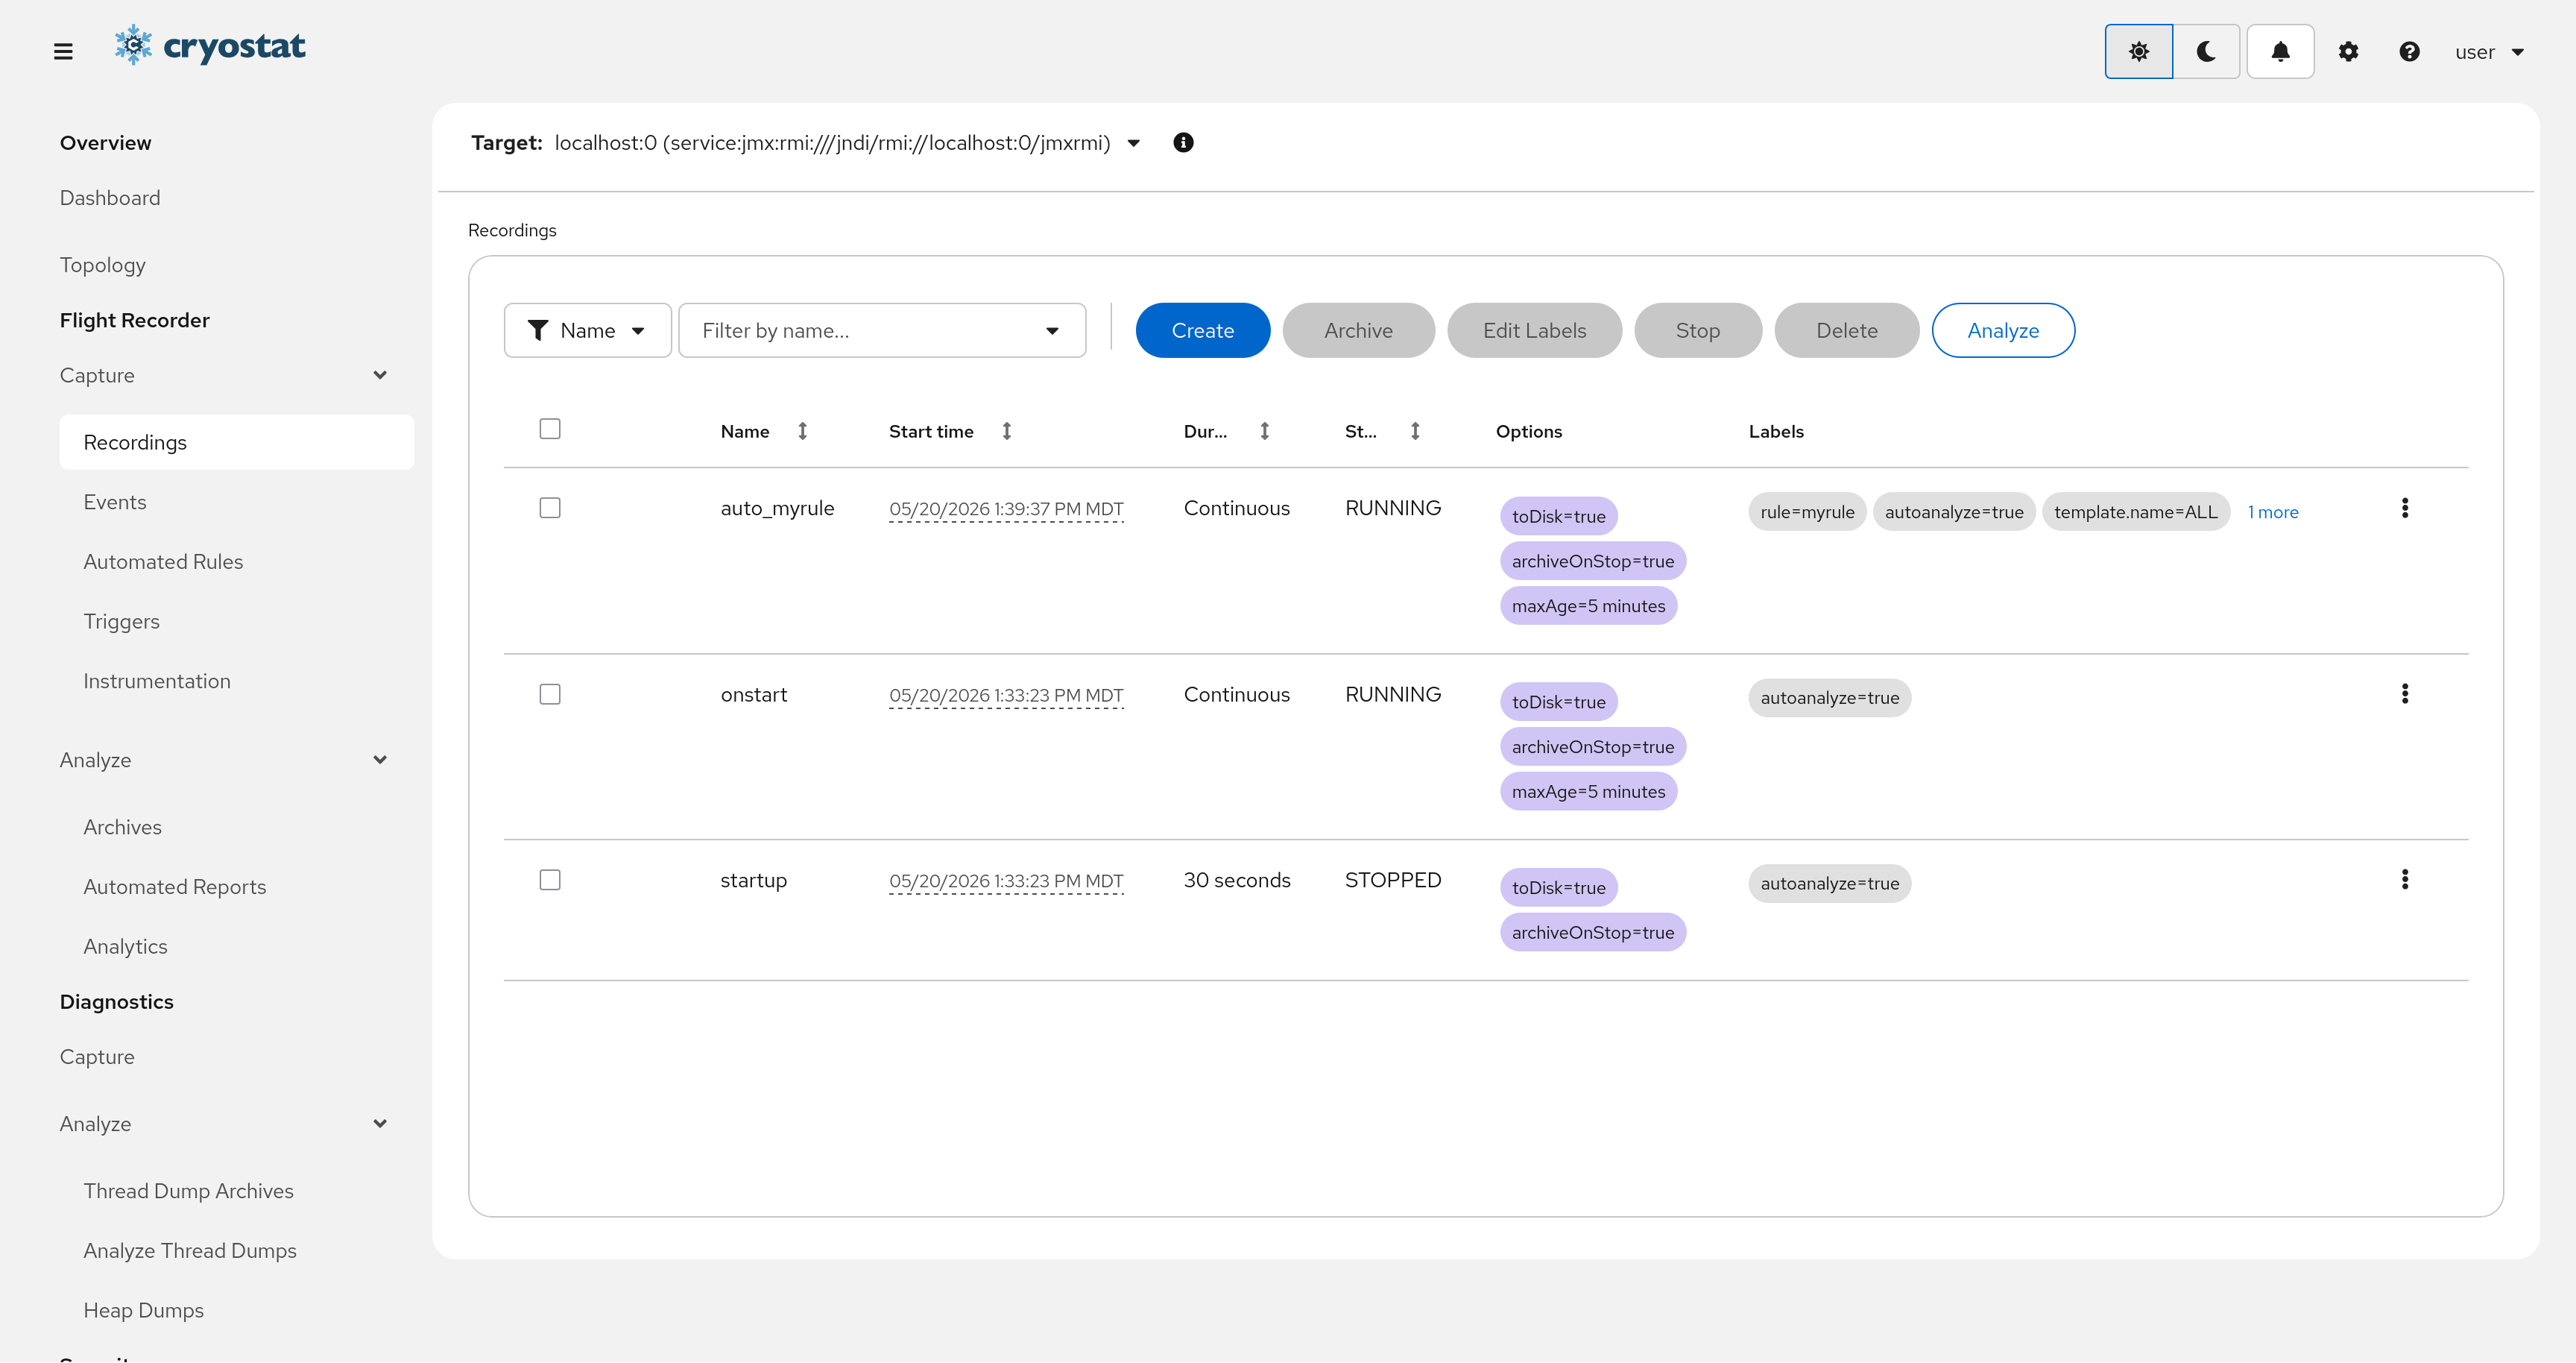
Observe the automatically generated Recording in the Active Recordings Table
Switch to the Recordings tab and view the new Recording in the Active Recordings
table.
Once you've set up your Automated Rules, Cryostat will continuously monitor applications that meet the criteria defined in those rules, with no need to restart or redeploy those applications.
We can define a rule that applies to any target application that has platform-specific attributes, such as Kubernetes labels or annotations. Here’s an example in JSON notation:
{"name":"k8sMonitoring","description":"Enable the Demo template on any target with the jfrMonitoring=true annotation","matchExpression":"'jfrMonitoring' in target.annotations.platform && target.annotations.platform['jfrMonitoring']=='enabled'","eventSpecifier":"template=Demo,type=CUSTOM","archivalPeriodSeconds":300,"preservedArchives":12}
Once we’ve created this rule definition, Cryostat will check all of the existing target applications and watch for new targets that appear with the jfrMonitoring=enabled annotation. Any matching targets found will have a Recording started automatically using the Custom Demo template from our first use case. It will take an Archived snapshot every five minutes and maintain an hour’s worth of these archives in storage.
With this rule definition in place, Kubernetes or Red Hat OpenShift users can use familiar tools like kubectl/oc or the OpenShift console to mark target applications for monitoring, without needing to interact directly with the Cryostat API or UI. This opens the door to further automating your workflow.
As an example, you might use or implement an Operator that monitors traffic flow or pod restarts and enables monitoring on pods after some criterion threshold is met, then disables it again if the target application’s behavior returns to normal. As a Kubernetes administrator, you could receive a notification when this occurs and check the Cryostat archives to retrieve JDK Flight Recorder data from the target application recorded during the problematic period, or you could view these Archived Recordings in Cryostat’s Grafana dashboard.
Note: An important caveat is that Cryostat does not watch for changes in the Kubernetes annotations or labels; it only watches to see if target applications appear or disappear. To apply the annotation to a target application, we must apply the annotation or label to the application pod (which will cause Kubernetes to roll out a new replica), and not to the deployment.
From Cryostat 4.1 onward, automated rules can be pre-configured within Cryostat and be loaded on startup. To begin, create a text file containing an automated rule definition, for an example:
{"name":"k8sMonitoring","description":"Enable the Demo template on any target with the jfrMonitoring=true annotation","matchExpression":"'jfrMonitoring' in target.annotations.platform && target.annotations.platform['jfrMonitoring']=='enabled'","eventSpecifier":"template=Demo,type=CUSTOM","archivalPeriodSeconds":300,"preservedArchives":12}
Once this has been done, create a ConfigMap within Kubernetes or Red Hat Openshift from this text file:
Now that this configMap has been created, when creating the Cryostat Custom Resource we can specify it, either through the Red Hat Openshift console under Automated Rules while creating the Cryostat Custom Resource, or through the Custom Resource YAML:
Once the Custom Resource has been created, the rule will be pre-loaded into Cryostat and be available from startup without any further configuration needed.
Instead of stepping through the form every time, you can also edit your Automated Rule definition files (JSON format) locally and quickly upload them.
Below is an example of a rule file content:
{"name":"my_automated_rule","description":"This is an example automated rule.","matchExpression":"target.alias == 'io.cryostat.Cryostat'","eventSpecifier":"template=Continuous,type=TARGET","archivalPeriodSeconds":285,"initialDelaySeconds":60,"preservedArchives":10,"maxAgeSeconds":300,"maxSizeBytes":0,"enabled":true}
Navigate to the Flight Recorder/Capture/Automated Rules Tab
Click the Upload toolbar button
Open Automated Rules upload modal
Attach a rule file by dragging and dropping it or clicking UploadSelect a rule file to upload. The file should not include the "id" field as this will be assigned by the application database.
Click Submit to upload the rule
Observe the new rule in the Automated Rules table
The new rule will appear in the Automated Rules table.
Actions such as starting/stopping/archiving Recordings and state changes such as Recordings stopping after a fixed duration
produce graphical notifications. These notifications appear both when an interactive user performs the action via the
web-client, as well as when an Automated Rule performs the action, or when any other API
client performs the action. If many Automated Rules or other API clients are active, the notification stream within
the web-client graphical console can become quite noisy.
Navigate to Settings
Click the cog or gear icon in the application masthead to access the Settings view.
The Settings view contains web-client instance configuration settings. These
affect the appearance or behaviour of the web-client frontend only, not the
behaviour of the Cryostat backend server. These frontend settings are persisted
to web browser local storage only.
Locate the Notifications Setting
The Notifications setting within this view is used to control the graphical display of notifications that
correspond to WebSocket messages sent by the Cryostat backend when actions and state changes occur. The setting
contains a toggle switch for each category of notification, as well as a global switch All Notifications , to enable/disable all
categories at once. Disabling a notification category only prevents it from appearing as a pop-up notification
toast in the current web-client instance. The notification will still appear in the notification drawer, accessed
by clicking the bell icon in the application masthead, and other web-client instances or API clients will still
receive the notification to process as they will.
Navigate to the Diagnostics/Capture PageClick on Diagnostics/Capture on the sidebar.
The Diagnosticscard and Diagnostics/Capture page
allows you to perform diagnostic operations on a targetJVM through remote access to supported Java MXBeans.
Currently Cryostat supports invoking garbage collection, capturing Thread Dumps, and capturing Heap Dumps on targetJVMs.
Thread Dumps are a profiling tool that is built into the JVM. They allow you to capture a snapshot of all the threads currently running within a JVM Process at a specific moment in time. They provide detailed information about each thread that aid in diagnosing performance issues, identifying deadlocks and determining other problems with concurrency.
You can click the Invoke Thread Dump button in the middle of the card at any time to trigger a Thread Dump that will then be uploaded to the archives.
Click the Invoke Thread Dump button
Navigate to the Diagnostics/Analyze/Thread Dump Archives view
Once the Thread Dump has been archived, a new entry will appear in the
targetJVM'sThread Dumps table. All Thread Dumps that were
saved from the current target will be listed here in their own table.
Switching to a different target from the dropdown will list only the
Thread Dumps archived from that source target. Alternatively, clearing the target will provide access to the All-Targets view. There is also an All-Archives view that allows access to all Thread Dumps currently available in storage.
The name of the Thread Dump when downloaded reflects the address of the target application. Thread dumps also support labels similar to Archived Recordings. See
Add and Edit Recording Metadata Labels.
Navigate to the Diagnostics/Capture PageClick on Diagnostics/Capture on the sidebar.
The Diagnosticscard and Diagnostics/Capture page
allows you to perform diagnostic operations on a targetJVM through remote access to supported Java MXBeans.
Currently Cryostat supports invoking garbage collection, capturing Thread Dumps, and capturing Heap Dumps on targetJVMs. Capturing Heap Dumps additionally requires a Cryostat Agent connection.
Heap Dumps are a profiling tool that is built into the JVM. They allow you to capture a snapshot of all the memory currently in use within a JVM Process at a specific moment in time. They provide detailed information about all Java objects and classes residing in heap memory at the time that aid in diagnosing performance issues, memory leaks, and other problems with memory usage.
You can click the Invoke Heap Dump button in the middle of the card at any time to trigger a Heap Dump that will then be uploaded to the archives. If the button is disabled check that the target is a Cryostat Agent target
Click the Invoke Heap Dump button
Navigate to the Diagnostics/Analyze/Heap Dumps view
Once the Heap Dump has been archived, a new entry will appear in the
targetJVM'sHeap Dumps table. All Heap Dumps that were
saved from the current target will be listed here in their own table.
Switching to a different target from the dropdown will list only the
Heap Dumps archived from that source target. Alternatively, clearing the target will provide access to the All-Targets view. There is also an All-Archives view that allows access to all Heap Dumps currently available in storage.
The name of the Heap Dump reflects the address of the target application. Heap dumps also support labels similar to Archived Recordings. See
Add and Edit Recording Metadata Labels.
The Visualize Thread Dumps page
allows you to visualize captured thread dumps from a targetJVM, looking for common problems
and analyzing for deadlocks. Thread Dumps can be analyzed from the archives or selected from a dropdown.
Select a Thread Dump
The dropdown menu will be populated with Thread Dumps from the archives for the currently selected target. If there are no Thread Dumps to source data from, capture one then return back to this view. For more information on capturing Thread Dumps, see Capture a Thread Dump.
Request analysis
Click the analysis process button in the corner of the drawer panel.
View aggregated data
Once a thread dump has been selected the view will be populated with the analyzed data. There are pie charts displaying aggregation by thread state, running methods, and lock instances.
View detailed thread information
Once a thread dump has been selected the view will be populated with the analyzed data. There is as a table for specific patterns found in the data, and deadlocks detected as well as detailed thread information. The specific findings looks for patterns in the captured thread dump that indicate common problems, for instance concurrency issues with logging. The deadlock detection table displays threads that are deadlocked as well as the objects that they are waiting for. The rows can be expanded to show the stack trace of the deadlocked thread and any locks held by that thread. The thread information table shows detailed thread information including the thread’s ID and native ID, priority, state, whether it is a daemon thread, and the CPU time used. Rows can similarly be expanded to view the stack trace and lock instances held by the thread.
Cryostat 4.2 includes basic integration with
async-profiler.
This is a beta-level feature which requires opt-in
before it is visible in the UI. The integration is also only currently
supported when interfacing with a target application
using the Cryostat Agent - the feature
is disabled for JMX target connections.
In order for Cryostat to communicate with async-profiler within your
target application, you must ensure that the correct libasyncProfiler.so is
present in your application JVM’s library path, either by using the
-Djava.library.path flag to set the property or by including the .so file
within the default path location (ex. /usr/lib64/) at application build time.
Additionally, the AsyncProfilerMXBean must be loaded and registered with your
application’s platform MXBean server. Since async-profiler version 4.3 this
can be done simply by setting the -javaagent:/path/to/async-profiler.jar
(replace /path/to/ with the correct in-container path location) JVM flag on
your application.
Once these prerequisites are satisfied you are ready to start using
Cryostat to remotely control async-profiler and capture its profiling
data. In this release, Cryostat does not provide any facilities for
archiving async-profiler data into object storage nor does it provide any
capabilities for analyzing async-profiler data. You can retrieve the profiling
session data, download it to your workstation, and analyze the data separately.
Select the Target ApplicationClik the Dropdown arrow on the right side of Target prompt to select or create a target.
If you wish to create a Custom Target from here, click Create Target displayed at the bottom. Go to Create a Custom Target and proceed from step 3.
Also, see Using the Cryostat Agent section to help discover other targets.
Navigate to async-profiler
Navigate to the async-profiler view. If your target application is not
using the Cryostat Agent, or if the AsyncProfilerMXBean is not detected,
you may see an empty state with a message explaining the apparent
problem.
Start a profiling session
Click the Create button to move into the profiling session creation
form view. This view allows you to select which profiling data types
you would like to capture, as well as to set a profiling session
duration. Unlike Flight Recordings which may run continuously,
async-profiler profiling sessions must have a fixed duration. Not all
combinations of profiling data types can be captured simultaneously as
some are mutually exclusive with others. If you attempt to create a
session including mutually exclusive data types, Cryostat will display
an error notification and the profiling session will not be created.
When you are satisfied with the configuration, click the Create button
- you may need to scroll down to see it.
Wait for the session to complete
Once the session has been created you will be brought back to the
session table view and the new session will be visible. Only one active
async-profiler session may be running at one time, also in contrast to
Flight Recorder which allows multiple concurrent recordings with
separate configurations. Sessions cannot be stopped before the
configured duration elapses, though they may be deleted prematurely -
but this will result in the captured data being lost. Once the duration
elapses the Size column of the table will populate and the State
will update automatically.
Download and delete sessions
After a session concludes, the action menu Download item is unlocked
and you will be able to download the session in .jfr binary file format
to your local workstation for independent analysis. The Create toolbar
action button is also unlocked and you may begin a new profiling
session.