Blog An Introspective Investigation
An Introspective Investigation

By
: Software Developer
Table of Contents
Preface: this blog post is about the new Cryostat Agent, which is coming (very soon!) in the Cryostat 2.3 release. The problem being investigated could potentially affect any application running on a JVM however, so consider the Agent to just be a generic application here - the main focus is on the “traditional” Cryostat components and workflow here.
Introduction
Yesterday, one of my colleagues was working on testing and validating a Cryostat Agent build for the first
time. He did the usual process of building the Agent JAR, packaging that together with a simple
hello-world-type sample application, pushed the container image, and deployed it into an OpenShift cluster
in a namespace already set up with and monitored by a Cryostat installation.
Expectations
What we expected to see was fairly simple:
- The application Deployment created would cause OpenShift to create a Pod and spin up the application
- The application, being configured with the right JVM flags, would load the Cryostat Agent
- The Cryostat Agent would spawn some threads, pick up some configuration from environment variables, then:
- generate some credentials to secure its own HTTP API endpoints
- create a Stored Credentials definition in the Cryostat server's encrypted keyring
- register itself as a Cryostat Discovery Plugin referencing those Stored Credentials
- publish a description of itself as a singleton node to the Discovery Realm it just registered
Easy enough, right? The day-to-day development workflow for Cryostat includes a testing script with a sample application that does exactly this, so daily for the past several months I have seen this flow over and over again. I was pretty confident that it worked, and reliably. On the application side, the logs are pretty clear:
Starting the Java application using /opt/jboss/container/java/run/run-java.sh ...
INFO exec  java -Dquarkus.http.host=0.0.0.0 -Djava.util.logging.manager=org.jboss.logmanager.LogManager -Dcom.sun.management.jmxremote.port=9097 -Dcom.sun.management.jmxremote.ssl=false -Dcom.sun.management.jmxremote.authenticate=false -javaagent:/deployments/app/cryostat-agent.jar -XX:+UseParallelGC -XX:MinHeapFreeRatio=10 -XX:MaxHeapFreeRatio=20 -XX:GCTimeRatio=4 -XX:AdaptiveSizePolicyWeight=90 -XX:+ExitOnOutOfMemoryError -cp "." -jar /deployments/quarkus-run.jar
__  ____  __  _____   ___  __ ____  ______
 --/ __ \/ / / / _ | / _ \/ //_/ / / / __/
 -/ /_/ / /_/ / __ |/ , _/ ,< / /_/ /\ \
--\___\_\____/_/ |_/_/|_/_/|_|\____/___/
2023-05-03 00:18:42,098 INFO  [io.cry.age.Agent] (cryostat-agent-main) Cryostat Agent starting...
2023-05-03 00:18:42,288 INFO  [io.cry.cor.net.JFRConnectionToolkit] (cryostat-agent-main) Computed self JVM ID: TwpmwTCGs72MLArzr4jkS6AwzkmQ4VqB-SS6mNrVcOE=
2023-05-03 00:18:42,291 INFO  [io.cry.age.CryostatClient] (cryostat-agent-main) Using Cryostat baseuri https://localhost:8181/
2023-05-03 00:18:42,299 INFO  [io.cry.age.Agent] (cryostat-agent-main) Registration state: UNREGISTERED
2023-05-03 00:18:42,300 INFO  [io.cry.age.Registration] (cryostat-agent-main) io.cryostat.agent.Registration started
2023-05-03 00:18:42,300 INFO  [io.cry.age.Agent] (cryostat-agent-main) Startup complete
2023-05-03 00:18:42,628 INFO  [io.quarkus] (main) agent-test 1.0.0-SNAPSHOT on JVM (powered by Quarkus 2.7.2.Final) started in 0.434s. Listening on: http://0.0.0.0:10010
2023-05-03 00:18:42,628 INFO  [io.quarkus] (main) Profile prod activated.
2023-05-03 00:18:42,628 INFO  [io.quarkus] (main) Installed features: [cdi, rest-client, rest-client-jackson, resteasy, smallrye-context-propagation, vertx]
2023-05-03 00:18:47,323 INFO  [io.cry.age.CryostatClient] (cryostat-agent-worker-2) POST https://localhost:8181/api/v2.2/credentials HTTP/1.1
2023-05-03 00:18:47,348 INFO  [io.cry.age.Agent] (cryostat-agent-worker-2) Registration state: REFRESHING
2023-05-03 00:18:47,486 INFO  [io.cry.age.CryostatClient] (cryostat-agent-worker-1) POST https://localhost:8181/api/v2.2/credentials : 201
2023-05-03 00:18:47,503 INFO  [io.cry.age.WebServer] (cryostat-agent-worker-1) Defined credentials with id 1
2023-05-03 00:18:52,505 INFO  [io.cry.age.CryostatClient] (cryostat-agent-worker-2) POST https://localhost:8181/api/v2.2/discovery HTTP/1.1
2023-05-03 00:18:52,531 INFO  [io.cry.age.WebServer] (cryostat-agent-worker-1) GET /
2023-05-03 00:18:52,532 INFO  [io.cry.age.WebServer] (cryostat-agent-worker-1) Using 'deflate' encoding
2023-05-03 00:18:52,545 INFO  [io.cry.age.WebServer] (cryostat-agent-worker-1) GET / : 204 13ms
2023-05-03 00:18:52,566 INFO  [io.cry.age.CryostatClient] (cryostat-agent-worker-0) POST https://localhost:8181/api/v2.2/discovery : 201
2023-05-03 00:18:52,588 INFO  [io.cry.age.Registration] (cryostat-agent-worker-0) Registered as 635eb4d5-b2f1-4431-a73e-373373f45e6e
2023-05-03 00:18:52,588 INFO  [io.cry.age.Agent] (cryostat-agent-worker-0) Registration state: REGISTERED
2023-05-03 00:18:52,589 INFO  [io.cry.age.Registration] (cryostat-agent-worker-0) publishing self as http://localhost:9977/
2023-05-03 00:18:52,596 INFO  [io.cry.age.CryostatClient] (cryostat-agent-worker-0) POST https://localhost:8181/api/v2.2/discovery/635eb4d5-b2f1-4431-a73e-373373f45e6e HTTP/1.1
2023-05-03 00:18:52,627 INFO  [io.cry.age.CryostatClient] (cryostat-agent-worker-1) POST https://localhost:8181/api/v2.2/discovery/635eb4d5-b2f1-4431-a73e-373373f45e6e : 200
2023-05-03 00:18:52,627 INFO  [io.cry.age.Registration] (cryostat-agent-worker-1) Publish success
2023-05-03 00:18:52,628 INFO  [io.cry.age.Agent] (cryostat-agent-worker-1) Registration state: PUBLISHED
2023-05-03 00:18:52,628 INFO  [io.cry.age.Harvester] (cryostat-agent-harvester) Harvester disabled, period -1 < 0
Reality
But, on the OpenShift testing cluster, my colleague collected these logs from the near-identical sample application:
Starting the Java application using /opt/jboss/container/java/run/run-java.sh ...
INFO exec  java -Dquarkus.http.host=0.0.0.0 -Djava.util.logging.manager=org.jboss.logmanager.LogManager -Dcom.sun.management.jmxremote.port=9097 -Dcom.sun.management.jmxremote.ssl=false -Dcom.sun.management.jmxremote.authenticate=false -javaagent:/deployments/app/cryostat-agent.jar -XX:+UseParallelGC -XX:MinHeapFreeRatio=10 -XX:MaxHeapFreeRatio=20 -XX:GCTimeRatio=4 -XX:AdaptiveSizePolicyWeight=90 -XX:+ExitOnOutOfMemoryError -Djavax.net.ssl.trustStore=/var/run/secrets/myapp/truststore.p12
-Djavax.net.ssl.trustStorePassword=fuA_2P0EZuZ3LM-7tIqs -cp "." -jar /deployments/quarkus-run.jar
__  ____  __  _____   ___  __ ____  ______
 --/ __ \/ / / / _ | / _ \/ //_/ / / / __/
 -/ /_/ / /_/ / __ |/ , _/ ,< / /_/ /\ \
--\___\_\____/_/ |_/_/|_/_/|_|\____/___/
2023-05-02 23:45:29,161 INFO  [io.cry.age.Agent] (cryostat-agent-main) Cryostat Agent starting...
2023-05-02 23:45:30,142 INFO  [io.cry.cor.net.JFRConnectionToolkit] (cryostat-agent-main) Computed self JVM ID: wxQkRVcT_7jgGtt5QLRvd7rjCw7EwDY_xMUQo8ULOl4=
2023-05-02 23:45:30,204 INFO  [io.cry.age.CryostatClient] (cryostat-agent-main) Using Cryostat baseuri https://cryostat-sample.cryostat-test.svc:8181
2023-05-02 23:45:30,278 INFO  [io.cry.age.Agent] (cryostat-agent-main) Registration state: UNREGISTERED
2023-05-02 23:45:30,303 INFO  [io.cry.age.Registration] (cryostat-agent-main) io.cryostat.agent.Registration started
2023-05-02 23:45:30,303 INFO  [io.cry.age.Agent] (cryostat-agent-main) Startup complete
2023-05-02 23:45:31,050 INFO  [io.quarkus] (main) agent-test 1.0.0-SNAPSHOT on JVM (powered by Quarkus 2.7.2.Final) started in 1.702s. Listening on: http://0.0.0.0:10010
2023-05-02 23:45:31,051 INFO  [io.quarkus] (main) Profile prod activated.
2023-05-02 23:45:31,051 INFO  [io.quarkus] (main) Installed features: [cdi, rest-client, rest-client-jackson, resteasy, smallrye-context-propagation, vertx]
… and that’s it. The Agent didn’t emit any more log lines. No registration, no publication. It did not appear in the Cryostat Web UI either, so this wasn’t just a logging problem.
The timezone in that log does not match our local time, but this was still getting late into the evening. So, I walked out of my home office for the evening, content in the idea that the next morning I would simply set up another testing cluster, put together this same deployment scenario, and troubleshoot some TLS setup that was silently breaking the HTTP communications, or something.
Confusion
The next morning - this morning - arrived, and before I had circled back to this task, I got a message from my colleague.
Hmm so it turns out there’s more now, but it doesn’t look like it did anything for an hour?
Excuse me? For an hour? I certainly don’t have anything like a Thread.sleep(3600000) in the Agent
code just for funsies. Something definitely feels wrong, and I don’t think it’s a TLS configuration
anymore. The same sample application Pod is still up and running, and the logs do indeed have more
output recorded:
...
2023-05-02 23:45:30,303 INFO  [io.cry.age.Agent] (cryostat-agent-main) Startup complete
2023-05-02 23:45:31,050 INFO  [io.quarkus] (main) agent-test 1.0.0-SNAPSHOT on JVM (powered by Quarkus 2.7.2.Final) started in 1.702s. Listening on: http://0.0.0.0:10010
2023-05-02 23:45:31,051 INFO  [io.quarkus] (main) Profile prod activated.
2023-05-02 23:45:31,051 INFO  [io.quarkus] (main) Installed features: [cdi, rest-client, rest-client-jackson, resteasy, smallrye-context-propagation, vertx]
2023-05-03 00:58:27,644 INFO  [io.cry.age.CryostatClient] (cryostat-agent-worker-0) POST https://cryostat-sample.cryostat-test.svc:8181/api/v2.2/credentials HTTP/1.1
2023-05-03 00:58:28,605 INFO  [io.cry.age.CryostatClient] (cryostat-agent-worker-0) POST https://cryostat-sample.cryostat-test.svc:8181/api/v2.2/credentials : 201
2023-05-03 00:58:28,608 INFO  [io.cry.age.WebServer] (cryostat-agent-worker-0) Defined credentials with id 1
2023-05-03 00:58:28,612 INFO  [io.cry.age.Agent] (cryostat-agent-worker-0) Registration state: REFRESHING
2023-05-03 00:58:28,618 INFO  [io.cry.age.CryostatClient] (cryostat-agent-worker-0) POST https://cryostat-sample.cryostat-test.svc:8181/api/v2.2/discovery HTTP/1.1
2023-05-03 00:58:28,699 INFO  [io.cry.age.WebServer] (cryostat-agent-worker-2) GET /
2023-05-03 00:58:28,701 INFO  [io.cry.age.WebServer] (cryostat-agent-worker-2) Using 'deflate' encoding
2023-05-03 00:58:28,750 INFO  [io.cry.age.WebServer] (cryostat-agent-worker-2) GET / : 204 50ms
2023-05-03 00:58:28,776 INFO  [io.cry.age.CryostatClient] (cryostat-agent-worker-1) POST https://cryostat-sample.cryostat-test.svc:8181/api/v2.2/discovery : 201
2023-05-03 00:58:28,808 INFO  [io.cry.age.Registration] (cryostat-agent-worker-1) Registered as f66be752-e7b8-4a84-84da-1d63b444bfae
2023-05-03 00:58:28,809 INFO  [io.cry.age.Agent] (cryostat-agent-worker-1) Registration state: REGISTERED
2023-05-03 00:58:28,812 INFO  [io.cry.age.Registration] (cryostat-agent-worker-1) publishing self as http://10.128.0.250:9977
...
73 minutes after starting, one of the Agent’s worker threads finally kicks into action and starts on Step 3.a) that I described back in the expectations. Okay, what gives?
The daily development cycle where I’ve mostly seen this working before is simply using podman. It’s
containers either way, but podman and OpenShift are significantly different, so I figured I would start
in that direction.
First stop: k8s kind. I like to use this for quick testing of this kind
because it’s quick, easy, and light. kind create cluster, helm install cryostat ./cryostat
(using the Cryostat Helm chart), and within moments
I have a reasonable Kubernetes testing environment that gets me a little closer to the full-on
OpenShift + Cryostat Operator scenario.
The next thing I need is to put that sample application with the Agent in it into this cluster. Pretty simple, I just need to create a couple of Kubernetes objects for that.
---
apiVersion: apps/v1
kind: Deployment
metadata:
  name: agent-test
spec:
  selector:
    matchLabels:
      deployment: agent-test
  template:
    metadata:
      labels:
        deployment: agent-test
    spec:
      containers:
        - name: agent-test
          image: quay.io/andrewazores/agent-test:latest
          env:
            - name: CRYOSTAT_AGENT_APP_NAME
              value: "agent-test"
            - name: NAMESPACE
              valueFrom:
                fieldRef:
                  fieldPath: metadata.namespace
            - name: CRYOSTAT_AGENT_BASEURI
              value: "http://cryostat.$(NAMESPACE).svc:8181"
            - name: POD_IP
              valueFrom:
                fieldRef:
                  fieldPath: status.podIP
            - name: CRYOSTAT_AGENT_CALLBACK
              value: "http://$(POD_IP):9977"
          ports:
            - containerPort: 9977
              protocol: TCP
          resources: {}
          securityContext:
            allowPrivilegeEscalation: false
            capabilities:
              drop:
              - ALL
      securityContext:
        runAsNonRoot: true
      restartPolicy: Always
---
apiVersion: v1
kind: Service
metadata:
  name: agent-test
spec:
  ports:
    - name: "cryostat-agent"
      port: 9977
      protocol: TCP
      targetPort: 9977
  selector:
    deployment: agent-test
  type: ClusterIP
Now I have something very similar to the original problem environment, I have reproduced the issue, and I can begin troubleshooting in earnest.
Bewilderment
Everything works. This looks just like the podman testing script - the Agent is starting up,
generating credentials, storing them, registering, self-publishing… it’s all there. It’s fine.
What did I miss?
Hey, $colleague, give me the credentials for your test cluster so I can just
oc rollout restart deployment agent-test? (I didn’t literally send this message, but the sentiment is there)
The OpenShift test environment still displays a seriously broken Agent that is just hanging, but my
quick and easy kind test environment is being too kind and running everything unproblematically.
Where is the bug? What is the bug? Who, how, when, why is the bug? We’re about to ship this thing!
Eureka
I guess there’s a pretty easy way to get more information staring us straight in the faces. If the application has JMX enabled, set up the Service to have that
jfr-jmxnamed port, then use the KubernetesApi discovery definition to do a normal Cryostat thing and start a flight recording on it. Give it a little time then retrieve the recording and inspect it with JMC and see what exactly the threads are doing. (I really did send this message, verbatim)
This is where the Introspection part of the blog title comes from. I’m trying to debug a Java Agent.
It’s deployed in a containerized environment. I have a mysterious issue where I just need to “see into”
the JVM and find out if there is an exception being swallowed, a resource being deadlocked on, etc.
If only there were a tool available to me that could… wait a second that’s just Cryostat. That
is what it is for. So, I modified the Kubernetes Service object to expose and advertise the JMX
port that already happened to be open on the sample application. Cryostat duly noticed this fact and the
application appeared in the Cryostat Web UI. I started a new recording using the Profiling template,
set it to 5 minutes and to “archive on stop”, and walked away to take a few bites of my lunch.
When I came back I had a nice JFR file sitting in the application archives in the Cryostat Web UI. I checked on the application logs to make sure that it was still broken in the way I expected it to be (it was), and downloaded the JFR file to my workstation. Now I need a tool to do the heavyweight analysis of this file, since we haven’t implemented all of those features in Cryostat yet:
$ sudo dnf copr enable almac/jmc8
$ sudo dnf install jmc
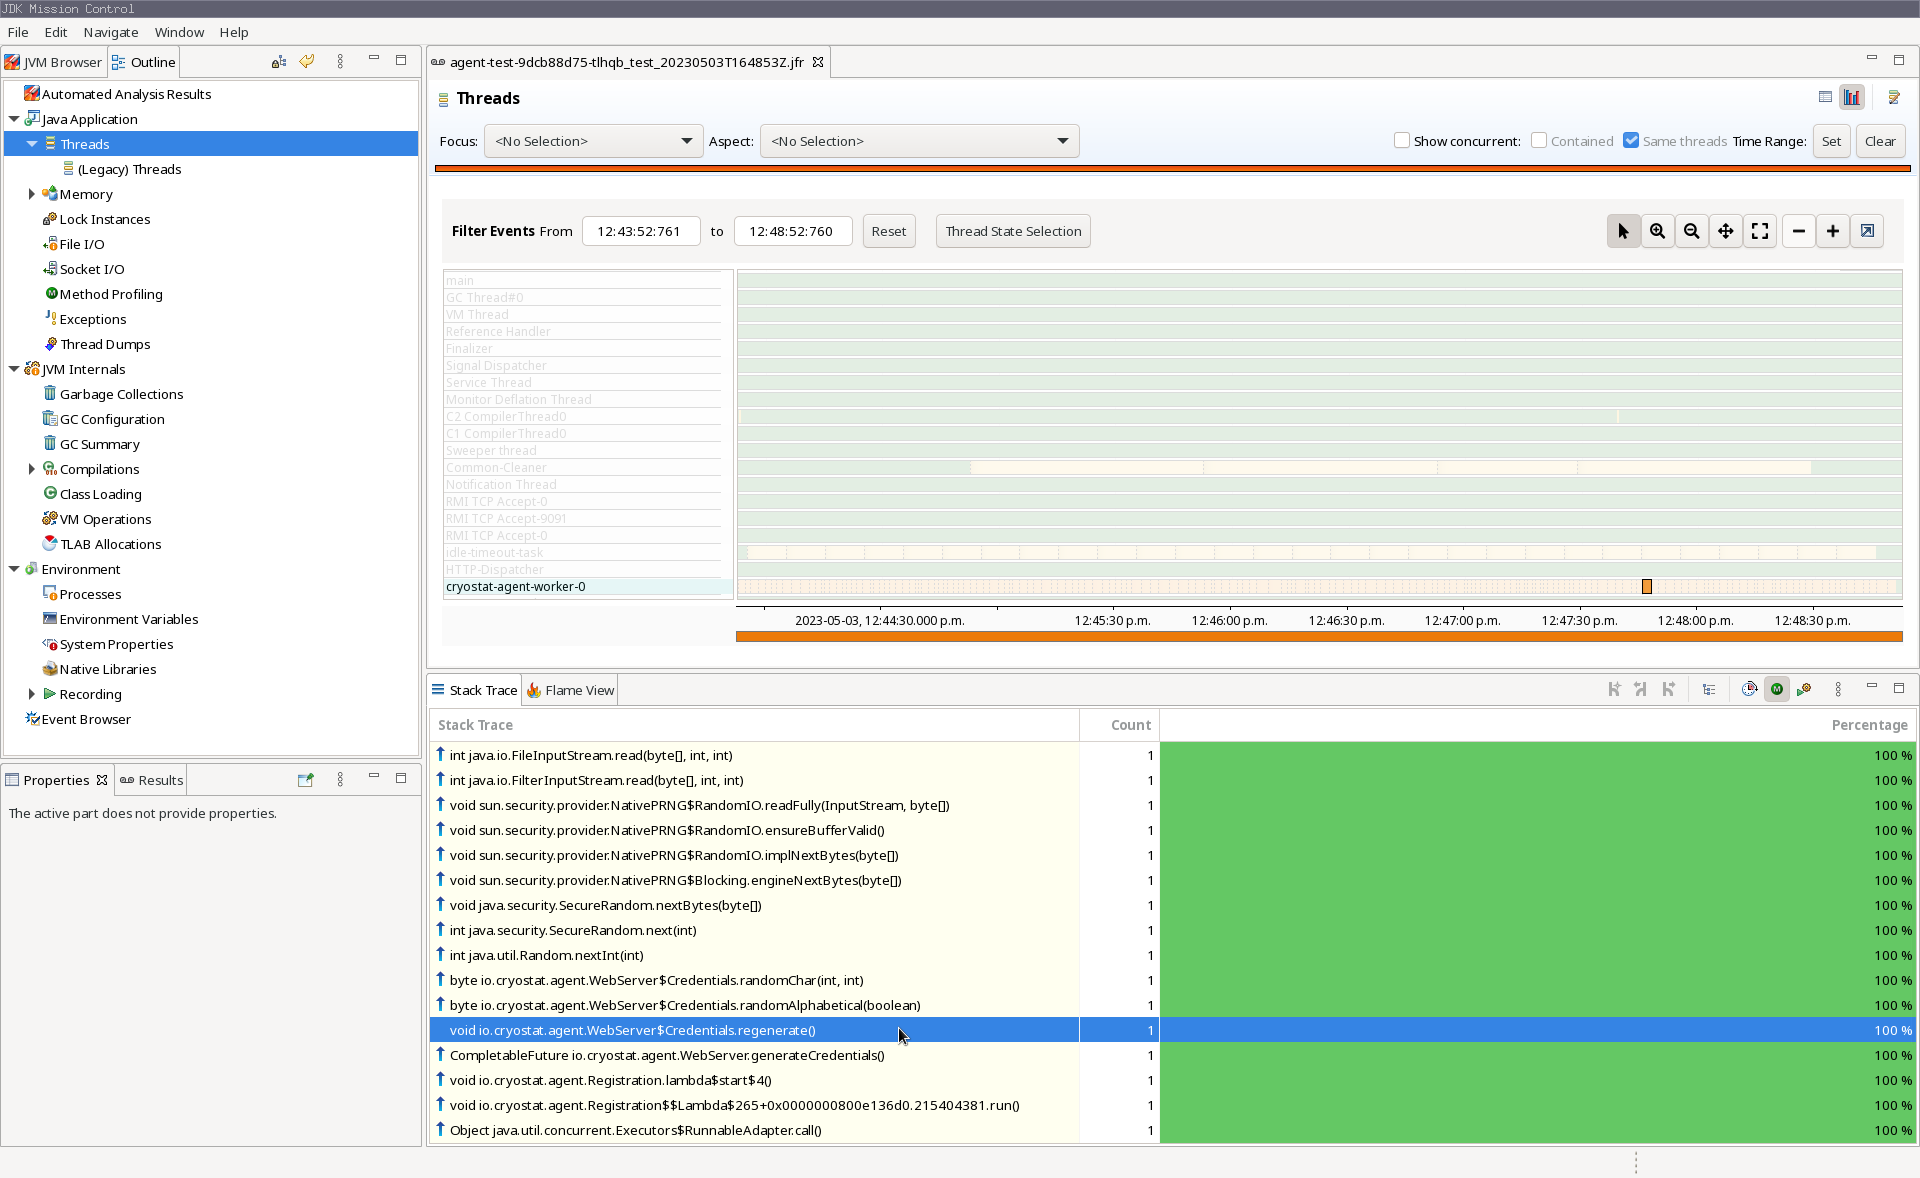
What I see here is that the thread cryostat-agent-worker-0 is getting blocked for 1-2 seconds at a time
on a call reading from /dev/random, reading out 6 bytes, and repeating that. It’s trying to generate
those credentials for securing its HTTP endpoints, but because it’s calling into the blocking /dev/random,
and there probably isn’t very much system entropy being generated on this test cluster, this process
takes forever - or more accurately, about 73 minutes.
The Fix
A bit of Googling and Stack Overflow-ing led me to try the -Djava.security.egd=file:/dev/./urandom
JVM flag, but for reasons I don’t understand and haven’t bothered delving deeper into, this didn’t work.
The redeployed sample application did have that flag set, and I could see it in the System Properties
registered in a JFR file I collected again, but the same file still revealed that the worker thread
was still reading from and blocking on /dev/random.
In the end, I just submitted a 10-line patch
to the Agent project so that it would read from /dev/urandom without forcing the application to
change any of its own configuration to suit. My colleague rebuilt the Agent JAR, repacked the sample
application, redeployed it on the original test cluster, and voilà, it all worked.
Summary
This is the first longer-form post on this blog, and the first examining a Cryostat case study rather than advertising a new feature or release. I hope you found this content equal parts informative, engaging, and entertaining. If I succeeded, then you should have taken away the following key points:
- Cryostat is launching a new Java Agent component soon
- This Agent can help with getting Cryostat to discover your applications
/dev/random&/dev/urandomcan bite you, and entropy matters- Using Cryostat to troubleshoot Java applications in The Cloud really makes JFR super accessible
- JFR is seriously a killer feature of the HotSpot JVM, and if you don’t normally reach for it in situations like this, you should consider it!
